Dimension reduction using orthogonal local preserving projection in big data

Author: Ummadi Sathish Kumar, E. Srinivasa Reddy
Journal: International Journal of Intelligent Systems and Applications @ijisa
Article in issue: 6 vol.11, 2019.
Free access
Big Data is unstructured data that overcome the processing complexity of conventional database systems. The dimensionality reduction approach, which is a fundamental technique for the large-scale data-processing, try to maintain the performance of the classifier while reduce the number of required features. The pedestrian data includes a number of features compare to the other data, so pedestrian detection is the complex task. The accuracy of detection and location directly affect the performance of the entire system. Moreover, the pedestrian based approaches mainly suffer from huge training samples and increase the computation complexity. In this paper, an efficient dimensionality reduction model and pedestrian data classification approach has been proposed. The proposed model has three steps Histogram of Oriented Gradients (HOG) descriptor used for feature extraction, Orthogonal Locality Preserving Projection (OLPP) approach for feature dimensionality reduction. Finally, the relevant features are forwarded to the Support Vector Machine (SVM) to classify the pedestrian data and non-pedestrian data. The proposed HOG+OLPP+SVM model performance was measured using evaluation metrics such as precision, accuracy, recall and f-measure. The proposed model used the Penn-Fudan Database and compare to the existing research the proposed model improved approximately 6% of pedestrian data classification accuracy.
Histogram of Oriented Gradients, Orthogonal Local Preserving Projection, Pedestrian, Principal Component Analysis, Support Vector Machine
Short address: https://sciup.org/15016602
IDR: 15016602 | DOI: 10.5815/ijisa.2019.06.06
Text of the scientific article Dimension reduction using orthogonal local preserving projection in big data
Published Online June 2019 in MECS
Nowadays, the fast growth of vehicle traffic is the significant problem of pedestrian safety. The prediction of pedestrian path is a challenging task in transportation system [1,2]. World Health Organization report reported that every year approximately 10 million of peoples die and 2-3 millions of peoples injure because of road accident [3]. The detection of pedestrian is the significant problem in different applications such as surveillance, intelligent vehicles and robotics [4,5]. This detection technique plays a significant role in public places or highly congested areas [6]. The pedestrian recognition in image is a challenging task due to the different kinds of scenarios and illumination conditions occur on urban scenes. There is a need of an efficient feature descriptor such as HOG [7], Local Binary Pattern [8], Gradient Localization Oriented Histogram (GLOH), ScaleInvariant Feature Transform (SIFT) and so on [9] to solve those kinds of problems. In some past research works researchers developed several techniques such as machine learning, deep learning technique and several conventional approaches on pedestrians’ detection and classification [10]. However, the major limitations of existing works are high computational complexity, a long training time and high training complexity.
A number of efficient methods used in existing pedestrian detection researches. The existing methods are very complex to perform in different scale of pedestrian image [11]. The traditional Deep Conventional Neural Network (DCNN) method is used for pedestrian detection but it is computationally expensive and not able to handle large training samples [12]. The multiplex network classifier includes two types such as Haar-like cascade as well as Shapelet cascade classifier, employed in pedestrian data classification [13]. The major drawback of these classifiers usually more time needed for analyze the multi-level shapelet features. In this paper, pedestrian data detection and classification technique has three steps. Initially, HOG feature descriptors extract the shape and edge of the features from pre-processed data. Next, OLPP algorithm reduce the feature dimension and it improves the classification performance. Finally, OLPP algorithm generates output that is the input for the SVM classifier and it classifies the pedestrian and non-pedestrian data.
The structure of the paper is as follows. Section II presents survey of several recent papers on pedestrian data dimensionality reduction and classification. In section III, an effective feature descriptor, dimensionality reduction technique and classification: HOG, OLPP and SVM classifier are described. Section VI demonstrated that experimental performance of pedestrian classification for proposed and existing methods. The Conclusion is made in section V.
-
II. Related Work
Numerous researchers have suggested different kinds of pedestrian data dimensionality reduction and classification techniques. A brief evaluation of several significant contributions to the traditional literature presented in this section.
J. F. Kooij, et. al. [14] presented new method for detect the high level as well as low-level behaviors of tracked objects namely Switching Linear Dynamical Systems (SLDS). The SLDS approach identify the different kinds of actions like spatial distribution, high level temporal motion dependencies as well as low level object dynamics. The extracted features were not quantized but, represents the actions with variance in the continuous feature space. Higher computation time is required for the longer tracks to minimize more information and reduce more clusters.
X. Li et al. [15] presented cyclist and parallel pedestrian detection using Fast R-CNN (FR-CN) technique with localization and particular post processing step. Generally, the upper bodies (UB) of the cyclist and pedestrians are almost same and visible. So, the UB was used to extract the Multiple Potential Regions (MPR) features from appeared object. The FR-CN model performed parallel tasks such as cyclist and pedestrian detection, so the overall performance improved. This work concentrated on the detection of single object in parallel tasks of cyclist and pedestrian detection. But, not able to detect the multiple objects.
-
B. Chen et al. [16] proposed m-estimator with local low-rank regularization scheme for robust image compressive sensing in impulsive noisy environment. The l -norm was mainly responsible for the performance degradation under impulsive noise, so the author substituted it with the robust Welsch m-estimator, which showed a great ability of managing impulsive noise in a wide range of applications. While performing with a number of sensing recovery framework, the complexity of the proposed framework increase with high impulsive noise.
A. Maronidis, et al . [17] proposed a novel Product Compressive Sampling (PCS) method, which was used for scalable image annotation. The proposed PCS strategy identifies the relationship between the sparsity levels of data. Also, reduce the feature dimensionality in image annotation. But, in terms of classification performance computational complexity was more.
S. Zhu, B. Zeng, and M. Gabbouj, [18] designed an efficient mechanism for extract the statistical information from each image blocks by Block based Compressed Sensing (BCS). This mechanism was applied in encoder sider of the original image block in order to extract the statistical information. In addition, it helped to allocate measurements in the compressive sensing sampling. In adaptive sampling mechanism a number of features were presented in training set, hence overfitting problem increase.
-
III. Problem Statement
This section describes about the problem statement of dimensionality reduction in big data during pedestrian data classification and also, explained about how the proposed methodology gives solution to the described problems. The complexities of several existing research on pedestrian data classification methods addressed below.
-
• In big data, large volume of data is collected and many of them are redundant and irrelevant. Therefore, dimensionality reduction methods are required. The existing Principal component analysis (PCA) method is usually linear combinations of variables that is difficult to perform in high dimensional data [19].
-
• The traditional dimensionality reduction methods such as PCA, Independent Component Analysis (ICA), Singular Value Decomposition (SVD) etc. majorly focus on homogeneous data. Also, these methods are computationally more expensive when applied to the heterogeneous data [20].
-
• The pedestrian data includes a number of features because multiple objects present in the pedestrian data. Each object consists of different expressions, various peoples, etc. Therefore, difficult to predict the pedestrian data, so suitable feature descriptors are required [21].
-
• The fuzzy rule mechanism was employed in pedestrian classification. The major limitation of this mechanism is the manual and time-consuming procedure for rule generation and membership parameter tuning [22].
Solution: To overcome the above-mentioned drawbacks, an effective OLPP feature dimension reduction method is implemented for improving the performance of pedestrian’s data classification. In this research, HOG descriptor is used to detect the shape and edge of the pedestrian. Hence, a high- dimensional data is converted into low-dimensional space using random measurement matrix. In the next step, the OLPP algorithm is used for feature dimensionality reduction. Finally, the SVM classifier classify the pedestrian and non-pedestrian data.
-
IV. Proposed Methodology
In the domain of computer science, handling huge collection of images are the challenging task. In this paper, compressive sensing based dimensionality reduction is performed on Penn-Fudan Pedestrian database. Here, the dimensionality reduction includes two processes: feature extraction and feature reduction.
Initially HOG features are extracted for detecting the shape and edges. In OLPP, the PCA method is used for dimension reduction and then the adjacency graph is constructed with the corresponding features. After that, the weights are placed and orthogonal projections are computed. From the OLPP embedded transformation matrix, feature vectors are obtained and it is forwarded to the next step for selection of efficient feature vectors. In the next step, the extracted feature information is entered into the classification block as an input. An automated classification of SVM approach is utilized for classifying the pedestrian data and non-pedestrian data. The proposed pedestrian classification architecture is shown in Fig.1.
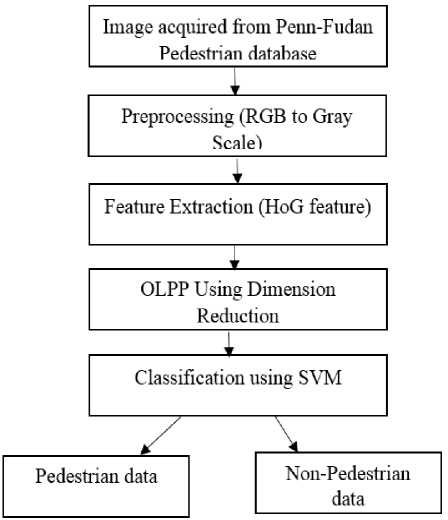
Fig.1. Proposed architecture of pedestrian data detection and classification
-
A. Database Description
In pedestrian data classification, Penn-Fudan Database is used for input data acquisition. This database includes 170 images along with 345-labeled pedestrian data. The 170 pedestrian data are collected from two different universities. The 74 images collected from Fudan University and 96 images are collected from Pennsylvania University [23].
-
B. Preprocessing
Preprocessing is the significant step and it is carried out to remove the unwanted noise and object components of the image. It is difficult to detect the edges and texture features from color images. Moreover, the color image consists of RGB scales and various intensity labels. The RGB represent through 3 channels. Each channel generally consists of 8-bits. Hence, the color image consists of intensities for each scale, so it takes more space to store and manipulate. Here, the conversion of input color image to grayscale image is performed and it decrease the computational complexity of pedestrian’s data classification.
-
C. Feature Extraction
The feature extraction step is very essential to extract the relevant features. In addition, it calculates the derived features such as informative, non-redundant, etc. Feature extraction is related to dimensionality reduction. Here, HOG feature descriptor is used for extracting the relevant features and explained in following sections.
-
a. Histogram of Oriented Gradients Feature Descriptor
HOG descriptor is a local feature descriptor, which is applied in image processing and computer vision technique for detecting the object. The edge information about gradients determine by applying HOG feature vector [24]. The main purpose of HOG is to characterize image regions and detect the objects from the Medical image. With the help of HOG descriptor, shape as well as local object appearance information’s are provided by the detection window.
In detection, window size is indicated as vw; x h w. pixel area along vertical and horizontal direction and separated into some blocks of vbk x hbk which are again partitioned into local spatial sections called as cells of size pixels, therefore each block has 4 cells and each window has 8 blocks. Consecutively, to calculate the gradients, two kernels in the a and b directions and find and the greatest gradient magnitude for each pixel. The gradient value represented as G and at point p detection window is represented as D which is shown in equation (1) and (2),
Ix = G * D(x,y) p .(1)
Iy = GT * D(x,y)p .(2)
The gradient magnitude and orientation 0 of the gradient at point p are shown in equation (3) and (4),
I(x y)'p = V(IX (x,y)p)2 + (Iy (x,y)p)2 .(3)
p
= tan
a
I (x,y)' p . I (x,y)' b ,
The histogram influences every gradient vector magnitude, higher magnitude impact more on the histogram.
-
D. Feature Dimension Reduction
After preprocessing, OLPP is used to reduce the large dimensions of features. The high number of irrelevant feature decreases the accuracy of pedestrian’s data classification. The feature dimension reduction technique is used to decrease the feature space without losing the precision of classification.
-
a. Orthogonal Local Preserving Projection
OLPP algorithm is differ from PCA and Linear Discriminant Analysis (LDA), but purpose of using both algorithms is dimensionality reduction. Since, initial step of the algorithm helps PCA in dimensionality reduction. A contagiousness chart of OLPP represents the class relationship between the samples. It is difficult to recollect the information since Locality Preserving Projections (LPP) is non-orthogonal ordinarily. This drawback overcome by the usage of OLPP technique. The Orthogonal expansion of LPP is called as OLPP. The steps included in OLPP are:
-
• PCA Projection: The PCA algorithm calculate the covariance between the features so, reduces the data dimensionality.
-
• Constructing the Adjacency Graph: The set of data is indicated as Xd = [d1,d2,....,di.] . The a’ t „th
node matches to the data d . An edge between nodes a and b , if d and d are “close”, i.e. d among p nearest neighbors of d or d is among p nearest neighbors of d . If the class information is available in any two nodes are simply put an edge between that two nodes belonging to the same class.
-
• Choosing the Weights: If the node a and b are connected, the weight W is calculated using equation (5).
II d a - db\\
W ab = e t . (5)
Where,
The variable t is indicated as constant.
If the node a and b are not connected means we Put W ab = 0.
-
• Computing the Orthogonal Basis Functions:
After finding the weight matrix W we calculate the diagonal matrix M . A diagonal matrix M is defined as the sum of W whose entries are column (or row) that is expressed in the equation (6).
Maa =£Wba •(6)
After that calculate the Laplacian matrix L using diagonal matrix M and weight matrix W which is shown in equation (7).
Lm = M - W.(7)
Let[V ,..., V ] be orthogonal basis vectors are defined in equation (8).
r (k - 1) = [V 1 ,...,V , - 1 ].
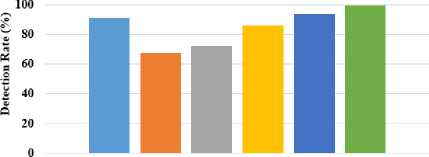
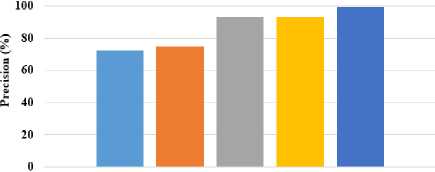
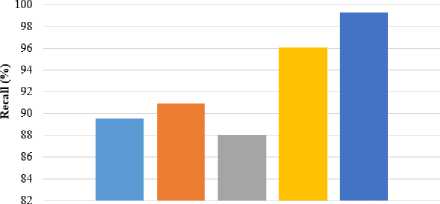
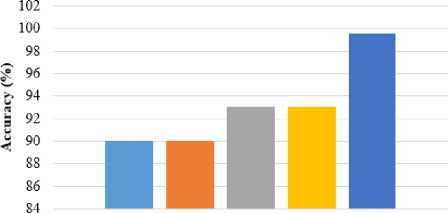
s (k-i) = [r Where, Z—1 = X MX. The orthogonal basis vectors [V ,..., V ] can be computed as follows: (i) Compute V as the eigenvector of Z-1= XdLXdT associated with the smallest Eigen values. (ii) Compute V as the eigenvector associated with the smallest Eigen values of J k and mathematically shown in equation (9). Jk = {I - Z-1 r(k-) [S(k-1) ]-1 [r*-1) ]T } Z-1 XdLmXT.(9) • OLPP Embedding Let Eolpp = [V1,...,Vz]embedding is shown in equation (10) and (11). Xd ^ Y = WTXd .(10) E = EpcaEolpp .(11) Where; E is indicated as transformation matrix Y is referred to as One-dimensional representation ofXd This transformation matrix reduces the dimensionality of the feature vectors of the pedestrian’s data. After this process, the relevant features are forwarded to the input of classification step. The SVM classifier is utilized for classifying the data as pedestrians or non-pedestrians. E. Pedestrian’s data Classification After obtaining the optimal feature information, the classification is performed on the extracted data. Classification is defined as the boundary between the classes in order to label the classes based on their measured features. a. Support Vector Machine After performing feature extraction, classification is carried out using SVM, which enables an efficient way of extracting the features and a set of rules to perform classification. SVM is a discriminative classification approach represent by a separate hyperplane. SVM trains the classifier utilizing training data and generates an optimal model. The SVM classifier broadly used in several applications like bioinformatics, signal processing, computer vision fields, etc., due to its high performance in accuracy, ability of processing the high dimensional data problems such as, gene expression and modelling of diverse data source. SVM is a kind of classifier; it does well in solving two-class problem, which is associated with the theories of Vapnik-Chervonenkis (VC) and structure principles. The linear discriminant function is represented as w.x + b = 0 . An optimum hyperplane is needed for separating the samples without noise and also shows the gap between two groups. It is satisfied by implementing the Equation (12), pi[w.x+ b]-1 > 0,i = 1,2,...N. (12) In the above formula, minimize the w2 value, so the saddle point of a Lagrange function with Lagrange multipliers solves this optimization issue. Ideal discriminant function is mathematically specified in equation (13), f(x) = sgn{(w*x) + b*} = sgn{^Na*.pi(x*) + b*}. (13) Then, the interior product is replaced by a kernel function k(x, x') in formula (14), to solve large computational complexity in the high dimensions. The linear separability is improved in input samples and the discriminant function is re-written in the equation (14), f (x)= sgn {^N a*=1.pi.k(x* .x) + b*}. (14) Generally, three various kinds of kernel functions are used such as linear, polynomial and sigmoid kernel in nature. The linear SVM classifier removes the irrelevant features recursively and estimates the pedestrian data. Moreover, SVM classifier able to handle the large dimensional data and more features in training set. In addition, linear SVM classifier predict the pedestrian and non-pedestrian data very fast. V. Experimental Result and Discussion For experimental simulation, PyCharm software was used on PC with 3.2 GHz Intel i5 processor. The experimental outcomes of the proposed method were compared to the traditional methods such as HOG, HOG+SVM, etc. in terms of accuracy, precision, recall and F-measure. A. Performance measure Performance measure is defined as the relationship between the input and output variables of a system understand by employing the suitable performance metrics like precision and recall. The general formula to calculate precision and recall of the pedestrian data is given in the equation (15) and (16). Pr ecision =--------. (15) TP + FP Re call = TP TP + FN' Accuracy is the measure of statistical variability and a description of random errors. The general formula of calculating pedestrian data accuracy performance is given in the equation (17). TP + TN Accuracy =-----------------x 100 (17) TP + TN + FP + FN Where, TP is represented as true positive, FP is denoted as false positive, TN is represented as true negative and FN is stated as a false negative. F-measure is the measure of accuracy test and it considers both precision P and recall R of the test in order to calculate the score. The general formula for F-measure is given in the equation (18). Precision. Recall F - measure = 2.-----------------x 100. (18) Pr ecision + Re call In this section, complexity of the existing and proposed algorithm is depicted in table 1. Big O notation is written in the form of O(n) where O stands for “order of magnitude” and n represents the number of pedestrian images and comparing the complexity of pedestrian classification task. A pedestrian prediction task is performed by HOG+OLPP+SVM algorithm, each of varying complexity and scalability over time. Table 1. Performance of computational complexity Methodology Computational Complexity MB+LBP O(n2) HOG+SVM O(n2) HOG+OLPP+SVM O(n2) The MB+LBP method shows more complexity than the HOG+SVM method and HOG+OLPP+SVM method. Time complexity at an exponential rate means that with each step the function performs, it’s subsequent step will take longer by an order of magnitude equivalent to a factor of N . The proposed HOG+OLPP+SVM method shows the manageable complexity over running time. B. Experimental analysis on Penn-Fudan Database Experimental analysis was carried on the Penn-Fudan Dataset consisting of 170 images with 345-labeled pedestrians. The images are taken from the urban street and labeled pedestrians data is 390 x 180 pixels. In experimental analysis, approximately 100 pedestrian image were taken for classification. The proposed HOG+OLPP+SVM model performance was calculated Accuracy and F-Measure. using evaluation metrics such as TP, FP, Precision, Recall, Table 2. The performance of the proposed method using pedestrian data Number of images Parameters TP FP Precision Recall Accuracy F-Measure Execution Time (sec) 10 9 1 90 91.3 90 90.6 16 20 19 1 95 93.6 92.6 94.2 30 30 28 2 93.3 95.2 94.3 94.2 46 40 38 2 95 97.3 94.7 96.0 63 50 49 1 98 98 96.2 98 80 60 58 2 96.6 96.3 97.8 96.4 97 70 69 1 98.5 98.7 98.2 98.5 115 80 77 3 96.2 97.3 98.6 96.7 119 90 89 1 98.8 98.4 99.3 98.5 137 100 100 0 100 100 99.6 100 154 The table 2 represents the performance of proposed method using pedestrian data. An approximately 100 images are taken from the Penn-Fudan Dataset and images are 390 x 180 pixels. The performance of proposed HOG+OLPP+SVM model, the precision recall, accuracy and f-measure achieves the approximately 100%, 100%, 99.6% and 100 respectively. The proposed model shows better accuracy in pedestrian data classification due to OLPP method is used for feature dimension reduction. So, it’s decreases the dimension of the features, computation time, and eliminate the redundant features. So, SVM classifier quickly classify the pedestrian and non- pedestrian data. The proposed HOG+OLPP+SVM method achieved minimum execution time with respect to different number of images. The graphical representation is shown in the Fig.2. Precision ■Recall ■ Accuracy I F-Measure Fig.2. Performance Analysis Table 3. The performance comparison of pedestrian data detection accuracy Approaches Accurate Detection Rate (ADR) (%) CNN [25] 91.4 HOG [25] 67.76 Adaboost [25] 72.23 R-FCN [25] 86.31 DCT based HCD [26] 94.2 HOG+OLPP+SVM 99.57 The table 3 represents the different pedestrian data detection and classification performance using Penn-Fudan Database. The CNN method achieves 91.4% of ADR and HOG achieves 67.76 % ADR. The Adaboost, R-FCN, DCT based HCD achieves 72.23%, 86.31%, 94.2% of ADR. The proposed HOG+OLPP+SVM method achieves 99.57% of ADR. So, compare to the existing methods the proposed approach is shows the better results. The graphical representation of ADR is shown in Fig.3. Accurate Detection Rate (ADR) (%) Different Methods ■ CNN [25] ■ HOG [25] Adaboost [25] R-FCN [25] ■ DCT based HCD [26] □ HOG+OLPP+SVM Fig.3. Accurate Detection Rate Different Methods ■ AFSE eBSM LAT nMB-LBP iHoG+SVM ■ HOG+OLPP+SVM Fig.4. Precision Different Methods ■ AFSE eBSM-LAT иМВ-LBP mHoG+SVM ■HOG+OLPP+SVM Fig.5. Recall The Fig.4 depicts the precision performance of the different pedestrian data detection methods and these methods are uses different databases. The Adaptive Fuzzy Set Enhancement (ASFS) method taken data from OTCBVS Benchmark and achieves 72.64% of precision. The Background Subtraction Model and Local Adaptive Thresholding (BSM-LAT) taken data from OSU thermal pedestrian Database and achieves 74.81% of precision. The Multi-block LBP (MB-LBP) method uses INRIA database and achieves 93.05%. The HOG+SVM method uses OSU thermal database and achieves 92.98% of precision. The Proposed HOG+OLPP+SVM method taken inputs from Penn-Fudan Database and 99.35% of precision. Different Methods ■ AFSE eBSM-LAT иМВ-LBP eHoG+SVM ■ HOG+OLPP+SVM Fig.6. Accuracy The Fig.5 and Fig.6 clearly observed that the recall and accuracy performance of the pedestrian’s data. An existing pedestrian data detection and classification methods of AFSE, BSM-LAT, MB-LBP, and HoG+SVM are achieves 89.55%, 90.93%, 88.02% and 96.11% of recall. The accuracy performance of existing methods of AFSE, BSM-LAT, MB-LBP, and HoG+SVM achieves 90%, 90%, 93.07%, and 93.09%. The proposed HOG+OLPP+SVM method achieves 99.57% of accuracy. So, compare to the existing methods the proposed method achieves better results. Table 4. Comparison study of existing and proposed method performance using pedestrian data Methodologies Database Parameters Precision (%) Recall (%) Accuracy (%) AFSE [27] OTCBVS Benchmark Data Collection 72.64 89.55 90 BSM-LAT [28] OSU thermal pedestrian Database 74.81 90.93 90 MB-LBP [29] INRIA database 93.05 88.02 93.07 HoG+SVM [30] OSU thermal database 92.98 96.11 93.09 HOG+OLPP+SVM Penn-Fudan Database 99.35 99.27 99.57 The table 4 shows the performance comparison of the proposed and existing methods with different pedestrian database. According to the experimental results, it is clearly observed that the HOG+OLPP+SVM method shows better results and effectively classifies the pedestrian data and non-pedestrian data. Also, compare to other pedestrian databases the Penn-Fudan Database shows better results. VI. Conclusion In this paper, Pedestrian data detection and classification are performed efficiently with the help of dimensionality reduction technique. The proposed HOG+OLPP+SVM model reduced the feature dimensionality and classified the pedestrian data efficiently. It reduced the computation time, storage space and eliminated the redundant data. After that SVM classifier classify the pedestrian and non-pedestrian data. In experimental analysis, the proposed HOG+OLPP+SVM model performance is compared with the different existing technique such as AFSE, BSM-LAT, MB-LBP, and HoG+SVM. The HOG+OLPP+SVM model achieved 99.5% of accuracy in pedestrian data classification. Compared to the existing methods, the HOG+OLPP+SVM model achieved 6% of improvements in pedestrian data classification. In future, work can be extended to design an efficient feature extraction method and classifier for multiple object detection along with pedestrian classification.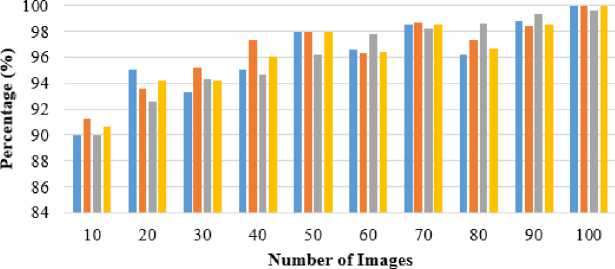
References Dimension reduction using orthogonal local preserving projection in big data
- K. Yang, E. J. Delp, and E. Du, “Categorization-based two-stage pedestrian detection system for naturalistic driving data,” Signal, Image and Video Processing, Vol. 8, No. 1, pp. 135-144, December 2014.
- C. G. Keller, and D. M. Gavrila, “Will the pedestrian cross? A study on pedestrian path prediction,” IEEE Transactions on Intelligent Transportation Systems, Vol. 15, No. 2, pp. 494-506, April 2014.
- R. Sun, G. Zhang, X. Yan, and J. Gao, “Robust Pedestrian Classification Based on Hierarchical Kernel Sparse Representation,” Sensors, Vol. 16, No. 8, pp. 1296, August 2016.
- M. Enzweiler, and D. M. Gavrila, “A multilevel mixture-of-experts framework for pedestrian classification,” IEEE Transactions on Image Processing, Vol. 20, No. 10, pp. 2967-2979, October 2011.
- C. B. Ng, Y. H. Tay, and B. M. Goi, “Pedestrian gender classification using combined global and local parts-based convolutional neural networks” Pattern Analysis and Applications, pp. 1-12, 2018.
- Y. Jiang, J. Wang, Y. Liang, and J. Xia, “Combining static and dynamic features for real-time moving pedestrian detection,” Multimedia Tools and Applications, pp.1-15, May 2018.
- R. M. Mueid, C. Ahmed, and M. A. R. Ahad, “Pedestrian activity classification using patterns of motion and histogram of oriented gradient,” Journal on Multimodal User Interfaces, Vol. 10, No. 4, pp. 299-305, July 2016.
- Y. Liu, L. Zeng, and Y. Huang, “An efficient HOG–ALBP feature for pedestrian detection,” Signal, Image and Video Processing, vol. 8, No. 1, pp.125-134, 2014.
- R. P. Yadav, V. Senthamilarasu, K. Kutty, and S. P. Ugale, “Implementation of robust HOG-SVM based pedestrian classification,” International Journal of Computer Applications, vol. 114, No. 19, January 2015.
- F. Meng, Z. Qi, Y. Tian, and L. Niu, “Pedestrian detection based on the privileged information,” Neural Computing and Applications, Vol. 29, pp. 1485-1494, June 2018.
- C. I. Orozco, M. E. Buemi, and J. J. Berlles, “New Deep Convolutional Neural Network Architecture for Pedestrian Detection,” In Proceeding of 8th International Conference of Pattern Recognition Systems (ICPRS 2017), pp. 1-6, July 2017.
- J. Li, X. Liang, S. Shen, T. Xu, J. Feng, and S. Yan, “Scale-aware fast R-CNN for pedestrian detection,” IEEE Transactions on Multimedia, Vol. 20, No. 4, pp. 985-996, April 2018.
- S. I. Jung, and K. S. Hong, “Deep network aided by guiding network for pedestrian detection,” Pattern Recognition Letters, Vol. 90, pp.43-49, April 2017.
- J. F. Kooij, G. Englebienne, and D. M. Gavrila, “Mixture of switching linear dynamics to discover behavior patterns in object tracks,” IEEE transactions on pattern analysis and machine intelligence, Vol. 38, No. 2, pp. 322-334, February 2016.
- X. Li, L. Li, F. Flohr, J. Wang, H. Xiong, M. Bernhard, S. Pan, D. M. Gavrila, and K. Li, “A unified framework for concurrent pedestrian and cyclist detection,” IEEE T INTELL TRANSP. vol. 18, pp. 269-281, February 2017.
- B. Chen, H. Sun, L. Feng, G. Xia, and G. Zhang, “Robust image compressive sensing based on m-estimator and nonlocal low-rank regularization,” Neurocomputing, Vol. 275, pp. 586-597, January 2018.
- A. Maronidis, E. Chatzilari, S. Nikolopoulos, and I. Kompatsiaris, “Scalable image annotation using a product compressive sampling approach”, In proceedings of IEEE International Conference on Data Science and Advanced Analytics (DSAA), pp. 1-10, October 2015.
- S. Zhu, B. Zeng, and M. Gabbouj, “Adaptive sampling for compressed sensing based image compression,” Journal of Visual Communication and Image Representation, Vol. 30, pp. 94-105, 2015.
- Y. K. Lee, E. R. Lee, and B. U. Park, “Principal component analysis in very high-dimensional spaces,” Statistica Sinica, pp. 933-956, 2012.
- H. Tian, Z. Duan, A. Abraham, and H. Liu, “A novel multiplex cascade classifier for pedestrian detection,” Pattern Recognition Letters, Vol. 34, No. 14, pp.1687-1693, October 2013.
- L. Kuang, L. T. Yang, J. Chen, F. Hao, and C. Luo, “A Holistic Approach for Distributed Dimensionality Reduction of Big Data,” IEEE Transactions on Cloud Computing, Vol. 2, pp. 506-518, 2018.
- M. Nasir, C. P. Lim, S. Nahavandi, and D. Creighton, “A genetic fuzzy system to model pedestrian walking path in a built environment,” Simulation Modelling Practice and Theory, Vol. 45, pp. 18-34, 2014.
- S. K. Choudhury, P. K. Sa, R. P. Padhy, S. Sharma, and S. Bakshi, “Improved pedestrian detection using motion segmentation and silhouette orientation,” Multimedia Tools and Applications, pp.1-40. 2017.
- L. Sun, X. Liang, and Q. Zhao, “Recursive Templates Segmentation and Exemplars Matching for Human Parsing,” The Computer Journal, vol. 57, No.3, pp. 364-377, 2014.
- R. Soundrapandiyan, and P. C. Mouli, “An Approach to Adaptive Pedestrian Detection and Classification in Infrared Images Based on Human Visual Mechanism and Support Vector Machine,” Arabian Journal for Science and Engineering, pp. 1-13, 2017.
- V. Gajjar, Y. Khandhediya, A. Gurnani, V. Mavani, M. S. Raval, M. Nakada, H. Chen, D. Terzopoulos, H. Hosseini, B. Xiao, and M. Jaiswal, “ViS-HuD: Using Visual Saliency to Improve Human Detection with Convolutional Neural Networks,” In Proceedings of the IEEE Conference on Computer Vision and Pattern Recognition Workshops, pp. 1908-1916, 2018.
- G. Khandelwal, V. Anandi, M. V. Deepak, V. N. Prasad, K. Manikantan, and F. Francis, “Pedestrian detection using single box convergence with iterative DCT based haar cascade detector and skin color segmentation,” In proceedings of IEEE International Conference on Research in Computational Intelligence and Communication Networks (ICRCICN), pp. 32-37, November 2015.
- R. Soundrapandiyan, and P. C. Mouli, “Adaptive pedestrian detection in infrared images using background subtraction and local thresholding,” Procedia Computer Science, vol. 58, pp.706-713, 2015.
- A. Halidou, X. You, M. Hamidine, R. A. Etoundi, and L. H. Diakite, “Fast pedestrian detection based on region of interest and multi-block local binary pattern descriptors,” Computers & Electrical Engineering, Vol. 40, No. 8, pp. 375-389, 2014.
- J. K. Kang, H. G. Hong, and K. R. Park, “Pedestrian detection based on adaptive selection of visible light or far-infrared light camera image by fuzzy inference system and convolutional neural network-based verification,” Sensors, vol. 17, No. 7, pp. 1598, 2017.
