Dimensionality reduction for classification and clustering

Author: D. Asir Antony Gnana Singh, E. Jebamalar Leavline
Journal: International Journal of Intelligent Systems and Applications @ijisa
Article in issue: 4 vol.11, 2019.
Free access
Now-a-days, data are generated massively from various sectors such as medical, educational, commercial, etc. Processing these data is a challenging task since the massive data take more time to process and make decision. Therefore, reducing the size of data for processing is a pressing need. The size of the data can be reduced using dimensionality reduction methods. The dimensionality reduction is known as feature selection or variable selection. The dimensionality reduction reduces the number of features present in the dataset by removing the irrelevant and redundant variables to improve the accuracy of the classification and clustering tasks. The classification and clustering techniques play a significant role in decision making. Improving accuracy of classification and clustering is an essential task of the researchers to improve the quality of decision making. Therefore, this paper presents a dimensionality reduction method with wrapper approach to improve the accuracy of classification and clustering.
Wrapper-based dimensionality reduction, naïve Bayes classifier, Random forest classifier, OneR classifier, Variable selection
Short address: https://sciup.org/15016588
IDR: 15016588 | DOI: 10.5815/ijisa.2019.04.06
Text of the scientific article Dimensionality reduction for classification and clustering
Published Online April 2019 in MECS
Thanks to the advancements in information and communication technology, data are generated massively from different sectors such as medical, education, commercial, etc. These data are processed for making decision. The classification and clustering tasks are carried out to make data-driven decisions. These decisions are used to improve the quality of service or production process in various sectors. In general, the clustering and classification algorithms build the predictive model based on the data. Then, these predictive models are used to predict the unknown data from the known data. If the size of the data is large, the classification and clustering algorithm take more time to build the predictive model. Moreover, the large size of the data reduces the accuracy of the predictive model. Hence, the size of the data can be reduced using dimensionality reduction method. This method is also known as feature selection or variable selection.
Variable selection is classified into three types namely wrapper, filter and embedded methods. The wrapperbased variable selection method generates the possible variable subsets from a dataset and each subset is evaluated using any one of the classification algorithm. Based on the merit of the evolution a particular variable subset is selected as significant variable subset for classification or clustering task. The wrapper-based variable selection produces higher accuracy for classification tasks. It does not possess high generality since it produces higher accuracy only for the classification algorithm that is used for the variable subset evaluation. Computational complexity is more since it uses the classification algorithm for the evaluation of the variable subsets. The filter-based variable subset selection selects the significant variable subsets from the dataset using any one of the statistical measures. The computational complexity is less since it does not use any classification algorithm to evaluate the variable subsets. It possesses high generality since it does not use classification algorithm for the variable selection process. In the embedded-based variable selection method a part of the classification algorithm is used to evaluate the significance of the variables. It does not possess high generality since it uses classification algorithm and also it produces higher accuracy only for the classification algorithm which was used for variable selection process. The computation complexity of embedded-based method is lesser than the wrapper-based method and it is higher than the filter-based method.
In general, the accuracy in prediction determines the quality of the data-driven decision making. Therefore, improving the accuracy of the classification and clustering algorithm is the prime task of the researchers to carry out accurate prediction in data-driven decision making. Hence, this paper presents a wrapper-based variable selection method to improve the accuracy of classification and clustering algorithms.
The rest of this paper is organized as follows: Section II presents the related work. Section III presents wrapper- based variable section. Section IV discusses the experimental setup and experimental procedure. Section V discusses the results. Section VI concludes the paper.
-
II. Related Works
This section presents the review on the research works that are carried out by various researches related to the proposed research work. The classification task is carried out for recognition, prediction, and identification of the objects or data. The clustering tasks can be used to identify or predict the group label of the objects. The classification and clustering tasks are carried out in several domains for vide range of applications. For example, in medical, the classification task is used to diagnose the disease of the patient. In commercial applications, the classification task is performed to predict the buying behavior of the customers, genuine of the currency notes, etc. The clustering task is carried out in many sectors. For example, the clustering tasks are carried out for outlier detection in social networks to detect the intruders or unethical behavior groups. In a manufacturing unit, the outlier detection is used for identifying the defective components, etc. Therefore, there is a pressing need to improve the accuracy of clustering and classification. Improving the accuracy in classification and clustering can be achieved by dimensionality reduction methods. Hence, many researchers are involved in developing suitable dimensionality reduction methods to improve the accuracy in the classification and clustering algorithms.
In the recent past, face recognition is widely used for authentication and to provide security. Therefore, many researchers carry out the dimensionality reduction for face recognition application. Lina Liu et al presented a dimensionality reduction with locality constrained dictionary learning approach for data classification. This method is used for gender classification, face identification, and object recognition [1]. Sen Yuan et al. proposed a method known as multi-linear spatial discriminant analysis (MSDA) for dimensionality reduction. Using this method, the classification accuracy for face recognition is improved [2]. Moreover, Qiang Yu presented Euler- locality preserving projection (LPP) approach for dimensionality reduction and the experiment is conducted on the face dataset [4]. Furthermore, Min Jiang presented a dimensionality reduction approach to improve accuracy in classification. The face dataset is used to conduct the experiment [7].
Some of the researchers try to improve the classification accuracy in hyper-spectral data. Xuesong Wang et al. presented a dimensionality reduction method based on nonnegative sparse divergence and pairwise constraint discriminative analysis for improving accuracy in hyperspectral data classification [3] and Yanni Dong developed a dimensionality reduction method for improving accuracy for hyper-spectral image classification. In this method, locally adaptive dimensionality reduction metric is used for dimensionality reduction [6].
The classification algorithm is also used for detection of software fault and software vulnerability. Jeffrey Stuckman et al. investigated the effect of dimensionality reduction in predicting the software vulnerability [5]. Furthermore, some of the researchers concentrated on improving the accuracy in recognition and clustering tasks using dimensionality reduction. Changqing Zhang presented an unsupervised dimensionality reduction for improving accuracy in recognition and clustering tasks [8]. Dominik Sacha presented a dimensionality reduction approach [9]. Junli Liang presented a dimensionality reduction approach for tensor data recognition [10]. Moreover, D. Singh et al. developed a dimensionality reduction method for medical diagnosis [11].
-
H. B. Kekre et al described a dimensionality reduction method for content-based image retrieval (CBIR). However, the histogram-based feature extraction framework is used for variable reduction. In order to evaluate the presented work, the performance evaluation metrics such as precision, recall and length of string to retrieve all relevant images are used [12].
Ah. E. Hegazy et al proposed a dimensionality reduction approach using an improved whale optimization for data classification. The performance of this proposed method is compared with the different optimization techniques such as standard whale optimization, antlion optimization, genetic algorithm and particle swarm optimization [13].
Micheal O. Arowolo et al explored a hybrid dimensionality reduction approach to classify the microarray data. Moreover, the performance evaluation metrics such as time taken for training, accuracy, sensitivity, specificity, precision, area under curve and error are used to justify the performance of the proposed system [14].
Shilpa Sharma et al presented a dimensionality approach using the principle component analysis for recognize the hand sign [15]. Amir Enshaei et al presented a dimensionality reduction using the targeted projection pursuit technique [16].
Masoumeh Zareapoor et al used the dimensionality reduction method to classify the text documents [17]. Asir et al presented a feature ranking method for reducing the dimensionality to improve the accuracy of the classification algorithms [18]. Asir et al proposed a dimensionality reduction method using the rough set theory in order to improve the classification accuracy [19].
From the literature, it is observed that the dimensionality reduction removes the irrelevant and redundant variables from the training data so that the significant variables are obtained to develop the highly accurate classification or clustering models. Moreover, the dimensionality reduction is a tool to improve the accuracy of classification and clustering tasks. Therefore, this paper presents a wrapper-based dimensionality reduction approach to improve the accuracy of classification and clustering tasks.
-
III. Wrapper-Based Dimensionality Reduction
This section presents a wrapper-based dimensionality reduction approach. In the wrapper-based approach the classification algorithm is used to select the significant variable subset from the dataset. The algorithm of the wrapper-based approach is presented in Algorithm 1.
Algorithm 1: Wrapper-based dimensionality reduction
Input: Dataset with all variables D = {V 1 , V 2 , V 3, _,V N } Output: Selected set of variables D ss = {V 1 , V 2 , V 3,...,Vn }
Where, D, V and D represent the dataset, variables and selected variable subset respectively. N represents total number of variable in D. n represents total number of variables selected from D.
Step 1: Begin
Step 2: Read the dataset D
Step 3: Perform searching to form the variable subset
Step 4: Evaluate variable subset using classification algorithm
Step 5: If the selected subset does not meet the criterion go to Step 4 otherwise go to Step 6
Step 6: Select the best variable subset
Step 7: End
-
IV. Experimental Setup and Experimental Procedure
The experiment is conducted using the Weka software [20] with the computer system configuration of Windows 7 Professional 64-bit Operating system, Intel(R) Core(TM) 2 CPU T5300 @ 1.73 GHz Processor, 4.00 GB RAM and 300 GB Hard disk. The experiment is conducted with 10 well-known publically available dataset from various domains, collected from the Weka dataset repository. The details of datasets are presented in Table 1.
-
A. Experiment1: Dimensionality Reduction for Classification Algorithm
The Fig. 2 shows the experimental procedure for the dimensionality reduction for classification algorithm. Initially, the dataset is given to the dimensionality reduction algorithms namely correlation-based feature selection (CFS) and the wrapper-based method namely wrapper-based feature selection with naïve Bayes classifier (W-NB), wrapper-based feature selection with OneR classifier (W-OR), wrapper-based feature selection with random forest classifier (W-RF). Then, the variables of the dataset are reduced.
Dataset with full variables
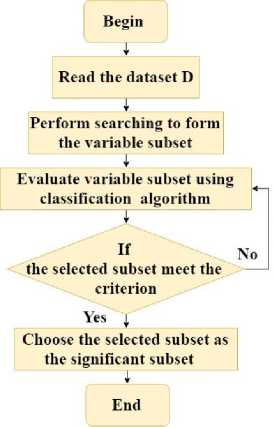
Fig.1. Flowchart representation of Wrapper-based dimensionality reduction

Dimensionality reduction algorithm

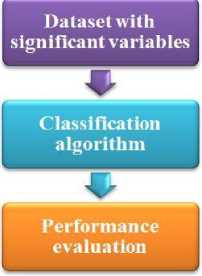
Fig.2. Flowchart representation of Experiment1: Dimensionality Reduction for Classification Algorithm
Algorithm 1 and Fig. 1 presents the wrapper-based dimensionality reduction. This algorithm receives the dataset with all variables D= {V 1 , V 2 , V 3 ,_,V N } and produces the selected set of variables D ss = {V 1 , V 2 , V 3 ,...,V n } is received as the output. Initially, the dataset is read and searching is performed on the dataset to generate the variable subsets. Then the variable subsets are evaluated using the classification algorithm. If the evaluated variable subset meets the criterion then that variable subset is selected as the significant variable subset.
Then the reduced variable dataset is given to the respective classification algorithms. In this paper, three classification algorithms are used to validate the dimensionality reduction methods namely naïve Bayes classifier (NB), OneR classifier (OR), and random forest classifier (RF). Moreover, the correlation-based feature selection (CFS) and the classifiers that are used in this paper are described as follows:
Correlation-based feature selection (CFS): This approach initially generates the number of possible variable subsets from the given dataset. Then, each subset is evaluated using the correlation measures with the statement of “The variables of a best variable subset have high correlation with the class attribute and have low correlation among the variables that are present in the variable subset” [21].
Naïve bayes classifier (NB): The NB classifier fundamentally belongs to the category of probabilisticbased classification approach. The naïve Bayes probabilistic method is used in classification algorithm to develop the classification model. In this classification approach, it is assumed that the values of the different variables that are present in the dataset are independent. This classification approach is used for various real-world applications in order to solve the classification problems. Moreover, the NB classifier estimates the parameters that are used to classify the unknown class label of the given instance by even small number of training data [22].
OneR classifier (OR): The OR classification algorithm is known as “one rule” classification algorithm. This algorithm generates one rule for each variable that are present in the dataset and selects the rule which one is minimum error among the other rules to perform the classification task [23].
Random forest classifier (RF): The random forest algorithm uses the decision trees to construct the classification model. The forest is refereed as a set of decision trees used for improving the predictive accuracy [24].
-
B. Experiment 2: Dimensionality Reduction for Clustering Algorithm
The Fig. 3 shows the experimental procedure for the dimensionality reduction for clustering algorithm. Initially, the dataset is given to the dimensional reduction algorithms namely wrapper-based feature selection with naïve Bayes classifier (W-NB). Then, the variables of the dataset are reduced. Then the reduced variable dataset is given into the k-means clustering algorithm with different number of clusters.
Table 1. Details of the dataset
|
Dataset |
Variables |
Instances |
Classes |
|
Breast-Cancer |
9 |
289 |
2 |
|
Contact-Lenses |
4 |
24 |
3 |
|
Credit-G |
20 |
1000 |
2 |
|
Diabetes |
8 |
768 |
2 |
|
Glass |
9 |
214 |
7 |
|
Ionosphere |
34 |
351 |
2 |
|
Labor |
16 |
57 |
2 |
|
Segment |
19 |
1500 |
7 |
|
Soybean |
35 |
683 |
19 |
|
Vote |
16 |
435 |
2 |
|
Average |
17 |
7.4 |
5.9 |
Dataset with full variables
Dimensionality reduction algorithm

Dataset with significant variables
Clustering algorithm
Performance evaluation
Fig.3. Flowchart representation of Experiment1: Dimensionality Reduction for Classification Algorithm
K-means clustering: This clustering algorithm randomly chooses the k numbers of data points from the dataset to form the k number of clusters. Initially, the chosen k data points are considered as the cluster center and the distance between the cluster center and other data points are calculated in an iterative manner. Then, the cluster center is changed iteratively for forming the perfect clusters [25] [26].
-
V. Results and Discussion
This section presents the experimental results. Table 2 and Figure 4 show the total number of variable (WO) of the dataset and the number of variables in the reduced dataset by the dimensionality reduction methods. Table 3 and Figure 5 show the classification accuracy of naïve Bayes (NB) classifier with total number of attributes and different dimensionality reduction techniques. Table 4 and Figure 6 show the classification accuracy of OneR classifier (OR) with total number of attributes and different dimensionality reduction techniques. Table 5 and Figure 7 show classification accuracy of random forest classifier (RF) with total number of attributes and different dimensionality reduction techniques. Table 6 shows the sum of squared errors of clustering with different number of clusters respect to total number of attributes and different dimensionality reduction techniques for various dataset. Figure 8 shows sum of squared errors of clustering with different number of clusters respect to total number of attributes and different dimensionality reduction techniques for the dataset Breast Cancer. Figure 9 shows sum of squared errors of clustering with different number of clusters respect to total number of attributes and different dimensionality reduction techniques for the dataset Glass. Figure 10 shows sum of squared errors of clustering with different number of clusters respect to total number of attributes and different dimensionality reduction techniques for the dataset Ionosphere.
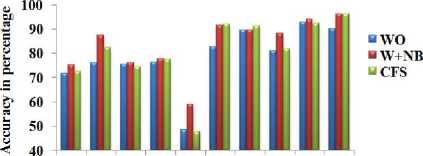
Table 2. Number of variable with respect to the wrapper methods
|
Dataset |
WO |
CFS |
W+NB |
W+OR |
W+RF |
|
Breast-Cancer |
9 |
5 |
2 |
1 |
2 |
|
ContactLenses |
4 |
1 |
2 |
1 |
2 |
|
Credit-G |
20 |
3 |
12 |
1 |
3 |
|
Diabetes |
8 |
4 |
5 |
1 |
7 |
|
Glass |
9 |
8 |
2 |
1 |
5 |
|
Ionosphere |
34 |
14 |
5 |
1 |
15 |
|
Labor |
16 |
7 |
5 |
1 |
16 |
|
Segment |
19 |
6 |
6 |
1 |
7 |
|
Soybean |
35 |
22 |
17 |
1 |
15 |
|
Vote |
16 |
4 |
3 |
1 |
7 |
|
Average |
17 |
7.4 |
5.9 |
1 |
7.9 |
Fig.4. Number of variable with respect to the wrapper methods
Table 3. Classification accuracy of naïve Bayes (NB) classifier with total number of attributes and different dimensionality reduction techniques
|
Dataset |
WO |
W+NB |
CFS |
|
Breast-Cancer |
71.67 |
75.17 |
72.37 |
|
Contact-Lenses |
76.15 |
87.50 |
82.49 |
|
Credit-G |
75.40 |
76.10 |
74.40 |
|
Diabetes |
76.30 |
77.73 |
77.47 |
|
Glass |
48.59 |
58.87 |
47.66 |
|
Ionosphere |
82.62 |
91.45 |
92.02 |
|
Labor |
89.47 |
89.47 |
91.22 |
|
Segment |
81.06 |
88.06 |
81.73 |
|
Soybean |
92.97 |
93.85 |
92.24 |
|
Vote |
90.11 |
96.32 |
96.09 |
|
Average |
78.43 |
83.45 |
80.76 |
From Table 2 and Fig. 4, it is observed that W+OR significantly reduces the number of variable from the datasets and W+NB reduces more number of variables from the dataset than the CFS and W+RF. From Table 3 and Fig. 5, it is observed that W+NB produces better accuracy compared to other dimensionality reduction methods in terms of average accuracy.

Fig.5. Classification accuracy of naïve Bayes classifier (NB) with total number of attributes and different dimensionality reduction techniques
Table 4. Classification accuracy of OneR classifier (OR) with total number of attributes and different dimensionality reduction techniques
|
Dataset |
WO |
W+OR |
CRF |
|
Breast-Cancer |
65.73 |
72.37 |
65.73 |
|
Contact-Lenses |
70.83 |
70.83 |
70.83 |
|
Credit-G |
66.10 |
71.70 |
71.1 |
|
Diabetes |
71.48 |
71.48 |
71.48 |
|
Glass |
57.94 |
57.94 |
57.94 |
|
Ionosphere |
80.91 |
82.62 |
80.91 |
|
Labor |
71.92 |
77.19 |
77.19 |
|
Segment |
64.26 |
65.00 |
64.26 |
|
Soybean |
39.97 |
39.97 |
36.60 |
|
Vote |
95.63 |
95.63 |
95.63 |
|
Average |
68.47 |
70.47 |
69.16 |
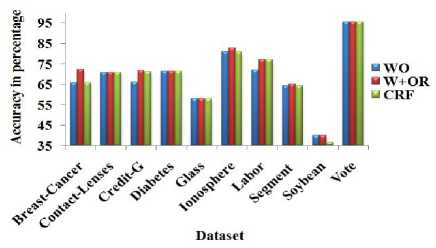
Fig.6. Classification accuracy of OneR classifier (OR) with total number of attributes and different dimensionality reduction techniques
Table 5. Classification accuracy of random forest classifier (RF) with total number of attributes and different dimensionality reduction techniques
|
Dataset |
WO |
W+RF |
CFS |
|
Breast-Cancer |
69.58 |
75.17 |
70.62 |
|
Contact-Lenses |
70.83 |
83.33 |
62.50 |
|
Credit-G |
76.40 |
73.90 |
70.20 |
|
Diabetes |
75.78 |
76.17 |
74.73 |
|
Glass |
79.90 |
78.50 |
79.90 |
|
Ionosphere |
92.87 |
95.15 |
94.87 |
|
Labor |
89.47 |
85.96 |
87.71 |
|
Segment |
97.86 |
98.00 |
98.13 |
|
Soybean |
92.97 |
93.26 |
94.28 |
|
Vote |
96.09 |
95.86 |
96.09 |
|
Average |
84.17 |
85.53 |
82.90 |
Table 6. Sum of squared errors of clustering with different number of clusters respect to total number of attributes and different dimensionality reduction techniques for various dataset
|
Dataset |
Number of clusters |
|||||||||
|
2 |
3 |
4 |
5 |
6 |
7 |
8 |
9 |
10 |
||
|
BreastCancer |
WO |
1177.00 |
977.00 |
932.00 |
888.00 |
847.00 |
826.00 |
798.00 |
800.00 |
766.00 |
|
W+NB |
0191.00 |
120.00 |
100.00 |
067.00 |
045.00 |
033.00 |
025.00 |
018.00 |
000.00 |
|
|
CFS |
0553.00 |
479.00 |
444.00 |
443.00 |
430.00 |
422.00 |
386.00 |
365.00 |
351.00 |
|
|
Glass |
WO |
0118.20 |
077.12 |
075.33 |
066.13 |
052.18 |
049.94 |
048.47 |
048.04 |
038.47 |
|
W+NB |
0075.51 |
044.99 |
043.98 |
042.33 |
029.52 |
041.20 |
028.95 |
012.27 |
028.46 |
|
|
CFS |
0118.97 |
073.14 |
070.58 |
061.39 |
048.43 |
046.19 |
045.15 |
035.49 |
035.35 |
|
|
Ionos phere |
WO |
0726.10 |
698.25 |
585.51 |
537.73 |
518.41 |
512.51 |
492.88 |
466.82 |
452.85 |
|
W+NB |
0210.64 |
201.97 |
082.00 |
076.90 |
075.67 |
075.05 |
074.63 |
063.33 |
054.16 |
|
|
CFS |
0302.91 |
263.11 |
254.00 |
242.02 |
235.37 |
227.92 |
207.80 |
214.86 |
196.37 |
|
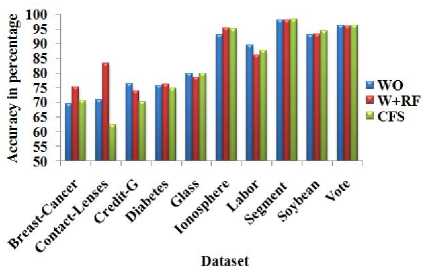
Fig.7. Classification accuracy of random forest classifier (RF) with total number of attributes and different dimensionality reduction techniques
The full set of variables (WO) produce the accuracy equal to the W+NB for the Labor dataset. However, the W+NB reduces the 25% of the features from WOW+NB produces better accuracy with NB for more number of datasets than CFS. From Table 4 Fig. 6, it is observed that W+OR produces better accuracy compared to other dimensionality reduction methods in terms of average accuracy. W+OR produces better accuracy with NB for more number of datasets than CFS. Table 5 and Fig. 7 reveals that W+RF produces better accuracy compared to other dimensionality reduction methods in terms of average accuracy.
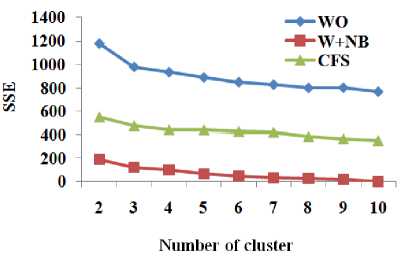
Fig.8. Sum of squared errors of clustering with different number of clusters respect to total number of attributes and different dimensionality reduction techniques for the dataset Breast-Cancer
Fig.10. Sum of squared errors of clustering with different number of clusters respect to total number of attributes and different dimensionality reduction techniques for the dataset Ionosphere
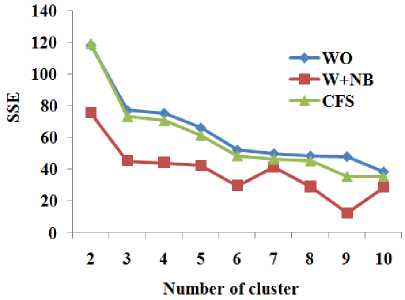
Fig.9. Sum of squared errors of clustering with different number of clusters respect to total number of attributes and different dimensionality reduction techniques for the dataset Glass
W+RF produces better accuracy with the RF for more number of datasets than CFS. From Table 6 and Fig. 8 to Fig. 10, it is obvious that W+NB reduces the sum of squared errors of clustering with different number of clusters compared to WO and CFS for the datasets Breast-Cancer, Glass and Ionosphere. Hence, the wrapper-based methods produce higher classification accuracy with the classification algorithms and reduce the sum of squared errors for the clustering algorithms.
-
VI. Conclusion
This paper presented the wrapper-based dimensionality reduction method for classification and clustering. The presented wrapper-based methods namely wrapper-based feature selection with naïve Bayes classifier (W-NB), wrapper-based feature selection with OneR classifier (W-OR), and wrapper-based feature selection with random forest classifier (W-RF) produce better accuracy for the classification algorithms. Moreover, the wrapper-based dimensionality reduction method W-NB reduces the sum of squared errors compared to other methods. For the extension of this work, different types of classification algorithms can be incorporated with the presented approach.
References Dimensionality reduction for classification and clustering
- L. Liu, S. Ma, L. Rui and J. Lu, "Locality constrained dictionary learning for non-linear dimensionality reduction and classification," in IET Computer Vision, vol. 11, no. 1, (2017), pp. 60-67.
- S. Yuan, X. Mao and L. Chen, "Multilinear Spatial Discriminant Analysis for Dimensionality Reduction," in IEEE Transactions on Image Processing, vol. 26, no. 6, (2017), pp. 2669-2681.
- X. Wang, Y. Kong, Y. Gao and Y. Cheng, "Dimensionality Reduction for Hyperspectral Data Based on Pairwise Constraint Discriminative Analysis and Nonnegative Sparse Divergence," in IEEE Journal of Selected Topics in Applied Earth Observations and Remote Sensing, vol. 10, no. 4, ( 2017) pp. 1552-1562.
- Q. Yu, R. Wang, B. N. Li, X. Yang and M. Yao, "Robust Locality Preserving Projections With Cosine-Based Dissimilarity for Linear Dimensionality Reduction," in IEEE Access, vol. 5, no.3, (2017), pp. 2676-2684.
- J. Stuckman, J. Walden and R. Scandariato, "The Effect of Dimensionality Reduction on Software Vulnerability Prediction Models," in IEEE Transactions on Reliability, vol. 66, no. 1, (2017), pp. 17-37.
- Y. Dong, B. Du, L. Zhang and L. Zhang, "Exploring Locally Adaptive Dimensionality Reduction for Hyperspectral Image Classification: A Maximum Margin Metric Learning Aspect," in IEEE Journal of Selected Topics in Applied Earth Observations and Remote Sensing, vol. 10, no. 3, (2017), pp. 1136-1150.
- M. Jiang, W. Huang, Z. Huang and G. G. Yen, "Integration of Global and Local Metrics for Domain Adaptation Learning Via Dimensionality Reduction," in IEEE Transactions on Cybernetics, vol. 47, no. 1, (2017) pp. 38-51.
- C. Zhang, H. Fu, Q. Hu, P. Zhu and X. Cao, "Flexible Multi-View Dimensionality Co-Reduction," in IEEE Transactions on Image Processing, vol. 26, no. 2, (2017), pp. 648-659.
- D. Sacha et al., "Visual Interaction with Dimensionality Reduction: A Structured Literature Analysis," in IEEE Transactions on Visualization and Computer Graphics, vol. 23, no. 1, (2017), pp. 241-250.
- J. Liang, G. Yu, B. Chen and M. Zhao, "Decentralized Dimensionality Reduction for Distributed Tensor Data Across Sensor Networks," in IEEE Transactions on Neural Networks and Learning Systems, vol. 27, no. 11, pp. 2174-2186, Nov. 2016.
- D. Asir Antony Gnana Singh, E. Jebamalar Leavline, R. Priyanka, P. Padma Priya, "Dimensionality Reduction using Genetic Algorithm for Improving Accuracy in Medical Diagnosis", International Journal of Intelligent Systems and Applications (IJISA), Vol.8, No.1, pp.67-73, 2016. DOI: 10.5815/ijisa.2016.01.08
- H. B. Kekre, Kavita Sonawane,"Histogram Bins Matching Approach for CBIR Based on Linear grouping for Dimensionality Reduction", IJIGSP, vol.6, no.1, pp. 68-82, 2014.DOI: 10.5815/ijigsp.2014.01.10
- Ah. E. Hegazy, M. A. Makhlouf, Gh. S. El-Tawel, " Dimensionality Reduction Using an Improved Whale Optimization Algorithm for Data Classification", International Journal of Modern Education and Computer Science(IJMECS), Vol.10, No.7, pp. 37-49, 2018.DOI: 10.5815/ijmecs.2018.07.04
- Micheal O. Arowolo, Sulaiman O. Abdulsalam, Rafiu M. Isiaka, Kazeem A. Gbolagade, "A Hybrid Dimensionality Reduction Model for Classification of Microarray Dataset", International Journal of Information Technology and Computer Science(IJITCS), Vol.9, No.11, pp.57-63, 2017. DOI: 10.5815/ijitcs.2017.11.06
- Shilpa Sharma, Rachna Manchanda,"Implementation of Hand Sign Recognition for NonLinear Dimensionality Reduction based on PCA", International Journal of Image, Graphics and Signal Processing(IJIGSP), Vol.9, No.2, pp.37-45, 2017.DOI: 10.5815/ijigsp.2017.02.05
- Amir Enshaei, Joe Faith,"Feature Selection with Targeted Projection Pursuit", International Journal of Information Technology and Computer Science (IJITCS), vol.7, no.5, pp.34-39, 2015. DOI: 10.5815/ijitcs.2015.05.05
- Masoumeh Zareapoor, Seeja K. R,"Feature Extraction or Feature Selection for Text Classification: A Case Study on Phishing Email Detection", IJIEEB, vol.7, no.2, pp.60-65, 2015. DOI:10.5815/ijieeb.2015.02.08
- Singh, D.A.A.G., Balamurugan, S.A.A. & Leavline, E.J. “An unsupervised feature selection algorithm with feature ranking for maximizing performance of the classifiers” Int. J. Autom. Comput. (2015) 12: 511. https://doi.org/10.1007/s11633-014-0859-5
- Singh, D. Asir Antony Gnana, E. Jebamalar Leavline, E. Priyanka, and C. Sumathi. "Feature selection using rough set for improving the performance of the supervised learner." International Journal of Advanced Science and Technology 87 (2016): 1-8.
- Eibe Frank, Mark A. Hall, and Ian H. Witten (2016). The WEKA Workbench. Online Appendix for "Data Mining: Practical Machine Learning Tools and Techniques", Morgan Kaufmann, Fourth Edition, 2016.
- Hall, M.A., 2000. Correlation-based feature selection of discrete and numeric class machine learning. Ph.D Thesis, Department of Computer Science, the University of Waikato.
- Singh, G., Antony, D.A. and Leavline, E.J., 2013. Data Mining In Network Security-Techniques & Tools: A Research Perspective. Journal of theoretical & applied information technology, 57(2).
- R.C. Holte (1993). Very simple classification rules perform well on most commonly used datasets. Machine Learning. 11:63-91.
- Pal, M., 2005. Random forest classifier for remote sensing classification. International Journal of Remote Sensing, 26(1), pp.217-222.
- D. Asir Antony Gnana Singh , A. Escalin Fernando , E. Jebamalar Leavline’ “Performance Analysis on Clustering Approaches for Gene Expression Data” International Journal of Advanced Research in Computer and Communication Engineering Vol. 5, Issue 2, February 2016.
- D. Asir Antony Gnana Singh, E. Jebalamar Leavline, “Model-Based Outlier Detection System with Statistical Preprocessing”, Journal of Modern Applied Statistical Methods, May 2016, Vol. 15, No. 1, 789-801.
