Doppler ultrasound based non-invasive heart rate telemonitoring system for wellbeing assessment

Author: Abdullah Bin Queyam, Sharvan Kumar Pahuja, Dilbag Singh
Journal: International Journal of Intelligent Systems and Applications @ijisa
Article in issue: 12 vol.10, 2018.
Free access
Telemonitoring in the field of healthcare has vastly improved the quality of clinical diagnosis and disease prevention by providing timely medical consultation to people living in rural and remote areas. To monitor the health state of a patient certain vital physiological parameter like electrocardiogram (ECG), respiration rate, blood pressure, oxygen saturation, etc. are acquired and analyzed. Listening to the heart sounds (auscultation) is also a quick method to monitor the health state of the patient’s heart. In this paper, we propose the use of a portable Doppler ultrasound sensor for measuring the heart sounds reliably and to transmit the data for further clinical telemonitoring. We have developed an ultrasound-based hardware prototype which is non-invasive in nature and easy to operate. Its portability, high accuracy, low cost, and wireless nature make this device suitable for home-based self-diagnostic applications. The developed prototype was successfully able to capture both fundamental heart sounds S1 and S2 reliably and transfer the signal wirelessly to the LabVIEW-based monitoring and data logging unit. This unit extracts clinically useful health information like heart rate (HR), R-R interval and heart rate variability (HRV) using signal processing algorithms. Health information is then transmitted via the Internet to a distant hospital for further improved clinical diagnosis and consultancy. The prototype was validated on 40 healthy males in the age group of 25-35 years, and the results show an overall accuracy of 96.74% in HR detection when compared with an ECG sensor, a photoplethysmograph (PPG) sensor, a pulse oximeter device and manual auscultation.
Heart sound, Doppler ultrasound, ECG, heart rate, heart rate variability, electronic stethoscope, LabVIEW
Short address: https://sciup.org/15016555
IDR: 15016555 | DOI: 10.5815/ijisa.2018.12.07
Text of the scientific article Doppler ultrasound based non-invasive heart rate telemonitoring system for wellbeing assessment
Published Online December 2018 in MECS
Telemonitoring includes easy-to-use equipment’s that help patients to track their physiological parameters at the comfort of their home and transmit the information to a distant clinic for timely diagnosis [1]. Patients can monitor their vital signs and related symptoms regularly to identify any health-related illness at an early stage. Heart sounds are also one of the several important vital parameters which reflect the proper rhythm and functioning of heart muscles and its valves [2]. Heart sounds are produced by the closing of heart valves when blood passes through it [3]. Four types of heart sounds can probably be heard during a single cardiac cycle. The most fundamental heart sounds are the first (S1) and second (S2) [3]. S1 sound (“lub”) is produced by the closure of the atrioventricular (AV) valves which consists of tricuspid and mitral valves while S2 sound (“dub”) is produced by the closure of semilunar valves which consists of aortic and pulmonic valves [3] [4]. In the case of cardiovascular disorders, abnormal heart sounds S3 and S4 can also be heard. However, sometimes S3 and S4 sounds can also be heard in healthy children and young adults without having any heart-related abnormalities. S1 and S2 are high pitch sound having frequency contents in the range of 20-120Hz while S3 and S4 are low pitch sounds having frequency contents in the range of 50Hz and below [4]. Sometimes, an unusual sound called heart murmurs can also be heard because of turbulent flow of blood. Sometimes, heart murmurs can also be heard in healthy adults without any major heart problems. Abnormal murmurs can be heard in situations where improper opening and closing of heart valves occur due to stenosis or regurgitation [5]. The frequency range of heart murmurs lies anywhere between 20Hz and 2kHz [4]. A stethoscope is a device used to capture the heart sounds and murmurs that arise due to cardiovascular activity. A phonocardiogram (PCG) is a recording of the heart sounds and murmurs occurring during a cardiac cycle with the help of a machine called the phonocardiograph. As heart sounds are a mixture of both high and low-frequency sound waves so a stethoscope should be of very high selectivity and sensitivity [6], [7]. Proper diagnostic interpretation from heart sounds also requires highly skilled and experienced medical personnel.
Therefore, there is a need of a modern stethoscope that can handle the above limitations.
The electrocardiogram (ECG) is also a widely used and proven method of screening and monitoring the proper functioning of the heart and its electrical activity. However, certain abnormalities like heart murmurs, structural defects of heart walls and valves can’t be diagnosed easily. Magnetic resonance imaging (MRI), ultrasonography (USG), computerized tomography (CT) techniques are also employed to investigate further the size, shape, structure, and function of the heart [8], [9]. These techniques also create moving image of the heart in real time. However, a major limitation of these techniques is their high cost, the requirement of highly experienced clinical personnel to operate and nonportability of the equipment [10]. Therefore, there is a requirement of a cost-effective, portable, non-invasive, easy to use and reliable technique for early and timely detection of heart-related abnormalities for patients living in rural and remote areas.
In this research, we have developed an ultrasoundbased electronic auscultation system with the aim in mind that the system should be easy to configure and can be operated from home for early detection and monitoring of heart-related illness. We have used an ultrasound sensor in combination with an ECG, PPG and pulse oximeter sensor for a long-term real-time monitoring of heart activity and to verify the results of the ultrasound sensor for reliability and accuracy. The calculated heart rate shows a promising, accurate and reliable ultrasound auscultation system for telemonitoring of heart sounds.
The rest of the paper is structured as follows: in Section 2, a brief background on heart sound and related works are presented. System description and architecture are explained in Section 3. In Section 4, a methodology for signal processing is explained. In Section 5, experimental results are presented. Section 6 discusses the results and limitations of the work. Finally, main conclusion and future scope of our work are pointed out.
-
II. Related Work
Heart sounds can be described by their intensity, pitch, location, quality, and timing in the cardiac cycle [11], [12]. Fig. 1 shows the main anatomic positions on the chest to place the sensor while evaluating heart sounds. The position includes the aortic area (second intercostal space [ICS] just to the right of the sternum), the pulmonary area (second ICS just to the left of sternum), the tricuspid area (fourth and fifth ICS just to the left of sternum), and the mitral area (cardiac apex). Fig. 2 illustrates that S1 sound starts approximately 0.05 sec after Q-R-S onset, S2 sound starts 0.03-0.05 sec after T-wave ends, S3 sound starts 0.12-0.18 sec after S2, S4 starts 0.12-0.18 sec after the onset of P-wave. The correlation between an ECG, a PCG, and a heart pulse waveform is shown in Fig. 3. Systole phase produces a peak in heart pulse waveform, and diastole phase produces a valley in heart pulse waveform.
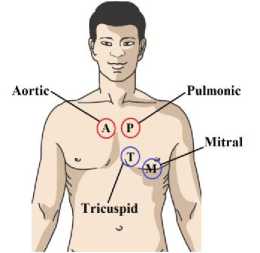
Fig.1. Routine areas for the heart sound auscultation.
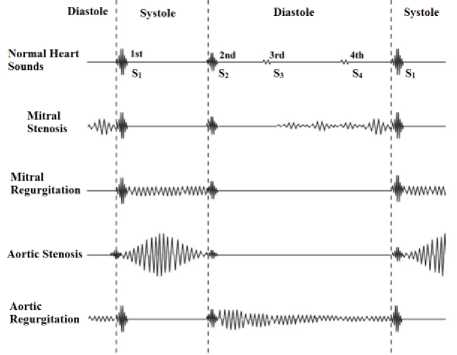
Fig.2. An example of normal heart sounds and heart sounds during stenosis and regurgitation
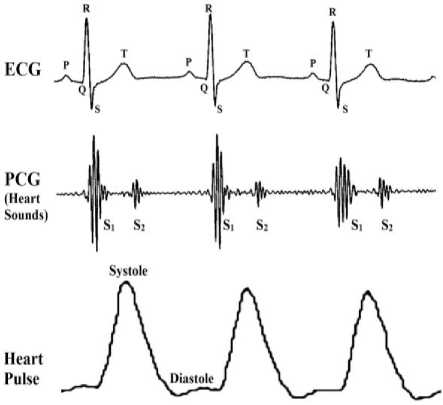
Fig.3. Comparison between ECG, PCG and heart pulse waveforms (Note: figure not to scale)
Various studies have been done in the past to create an electronic stethoscope for heart sound identification. A. Sa-ngasoongsong et al. developed a wireless sensor system using embedded hardware components and open source software for remote and mobile phonocardiograph applications [13]. L. Torres-Pereira et al. demonstrated the feasibility of a non-invasive telemetric PCG probe with minimal constraints as compared to ECG [14]. Recently, ultrasonic Doppler technology has been extensively utilized for the assessment of fetal heart sounds and fetal heart rate (FHR) for pregnancy-related complications [15]. M. Ruffo et al. proposed a combined ECG-PCG system for fetal heart rate detection and related anomalies [16]. Various other research also focuses on early detection fetal heart rate by developing a web-based fetal monitoring system [17][15], PC-based fetal PCG measurement [18][19], and simulation of maternal abdominal conditions for PCG based prenatal monitoring [20]. As heart sound are easily corrupted by the noise, therefore many studies have been lately based on denoising of PCG signals. A. Jimenez-Gonzalez et al. extracted fetal heart sounds from noisy single channel abdominal phonograms [21] using temporal independent component analysis (ICA) approach [22] and blind source separation (BSS) approach [23]. The underlying heart disorders and its nonlinearities can be observed by wavelet packet transform [24]. Wavelet denoising algorithms also provide the possibility of immediate processing of recorded PCG Signal [25][26]. Various studies show that uncertainties in heart sounds can also be handled by fuzzy logic algorithms [27]. A wavelet transform is an effective tool when it comes to the analysis of both time and frequency domain due to its localization property in both frequency and time domain. Wavelet thresholding method was proposed by Donoho in 1994 for the purpose of denoising by setting the threshold to remove noise in wavelet domain [28].
-
III. System Description
The proposed system for Doppler ultrasound-based heart sound monitoring consists of three main blocks discussed below and also shown in Fig. 4.
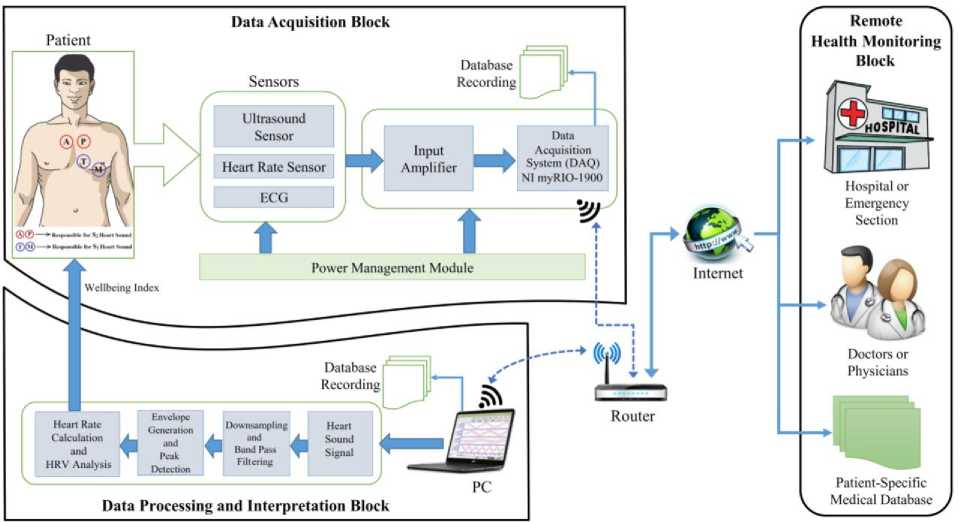
Fig.4. Architecture of the proposed Doppler ultrasound-based heart sound telemonitoring system
-
A. Data Acquisition Block
The ultrasound sensor used is a portable and nonintrusive sensor as shown in Fig. 5(A), and is placed on the chest of the patient to monitor heart sounds. The sensor is placed on the chest location where heart sounds are most audible. The preferred position for heart sound auscultation corresponds to the heart valves positions marked by A (aortic), P (pulmonic), T (tricuspid), M (mitral). The sensor works on the 2MHz frequency and consists of two ultrasonic crystals placed at an angle, one for the transmission and another for the reception. The transmitter continuously sends ultrasonic signals at a frequency of 2MHz which is reflected back by the surface and medium through which it passes. The reflected signals are continuously received by the receiver. The Doppler shift in the transmitted and reflected signals are converted into electrical signals which are amplified and transferred to the data acquisition unit for further processing. PPG sensor shown in Fig. 5(B) and an ECG sensor shown in Fig. 5(C) are also used for simultaneous heart pulse and ECG recording along with heart sound recordings. Precaution is taken for proper grounding and electrical isolation of the patient from the system.
For data acquisition, we have employed National Instruments (NI) myRIO-1900 which is a portable reconfigurable input/output (I/O) device used mainly for robotics, mechatronics, and control design environment as shown in Fig. 5(D). In this work, we have demonstrated the use of NI myRIO in biomedical data acquisition application. It is well suited for biomedical applications because of its high throughput and high data sampling rate. It consists of 10 Analog inputs at 500KS/s at 12bit resolution, 6 analog output at 345KS/s, 40 digital I/O lines, IEEE 802.b/g/n 2.4 GHz, LED’s, push buttons, onboard accelerometer, Xilinx FPGA and dual-core ARM Cortex A9 Zynq processor programmable with NI LabVIEW. A D-Link router is also employed which provides a reliable wireless connection between NI myRIO and PC. It also increases the range of operation of our system so that the patient can be monitored from a distance. We have successfully tested the multiple patients monitoring scenarios with the use of multiple NI myRIO devices by connecting them to a single router simultaneously for data acquisition.
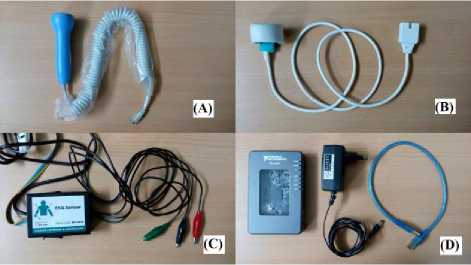
Fig.5. (A) Doppler ultrasound sensor; (B) PPG Sensor; (C) 3-Lead ECG sensor; (D) NI myRIO-1900 kit
-
B. Data Processing and Interpretation Block
As NI myRIO is seamlessly compatible with the NI LabVIEW, therefore, we have applied all the signal processing algorithms, data interpretation, and display in NI LabVIEW software installed on a core i3 PC with 4GB of RAM. We have designed a virtual instrument (VI) which displays all the relevant information like PCG, ECG and PPG acquired from patients in real time and simultaneously calculate the HR in beats per minute (bpm) and correlate the results in real time. The HR calculated from heart sound signal can easily be viewed and listened by the patient for home-based health monitoring. Several signal processing steps are used in this block as shown in Fig. 6 for quantifying the heart sounds signals into HR value for easy identification and interpretation of hearts rhythm and pace. The RR interval (also called as RR tachogram) calculated from HR data are used for HRV analysis to predict the overall health state of the patient.
-
C. Remote Health Monitoring Block
In this paper, we have also demonstrated the use of Internet-based telemonitoring of heart sounds and its corresponding HR. The calculated HR information from our experiments along with patient details are reliably transmitted via the Internet to the Google cloud service. This data can be accessed by authorized medical personnel for further advanced clinical diagnostics and consultancy. This cloud-based architecture provides healthcare solutions to patients who are beyond the reach of hospitals. Previous studies report that telemonitoring in the field of healthcare has effectively improved patients health outcome [29], [30].
-
IV. Signal Processing and Simulation
NI myRIO was programmed to collect samples at a rate of 1000Hz. Along with heart sounds, PPG and ECG were also recorded and displayed in the real-time VI developed in LabVIEW. NI myRIO has a very high data acquisition rate of 500KSamples/sec on its analog input port. This high data rate is only available over the single analog channel when it is operated in high throughput personality. Moreover, NI myRIO has a Linux-based real-time operating system (RTOS), and it stores data in its internal memory when used in high throughput personality. In our research, we have exploited the default personality of NI myRIO in which it stores data on the local hard disk of the system while maintaining the realtime functionality available over eight analog channels with the use of shared variables. Out of eight analog channels available we have used three channels at 1000Hz sampling rate each for heart sound, PPG and ECG simultaneously. Steps involved in heart rate estimation from recorded PCG signal is shown in Fig. 6 as a flow chart.
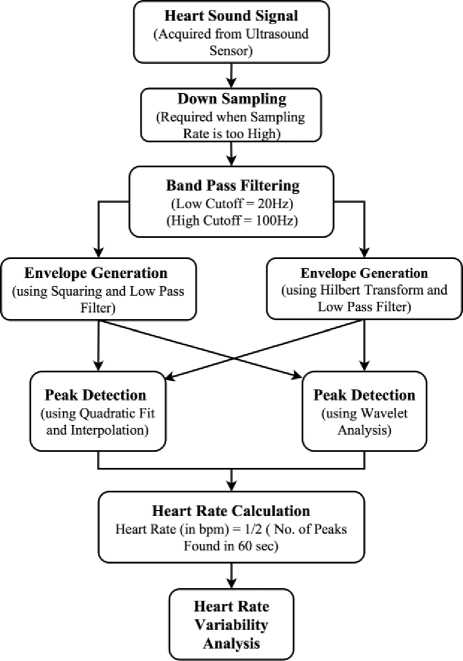
Fig.6. Flowchart of the signal processing steps involved in heart rate estimation from raw heart sound signals
-
A. Data Acquisition
Raw heart sound signals acquired via the ultrasound sensor along with ECG and PPG signal are displayed in real time in a PC running LabVIEW software as well as these data are stored simultaneously on the local disk for database generation and telemonitoring. Fig. 7(A) shows the captured raw heart sound signals.
-
B. Down Sampling
Original heart sound signal which is sampled at 1000Hz is down sampled to 500Hz to reduce the number of samples and to speed up the computation of heart rate. As the heart sound frequencies under consideration range from 20Hz to 200Hz as shown in Fig. 7(B) therefore proper precaution must be taken before downsampling the signal to avoid aliasing effect. The addition of an antialiasing filter before down sampling prevents undesired signals or noise to alias into the desired signal band.
-
C. Band Pass Filtering
The frequency of the fundamental heart sound S 1 and S 2 lies in the range of 20Hz-100Hz. In order to remove the frequencies outside this range, we have applied band pass filtering having two frequency threshold to the down sampled signal as shown in Fig. 7(C) and its corresponding FFT in Fig. 7(D).
-
D. Envelope Generation
The envelope of a signal represents the energy of the signal at that instant of time. The envelope of the band passed signal is extracted to find out the actual periodicity of the heartbeat. Two different approaches were used, one using squaring and low pass filtering and another with Hilbert Transform and low pass filtering. Both approaches tend to produce good results, but Hilbert Transform approach is more robust as shown in Fig. 7(E) and 7(F).
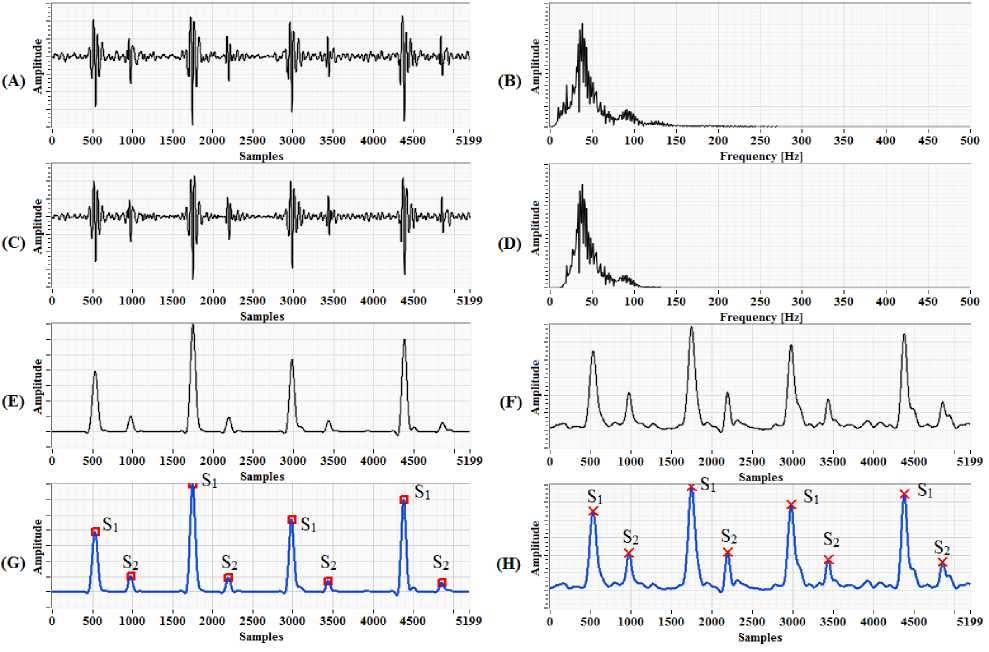
Fig.7. (A) Original heart sound signal obtained from ultrasound sensor; (B) FFT of the original heart sound signal having frequency content from 20Hz to 200Hz; (C) Band passed signal; (D) FFT of band passed signal having frequency content from 20Hz to 100Hz band; (E) Envelope generation using squaring and LPF; (F) Envelope generation using Hilbert transform and LPF; (G) Peak detection of waveform using quadratic fit and interpolation; (H) Peak detection using Wavelet transform
-
E. Peak Detection
Peak detection is one of an essential time-domain analysis performed in signal monitoring. In the block diagram of LabVIEW program as shown in Fig. 8 two peak detector functions were used, one using quadratic fit and interpolation method and another using Wavelet analysis. Both perform equally well in peak detection by defining the proper threshold. The detected peaks are shown in Fig. 7(G) and 7(H).
-
F. Heart Rate Calculation
The number of S1 and S2 peaks detected in 60 seconds is equal to the total number of fundamental heart sounds detected in that duration. In this research, we are focused on detecting the fundamental heart sounds S1 and S2 only and the experimental recordings were collected only for normal healthy adult males with no previous record of heart disease. Therefore, the calculated heart rate of the patient will be equal to half of the total number of peaks detected in 60 seconds.
-
G. Heart Rate Variability Analysis
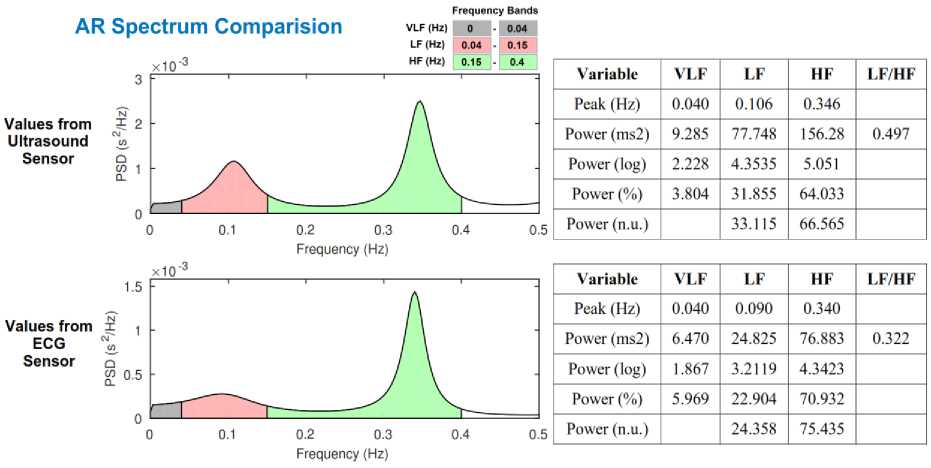
Heart Rate Variability (HRV) is defined as the variation in the time interval between successive heart beats (RR interval). The frequency spectrum of the RR interval is composed of two primary fluctuations, one Respiratory Sinus Arrhythmia (RSA wave) and other baroreceptor reflexes (Mayer wave). HRV is a direct indicator of autonomic regulation of the heart through analysis of these fluctuations. The frequency domain HRV analysis shows that Mayer waves are associated with low frequencies (0.04–0.15 Hz), and RSA wave is associated with high frequencies (0.15–0.40 Hz). The power contained within these frequency bands reflects the overall autonomic function of the patient.
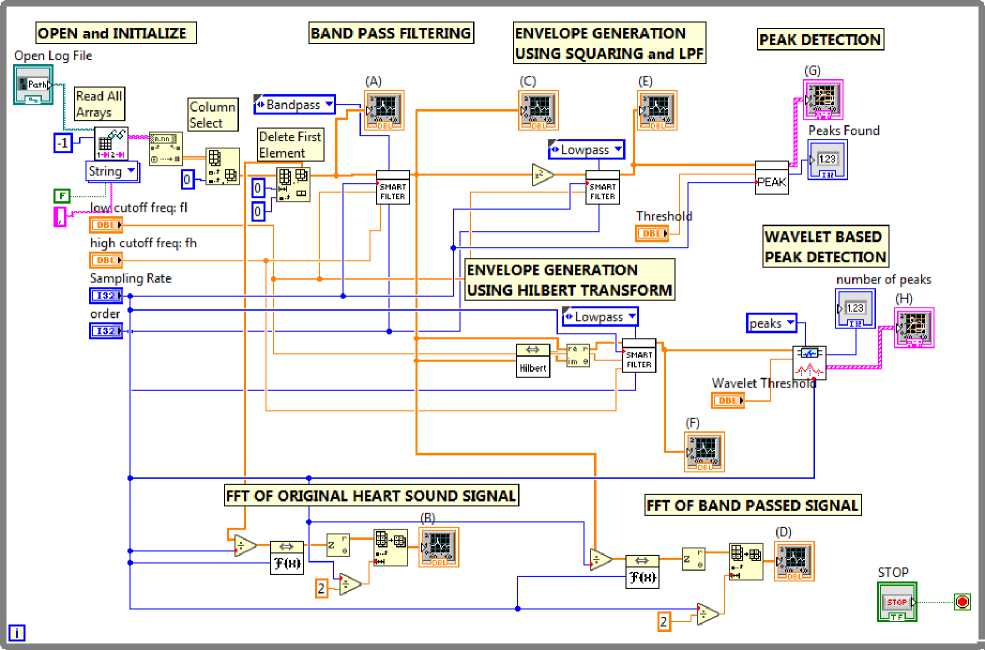
Fig.8. Block diagram of the LabVIEW program
-
V. Experiment and Results
The ultrasound-based hardware prototype is used to collect heart sound (PCG) signals from 40 healthy males in the age group of 25-35 years. All subjects were well informed about the experimental procedures, and written consent was taken from all subjects. One-minute recording of each individual is collected by placing an ultrasound sensor on the patient’s chest where the heart sounds are most audible. Locations corresponding to the pulmonary valve and mitral valves position gives a good audible signal. All recordings were made in upright sitting position as shown in Fig. 9. The captured heart sounds are wirelessly transmitted to the PC-based monitoring system for displaying, de-noising and further advanced signal processing. A real-time VI was developed which displays all the acquired data in real time and calculate the corresponding heart rate as shown in Fig. 10. High-frequency range headphone was used to hear the acquired PCG signals directly from NI myRIO audio out port in real-time. In place of headphones, the sound card installed in PC can also be used for listening high-quality audio output of PCG signals. All data are continuously logged onto the local hard disk for database generation. For performance validation of the ultrasound sensor, we have compared the results with a PPG sensor, an ECG sensor, and a pulse oximeter. When the recorded heart sounds were heard via headphones, the auscultated heart beats per minute were also tabulated. A typical value of the recordings obtained from 16 subjects are shown in Table 1. An overall accuracy of 96.74% was obtained when compared with the other sensors. Therefore, this prototype can easily be employed as a home-based electronic stethoscope for telemonitoring of heart sounds.
We have implemented a database generation and transmission protocol where each and every patient’s health information along with vital parameters like ECG,
PPG and PCG are collected and transferred reliably via the Internet to Google Fusion Table cloud service. With proper authentication, this database can be accessed by experienced medical personnel located at a distant clinic for advanced healthcare diagnostic and consultation.
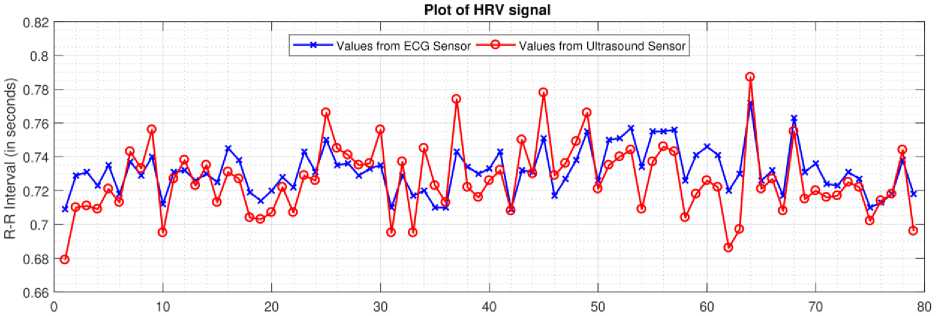
To understand the autonomic regulation of the heart, we have applied HRV analysis to all the 40 recordings. Heart rate data extracted from ECG sensor and ultrasound sensor for subject 4 are converted to R-R interval plot as shown in Fig. 11. R-peaks detected from ECG signal are considered as a reference value (depicted by the blue line in Fig. 11), and S1 peaks obtained from the heart sound signal are considered as measured value (depicted by the red line in Fig. 11). A comparison between the reference and measured R-R interval plots for subject 4 is shown in Fig. 11. An accuracy of 98.30% and a positive correlation of 0.75 was obtained for heartbeat detection from ultrasound sensor. Table 2, present the time-domain results obtained from HRV analysis. Frequency-domain results for Fast Fourier Transform (FFT) spectrum and Autoregressive (AR) spectrum are shown in Fig. 12 and Fig. 13 respectively.
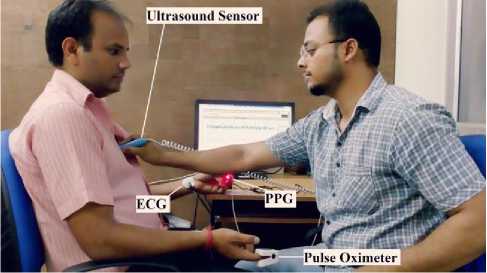
Fig.9. Real-time operation of the proposed device on a subject.
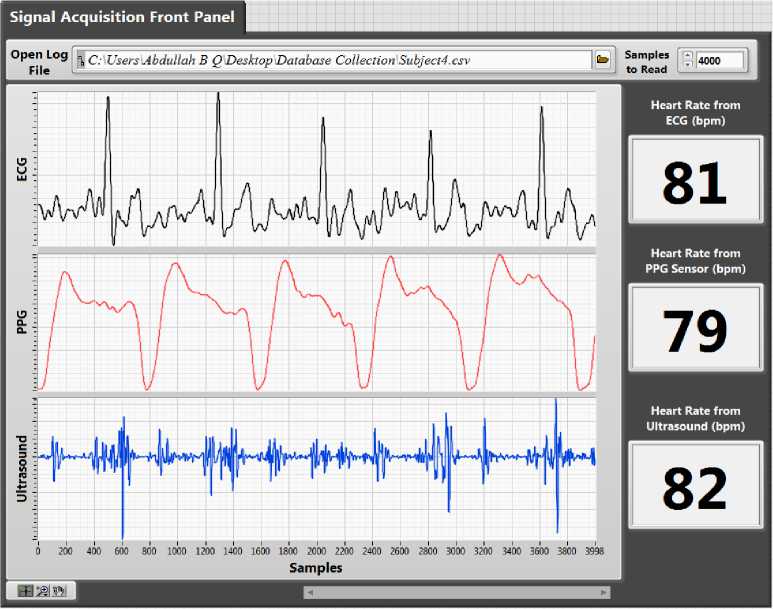
Fig.10. Front panel of the LabVIEW program.
Table 1. Comparison of heart rate data obtained from different sensors.
|
Subjects |
Measurement of heart rate (in bpm) using |
Performance Index (in %age) |
Accuracy |
|||||||
|
Ultrasound Sensor (A) |
PPG Sensor (B) |
ECG (C) |
Pulse Oximeter (D) |
Auscultation (E) |
A v/s B |
A v/s C |
A v/s D |
A v/s E |
||
|
Subject 1 |
76 |
80 |
77 |
77 |
78 |
95 |
98.7 |
98.7 |
97.44 |
97.46 |
|
Subject 2 |
78 |
84 |
79 |
81 |
78 |
92.86 |
98.73 |
96.3 |
100 |
96.97 |
|
Subject 3 |
76 |
80 |
80 |
78 |
78 |
95 |
95 |
97.44 |
97.44 |
96.22 |
|
Subject 4 |
80 |
79 |
79 |
80 |
76 |
98.73 |
98.73 |
100 |
94.74 |
98.05 |
|
Subject 5 |
78 |
84 |
79 |
83 |
78 |
92.86 |
98.73 |
93.98 |
100 |
96.39 |
|
Subject 6 |
82 |
80 |
78 |
84 |
77 |
97.5 |
94.87 |
97.62 |
93.51 |
95.87 |
|
Subject 7 |
80 |
84 |
80 |
84 |
76 |
95.24 |
100 |
95.24 |
94.74 |
96.3 |
|
Subject 8 |
84 |
84 |
78 |
84 |
79 |
100 |
92.31 |
100 |
93.67 |
96.49 |
|
Subject 9 |
81 |
83 |
78 |
82 |
80 |
97.59 |
96.15 |
98.78 |
98.75 |
97.82 |
|
Subject 10 |
83 |
87 |
86 |
79 |
82 |
95.4 |
96.51 |
94.94 |
98.78 |
96.41 |
|
Subject 11 |
72 |
76 |
75 |
72 |
71 |
94.74 |
96 |
100 |
98.59 |
97.33 |
|
Subject 12 |
76 |
78 |
78 |
80 |
78 |
97.44 |
97.44 |
95 |
97.44 |
96.83 |
|
Subject 13 |
81 |
78 |
77 |
78 |
79 |
96.15 |
94.81 |
96.15 |
97.47 |
96.15 |
|
Subject 14 |
82 |
83 |
82 |
76 |
77 |
98.8 |
100 |
92.11 |
93.51 |
96.1 |
|
Subject 15 |
76 |
79 |
80 |
79 |
78 |
96.2 |
95 |
96.2 |
97.44 |
96.21 |
|
Subject 16 |
82 |
86 |
82 |
78 |
81 |
95.35 |
100 |
94.87 |
98.77 |
97.25 |
|
Mean Accuracy |
96.74% |
|||||||||
Table 2. Time-Domain Results
|
Variable |
Values from Ultrasound Sensor |
Values from ECG Sensor |
|
Mean RR |
726.33 ms |
731.53 ms |
|
STD RR (SDNN) |
19.447 ms |
11.975 ms |
|
Mean HR |
82.607 beats/min |
82.020 beats/min |
|
STD HR |
2.2855 beats/min |
1.4751 beats/min |
|
Min HR |
79.830 beats/min |
79.851 beats/min |
|
Max HR |
84.986 beats/min |
83.659 beats/min |
|
RMSSD |
28.786 ms |
17.378 ms |
|
NNxx |
6 |
0 |
|
pNNxx |
7.692 % |
0 % |
|
HRV triangular index |
4.157 |
3.761 |
|
TINN |
79.000 ms |
55.000 ms |
Sample Number
Fig.11. R-R interval plot (for 80 samples) of heart rate data obtained from ECG sensor and ultrasound sensor.
Values from Ultrasound Sensor
Values from ECG Sensor
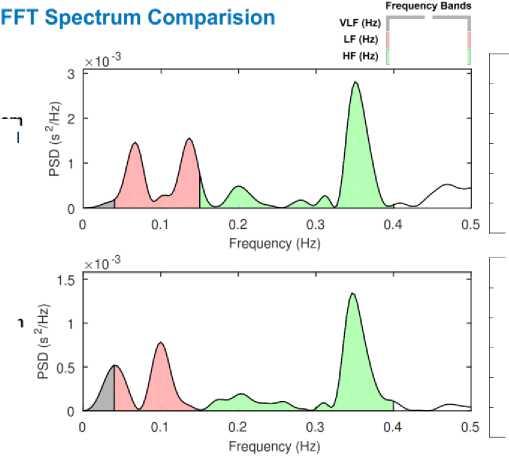
Fig.12. Comparison of frequency-domain results (FFT spectrum) obtained from subject 4 recordings.
|
0 |
0.04 |
|
|
0.04 |
0.15 |
|
|
0.15 |
0.4 |
|
Variable |
VLF |
LF |
HF |
LF/HF |
|
Peak (Hz) |
0.040 |
0.136 |
0.350 |
|
|
Power (ms2) |
2.784 |
84.103 |
120.39 |
0.698 |
|
Power (log) |
1.023 |
4.432 |
4.790 |
|
|
Power (%) |
1.342 |
40.547 |
58.040 |
|
|
Power (n.u.) |
41.098 |
58.830 |
|
Variable |
VLF |
LF |
HF |
LF/HF |
|
Peak (Hz) |
0.040 |
0.100 |
0.346 |
|
|
Power (ms2) |
8.751 |
33.154 |
61.763 |
0.536 |
|
Power (log) |
2.169 |
3.501 |
4.123 |
|
|
Power (%) |
8.423 |
31.912 |
59.449 |
|
|
Power (n.u.) |
34.847 |
64.918 |
Values from Ultrasound Sensor
5 2
co 1
0.2 0.3 0.4
Frequency (Hz)
AR Spectrum Comparision
VLF (Hz) LF (Hz)
Frequency Bands
Values from ECG Sensor
0.2 0.3
Frequency (Hz)
x10"3
HF (Hz)
1.5
co 05
xW3
Fig.13. Comparison of frequency-domain results (AR spectrum) obtained from subject 4 recordings.
|
Variable |
VLF |
LF |
HF |
LF/HF |
|
Peak (Hz) |
0.040 |
0.106 |
0.346 |
|
|
Power (ms2) |
9.285 |
77.748 |
156.28 |
0.497 |
|
Power (log) |
2.228 |
4.3535 |
5.051 |
|
|
Power (%) |
3.804 |
31.855 |
64.033 |
|
|
Power (n.u.) |
33.115 |
66.565 |
|
Variable |
VLF |
LF |
HF |
LF/HF |
|
Peak (Hz) |
0.040 |
0.090 |
0.340 |
|
|
Power (ms2) |
6.470 |
24.825 |
76.883 |
0.322 |
|
Power (log) |
1.867 |
3.2119 |
4.3423 |
|
|
Power (%) |
5.969 |
22.904 |
70.932 |
|
|
Power (n.u.) |
24.358 |
75.435 |
-
VI. Discussion
A variation in the R-R interval is a natural physiological phenomenon. These variations arise mainly due to the sympathetic and the parasympathetic activity of the human body which is governed by the autonomic nervous system (ANS). The effect of HRV on mother and her fetus has been studied by Queyam et al. in case of normal pregnancies and they concluded that feto-maternal HRV analysis is beneficial for understanding the autonomic regulation of mother and her fetus [31]. Factors like baroreflex sensitivity, thermoregulation, umbilical blood flow rate [32], circadian rhythm, meals, physical activity, etc. can be also be predicted by HRV analysis. Various studies in the past has confirmed the correlation between the amount of stress on an individual and the corresponding HRV of that individual [33]–[35].
The proposed ultrasound-based device also helps patients to keep track of their heart rate variability by measuring their heart sound signals.
Some design challenges and minor limitations related to this research work are mentioned below: -
-
1. Shared variables are used to transfer the data from NI myRIO Linux environment to Windows environment for data storage. This limitation makes NI myRIO collect data at a reduced sampling rate of only 1000 samples/second.
-
2. The directionality of an ultrasound sensor changes with slight movement of wrist angle. Therefore, the patient has to be very precise with the movement of their hand while holding the sensor.
-
VII. Conclusion
This work presents the use of a low-cost, non-invasive and portable ultrasound sensor based system for telemonitoring of fundamental human heart sounds S 1 and S 2 and the corresponding heart rate in beats per minute reliably and accurately. The hardware prototype developed is easy to operate and can be used at home by the elderly heart patients and patients living in remote areas. The application of NI myRIO DAQ in the biomedical domain has also been evaluated. The reliable wireless connection between the DAQ and the monitoring and recording system makes this prototype very portable and easy to operate in multiple patient scenarios as well. Connecting the DAQ wirelessly to a router also serve the purpose of increasing the monitoring range as well as connectivity with the Internet for transmission of the data in real time. The acquired heart sounds from 40 healthy males are validated with recordings acquired from a PPG sensor, an ECG sensor, and a pulse oximeter device simultaneously in real time. Heart sounds auscultations of ultrasound acquired signals are also performed for heart rate identification. The experimental results show that the prototype is capable of detecting both fundamental heart sounds (S 1 and S 2 ) with an overall accuracy of 96.74%. And the heart rate calculated from ultrasound sensor is highly accurate to be used as a standalone system for inhome PCG measurement, auscultation and telemonitoring. The prototype is beneficial for patient’s living in remote and rural part of India.
-
VIII. Future Scope
In future authors would like to acquire heart sound signal at a higher sampling rate with NI myRIO in build Xilinx FPGA chip. Fractal decomposition technique can be implemented for segmentation and classification of fundamental heart sounds as well as other pathological heart sounds including heart murmurs. We would like to expand our work in the feto-maternal domain for extracting fetal PCG signals for monitoring feto-maternal well-being.
Acknowledgement
References Doppler ultrasound based non-invasive heart rate telemonitoring system for wellbeing assessment
- S. Patel, H. Park, P. Bonato, L. Chan, and M. Rodgers, “A review of wearable sensors and systems with application in rehabilitation.,” J. Neuroeng. Rehabil., vol. 9, p. 21, Apr. 2012.
- S. McGee and S. McGee, “The First and Second Heart Sounds,” in Evidence-Based Physical Diagnosis, Elsevier, 2012, pp. 325–335.
- J. Naish and D. Syndercombe Court, Medical Sciences, Second Edition, Elsevier, 2014.
- E. Kaniusas, Biomedical Signals and Sensors II. Berlin, Heidelberg: Springer Berlin Heidelberg, 2015.
- E. M. Brown, Heart Sounds Made Easy. Churchill Livingstone/Elsevier, 2008.
- G. Zhang, M. Liu, N. Guo, and W. Zhang, “Design of the MEMS Piezoresistive Electronic Heart Sound Sensor.,” Sensors (Basel)., vol. 16, no. 11, Nov. 2016.
- S. Leng, R. S. Tan, K. T. C. Chai, C. Wang, D. Ghista, and L. Zhong, “The electronic stethoscope.,” Biomed. Eng. Online, vol. 14, p. 66, Jul. 2015.
- P. J. Kilner, “Imaging congenital heart disease in adults.,” Br. J. Radiol., vol. 84 Spec No, no. Spec Iss 3, pp. S258-68, Dec. 2011.
- P. Kuchynka et al., “The Role of Magnetic Resonance Imaging and Cardiac Computed Tomography in the Assessment of Left Atrial Anatomy, Size, and Function,” Biomed Res. Int., vol. 2015, pp. 1–13, Jul. 2015.
- K. Dickstein, “Clinical utilities of cardiac MRI,” E-Journal Cardiol. Pract., vol. 6, 2008.
- J. M. Felner, The First Heart Sound. Butterworths, 1990.
- J. M. Felner, The Second Heart Sound. Butterworths, 1990.
- A. Sa-ngasoongsong, J. Kunthong, V. Sarangan, X. Cai, and S. T. S. Bukkapatnam, “A Low-Cost, Portable, High-Throughput Wireless Sensor System for Phonocardiography Applications,” Sensors, vol. 12, no. 12, pp. 10851–10870, Aug. 2012.
- L. Torres-Pereira, P. Ruivo, C. Torres-Pereira, and C. Couto, “A noninvasive telemetric heart rate monitoring system based on phonocardiography,” in ISIE ’97 Proceeding of the IEEE International Symposium on Industrial Electronics, 1997, pp. 856–859.
- A. Bin Queyam, S. K. Pahuja, and D. Singh, “Non-Invasive Feto-Maternal Well-Being Monitoring: A Review of Methods,” J. Eng. Sci. Technol. Rev., vol. 6, no. 5, pp. 7–14, 2017.
- M. Ruffo et al., “Non Invasive Foetal Monitoring with a Combined ECG - PCG System,” in Biomedical Engineering, Trends in Electronics, Communications and Software, InTech, 2011.
- A. K. Mittra and N. K. Choudhary, “Development of a Web-Based Fetal Monitoring System: An Innovative Approach,” Biomed. Eng. Appl. Basis Commun., vol. 20, no. 1, pp. 27–37, Feb. 2008.
- R. S. Anand, “PC based monitoring of human heart sounds,” Comput. Electr. Eng., vol. 31, no. 2, pp. 166–173, Mar. 2005.
- M. Moghavvemi, B. . Tan, and S. . Tan, “A non-invasive PC-based measurement of fetal phonocardiography,” Sensors Actuators A Phys., vol. 107, no. 1, pp. 96–103, Oct. 2003.
- V. S. Chourasia and A. K. Tiwari, “Development of a Signal Simulation Module for Testing of Phonocardiography Based Prenatal Monitoring Systems,” in 2009 Annual IEEE India Conference, 2009, pp. 1–4.
- A. Jimenez-Gonzalez and C. J. James, “Blind source separation to extract foetal heart sounds from noisy abdominal phonograms: a single channel method,” in 4th IET International Conference on Advances in Medical, Signal and Information Processing (MEDSIP 2008), 2008, pp. 1–4.
- A. Jimenez-Gonzalez and C. J. James, “Source separation of Foetal Heart Sounds and maternal activity from single-channel phonograms: A temporal independent component analysis approach,” in 2008 Computers in Cardiology, 2008, pp. 949–952.
- A. Jimenez-Gonzalez and C. J. James, “Extracting sources from noisy abdominal phonograms: a single-channel blind source separation method,” Med. Biol. Eng. Comput., vol. 47, no. 6, pp. 655–664, Jun. 2009.
- F. Safara, S. Doraisamy, A. Azman, A. Jantan, and A. R. Abdullah Ramaiah, “Multi-level basis selection of wavelet packet decomposition tree for heart sound classification,” Comput. Biol. Med., vol. 43, no. 10, pp. 1407–1414, Oct. 2013.
- V. S. Chourasia and A. K. Mittra, “Wavelet-based denoising of fetal phonocardiographic signals,” Int. J. Med. Eng. Inform., vol. 2, no. 2, p. 139, 2010.
- D. Gradolewski and G. Redlarski, “Wavelet-based denoising method for real phonocardiography signal recorded by mobile devices in noisy environment,” Comput. Biol. Med., vol. 52, pp. 119–129, Sep. 2014.
- V. S. Chourasia, A. K. Tiwari, and R. Gangopadhyay, “Interval type-2 fuzzy logic based antenatal care system using phonocardiography,” Appl. Soft Comput., vol. 14, pp. 489–497, Jan. 2014.
- D. L. Donoho, “De-noising by soft-thresholding,” IEEE Trans. Inf. Theory, vol. 41, no. 3, pp. 613–627, May 1995.
- C. Davis, M. Bender, T. Smith, and J. Broad, “Feasibility and Acute Care Utilization Outcomes of a Post-Acute Transitional Telemonitoring Program for Underserved Chronic Disease Patients,” Telemed. e-Health, vol. 21, no. 9, pp. 705–713, Sep. 2015.
- N. Varma, J. P. Piccini, J. Snell, A. Fischer, N. Dalal, and S. Mittal, “The Relationship Between Level of Adherence to Automatic Wireless Remote Monitoring and Survival in Pacemaker and Defibrillator Patients,” J. Am. Coll. Cardiol., vol. 65, no. 24, pp. 2601–2610, Jun. 2015.
- A. Bin Queyam, S. Kumar Pahuja, and D. Singh, “Quantification of Feto-Maternal Heart Rate from Abdominal ECG Signal Using Empirical Mode Decomposition for Heart Rate Variability Analysis,” Technologies, vol. 5, no. 4, p. 68, Oct. 2017.
- A. Bin Queyam, S. K. Pahuja, and D. Singh, “LabVIEW-based Virtual Instrument for Simulation of Doppler Blood Flow Velocimetry of Umbilical Artery,” J. Instrum. Technol. Innov., vol. 6, no. 1, pp. 1–9, 2016.
- M. Singh and A. Bin Queyam, “Stress Detection in Automobile Drivers using Physiological Parameters: A Review,” Int. J. Electron. Eng., no. 2, pp. 1–5, 2013.
- M. Singh and A. Bin Queyam, “Correlation between Physiological Parameters of Automobile Drivers and Traffic Conditions,” Int. J. Electron. Eng., no. 2, pp. 6–12, 2013.
- M. Singh and A. Bin Queyam, “A Novel Method of Stress Detection using Physiological Measurements of Automobile Drivers,” Int. J. Electron. Eng., no. 2, pp. 13–20, 2013.
