Dosage of physical activity using determination of ventilatory anaerobic threshold by cardiopulmonary exercise test

Author: Stojmenović T., Stojmenović D., & Purković M.
Journal: Sport Mediji i Biznis @journal-smb
Article in issue: 1 vol.9, 2023.
Free access
Dosing physical activity is a very important segment in the exercise do-main of every person, whether they are a child, an recreational person or a professi-onal athlete. The aim of this paper is to present the most optimal and direct method for assessing the functional status of an individual and to explain the way in which physical activity can be dosed most effectively using a Cardiopulmonary exercise test (CPET). In this work, the descriptive method of conducting the CPET test was used as a standard for determining the beginning of physical activity, but also for determining training thresholds. Adequate physical activity should be optimally dosed, neither too much nor too little, but sufficient to cause physical adaptation of the organism to effort. In sport and physical activity, the heart rate parameter and the determination of the degree of fatigue in relation to the maximum heart rate of the person exercising are most often used to measure effort.
Sport, training, load test, physical activity
Short address: https://sciup.org/170203615
IDR: 170203615 | UDC: 796.015.62 | DOI: 10.58984/smb2301041s
Text of the scientific article Dosage of physical activity using determination of ventilatory anaerobic threshold by cardiopulmonary exercise test
DOI:
A low level of physical activity during life is associated with an increased risk of developing cardiovascular diseases, diabetes mellitus type 2, some types of tumors, various psychological disorders, obesity, osteoporosis, and the like. According to the World Health Organization, insufficient and inadequate physical activity is the fourth leading risk factor for global mortality after hypertension, smoking and diabetes (Mountjoy M. 2011). Regular exercise of physical activity, regardless of age or the existence of some chronic diseases, contributes to health and improvement of the general condition of the organism. In order to get the best for your health from physical activity, and to make the exercise itself safe, it is necessary to include, i.e. the frequency, intensity, type and duration of physical activity should be optimal, i.e. adapted to each person according to their current abilities and state of health. One of the most reliable ways to gain insight into the health and functional state of the body is a cardiopulmonary physical exercise test, i.e. ergospirometry.
Cardiopulmonary exercise test (CPET)
During CPET, samples of exhaled air are analyzed, i.e. the exchange of gases (oxygen and carbon dioxide) is directly monitored and their content in the exhaled air is determined. The data obtained are presented tabularly and graphically, which gives an insight into a large number of parameters that reflect the state of health and the level of training of each individual, i.e. the functional ability of the organism. CPET is a fairly simple and financially accessible physical load test that provides insight into the state of the organic and metabolic systems of the organism responsible for the transport of oxygen from the air to the mitochondria and its utilization by the effector organs, i.e. muscles to initiate oxidative processes. Each of these systems represents an individual link in the chain that participates in the transport of oxygen and its use to create the energy necessary for work. Oxygen from the outside air, via the upper respiratory tract, reaches the alveoli in the lungs, from where it reaches the pulmonary capillaries through the process of diffusion through the alveolar-capillary membrane, i.e. reaches the blood, in order to restore the oxygen supply in the organism at the level of the organism's tissues, which are consumed during oxidative processes. Also, the diffusion of gases between the alveoli of the lungs and the capillaries has as its goal the removal of carbon dioxide from the organism, which reaches them from the systemic venous blood. Differences in the partial pressures of gases in the alveoli and blood create a pressure gradient that enables the movement of gases across the respiratory membrane (PO2alv:PO2krv =105mmHg:40mmHg; PCO2krv:PCO2alv = 46mmHg:40mmHg). Hemoglobin capacity of the blood is an important link that participates in the transport of oxygen to the tissues, considering the fact that oxygen in the blood is transported bound to hemoglobin in the form of oxyhemoglobin (~98% of total oxygen). One gram of hemoglobin can bind ~1.34 ml of oxygen. The average amount of hemoglobin per
100 ml of blood is 14-18g for men and 12-16g for women, so the capacity of blood to transport oxygen is ~ 16-24 ml of oxygen per 100 ml of blood. Therefore, people with a reduced concentration of hemoglobin in the blood (anemia) have a reduced capacity to transport oxygen to the muscles, which reduces their aerobic efficiency. The cardiovascular system has the function of transferring oxygen to the tissues, and here the most important role is played by the cardiac output (MV). so the capacity of blood to transport oxygen is ~ 16-24 ml of oxygen per 100 ml of blood. Therefore, people with a reduced concentration of hemoglobin in the blood (anemia) have a reduced capacity to transport oxygen to the muscles, which reduces their aerobic efficiency. The cardiovascular system has the function of transferring oxygen to the tissues, and here the most important role is played by the cardiac output (MV). so the capacity of blood to transport oxygen is ~ 16-24 ml of oxygen per 100 ml of blood. Therefore, people with a reduced concentration of hemoglobin in the blood (anemia) have a reduced capacity to transport oxygen to the muscles, which reduces their aerobic efficiency. The cardiovascular system has the function of transferring oxygen to the tissues, and here the most important role is played by the cardiac output (MV).
The normal function of the heart muscle is the most important link in the mentioned chain, considering that the weakness of the heart muscle limits an individual's exercise capacity to the greatest extent. Oxygen consumption at the tissue level depends on the amount of blood delivered to the tissue and the amount of oxygen taken up by the tissue. This relationship between cardiovascular function and metabolism can be represented by Fick's equation: VO2 = MV x (a-v)O2 difference: oxygen consumption is the product of cardiac output and the difference in arterial and venous oxygen concentrations. Finally, the functional capacity of the muscles to take up and convert oxygen into energy, as well as the muscle mass itself, have an impact on the efficiency of oxygen utilization and energy generation for work. Transport of oxygen from the circulation, i.e. capillary to muscle tissue depends on the difference in the amount of oxygen in arterial and venous blood: (a-v)O2 difference, on one and the other side of the capillary network. When the intensity of physical activity increases, the (a-v)O2 difference also increases, which facilitates the transport of oxygen to the muscle tissue. In the muscle itself, oxygen is transported to the mitochondria in the form of myoglobin where it is used for oxidative processes in order to generate energy for work. Damage to any of these links can, to a lesser or greater extent, affect the reduction of the functional ability of the organism, which can be easily observed during CPET, which gives this type of test an advantage over many other diagnostic procedures ( which facilitates the transport of oxygen to the muscle tissue. In the muscle itself, oxygen is transported to the mitochondria in the form of myoglobin where it is used for oxidative processes in order to generate energy for work. Damage to any of these links can, to a lesser or greater extent, affect the reduction of the functional ability of the organism, which can be easily observed during CPET, which gives this type of test an advantage over many other diagnostic procedures ( which facilitates the transport of oxygen to the muscle tissue. In the muscle itself, oxygen is transported to the mitochondria in the form of myoglobin where it is used for oxidative processes in order to generate energy for work. Damage to any of these links can, to a lesser or greater extent, affect the reduction of the functional ability of the organism, which can be easily observed during CPET, which gives this type of test an advantage over many other diagnostic procedures (Mezzani, A.,e t. al 2009).
Only physical load requires common, ie. coordinated activity of all the abovementioned links in the chain in order to meet the increased needs of the organism for oxygen and at the same time increased production and elimination of carbon dioxide, all for the purpose of ensuring muscle contraction and performing physical work. In order to meet the needs for oxygen, and eliminate the produced carbon dioxide from the body, it is necessary for four processes to take place: 1. pulmonary ventilation, 2. pulmonary diffusion, i.e. gas exchange (O2 and CO2) between the circulation and the lungs, 3. transport of gases into the circulation and 4. gas exchange at the capillary level, i.e. diffusion of O2 and CO2 between capillary blood and muscles (Balady G et al. 2010). The first two processes are called external, while the fourth process is defined as internal respiration. CPET enables simultaneous monitoring of cellular, of the cardiovascular and ventilatory system during physical activity, which gives a very precise insight into the complete functional state of the organism, i.e. in the processes of external and internal respiration. Unlike other diagnostic methods (spirometry, electrocardiogram, etc.) that evaluate individual organ systems, the cardiopulmonary exercise test provides simultaneous monitoring of all organ systems necessary for performing physical activity. This test evaluates the efficiency of oxygen transport and utilization by monitoring oxygen kinetics during and after exercise, determining the ventilatory anaerobic threshold and maximum and/or peak oxygen consumption (VO2max and/or VO2peak), which is a measure of aerobic capacity. Ventilator efficiency is also estimated using the oxygen consumption efficiency curve. the oxygen uptake efficiency slope) which represents the rate of increase of VO2 in relation to ventilation (VE). This slope indicates the efficiency of oxygen uptake and utilization by tissues and is determined during exercise as a linear ratio of VO2 vs the logarithm of VE. In cardiac patients, the oxygen consumption efficiency curve is lowered, and increases as a result of training, so the values of the slope can be used in order to dose and monitor the effects of physical activity, especially in cardiovascular patients (Mezzani, A., 2009). Another way to assess ventilatory efficiency is to monitor the VE vs VCO2 curve, which represents the amount of air that must be ventilated to remove 1l of carbon dioxide, that is, it represents the ability of the lungs to remove accumulated carbon dioxide from the body. CPET is also used to evaluate hemodynamic changes during physical activity, which depend to the greatest extent on cardiac output, and to a lesser extent on (a-v)O2 differences.
Given that the (a-v)O2 difference increases linearly with the increase in load, its value is easily predicted, and therefore MV during CPET can be indirectly calculated for a given value of maximum oxygen consumption via Fick's equation (Balady G et al. 2010). In addition, during CPET, heart rate during exercise (electrocardiogram), heart rate, blood pressure values, blood lactate concentration, oxygen saturation, etc. can also be determined. In this way, one gets an insight into the body's response to a given physical activity, which can be normal or pathological, the existence of a corresponding heart and/or lung disease, the individual's training and heart rate recovery after submaximal or maximal effort (Wasserman K, et.al 2012) . The system for CPET consists of a gas analyzer (oxygen and carbon dioxide) and a sensor for the volume of exhaled air, through which lung ventilation, oxygen utilization and carbon dioxide production are measured5. In order to obtain adequate parameters, it is desirable to perform the maximum CPET, if there are no health contraindications or no subjective complaints or serious cardiorespiratory disorders occur during the test itself. The optimal duration of the test is 8-12 minutes.
If the test lasts too short, interpretation of the results is not possible, while tests longer than 12 minutes lead to unnecessary muscle fatigue and exhaustion. CPET can be performed on a treadmill or on an ergobike (recumbent or seated), depending on the individual's state of health and training, i.e. the type of sport the individual practices. There are different protocols that can be used to perform CPET, and they are also tailored to the individual. Protocols can be continuous (so-called ramp protocols) with a continuous increase in load in intervals of 10 to 60 seconds. Step protocols can be divided into incremental and interval protocols and are usually recommended for people with suspected ischemic heart disease (e.g. Bruce protocol on a treadmill) (Nedeljković I, Dikic N, et al, 2014)
Wasserman curves (eng.: nine-panel plot)
During the cardiopulmonary physical exercise test, a large number of parameters are obtained that can be displayed in tabular or graphical form. Due to the large amount of data, the graphical representation of the obtained results is much more practical. These parameters are shown using nine graphs (eng.: nine panel plot), the so-called. Wasserman curves, which are arranged systematically and present the cardiovascular and ventilatory response to physical activity, the ventilation/perfusion ratio (V/Q) response, as well as the metabolic response to exercise (Figure 1).
The data obtained through the graphs can provide answers to many questions: is the capacity for exercise reduced, are there increased metabolic requirements for physical activity, is there a disturbance in the level of oxygen flow, is the ventilatory capacity for exercise reduced, that Is there a pronounced discrepancy between the ratio of ventilation and perfusion, is there a disorder at the muscle level in terms of taking up oxygen as a substrate for creating energy for work, is exercise limited by psychosomatic complaints, or is the work performed reduced due to the poor effort of the patient during the test itself4? In addition to the parameters describing the patient's health status, Wasserman curves are also used to determine the ventilatory anaerobic threshold (VAT) and the respiratory compensation point (RCP).
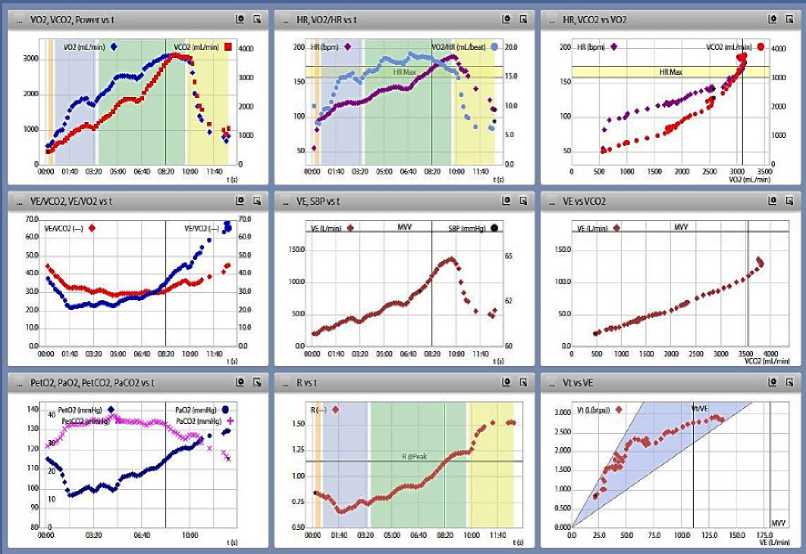
Figure 1 – Wasserman curves (eng.: nine-panel plot): VO2 = oxygen consumption (eng. oxy-gen uptake), VCO2 = production of carbon dioxide (eng. carbon dioxide output), HR = heart rate (eng. heart rate), VE = ventilation, MVV = maximal voluntary ventilation, PETO2 = end-tidal partial pressure of oxygen, PETCO2 = end-tidal partial pressure of carbon dioxide, R = coefficient of respiratory gas exchange, Vt = tidal volume. (Curves taken from the author's laboratory.)
In addition to the maximum oxygen consumption value, which is a measure of the patient's aerobic capacity, and which is also obtained through CPET, the thresholds mentioned above and the heart rates at which they are reached are also adjusted to the person's level of training. Based on this data, the optimal physical activity can be dosed for a given patient, according to the current state of health and level of training, and in accordance with the goals to be achieved through exercise. The most commonly used Wasserman curves for determining the ventilatory anaerobic threshold and respiratory compensation point are: VCO2 vs VO2 curve (V - slope method) and ventilatory equivalents curve for O2 and CO2 (EQO2, VE/VO2 and EQCO2, VE/VCO2), with a curve that describes end-tidal CO2 and O2 and is an indicator of CO2 and O2 exchange efficiency (PETCO2 and PETO2).
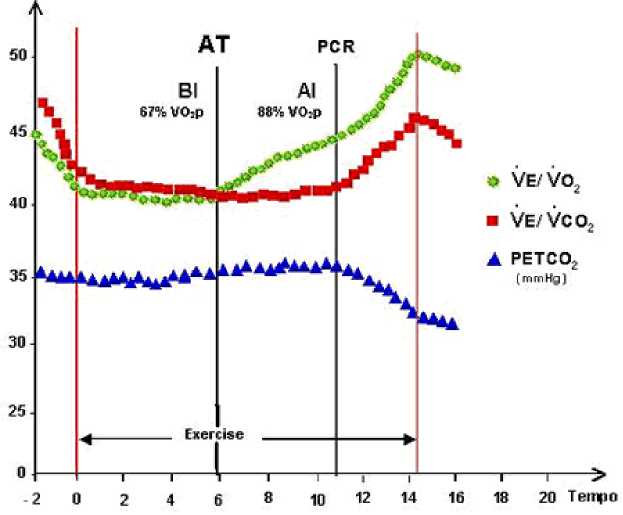
Figure 2 - Determination of ventilatory anaerobic threshold (AT) and respiratory compensation point (PCR) using Wasserman curves: VE/VO2 and VE/VCO2 = curves of ventilatory equivalents for oxygen and carbon dioxide, PETCO2 = end-tidal partial pressure of carbon dioxide. Adapted from: Ferraz AS et al J Am Coll Cardiol. 2003; 41:182A.
Ventilatory Anaerobic Threshold (VAT)
VAT represents the moment of an increase in lactate and the lactate/pyruvate ratio in muscles and arterial blood and occurs at that level of physical activity above which, in addition to the generation of energy in aerobic conditions, the production of the same in anaerobic metabolic processes (anaerobic glycolysis) begins (Gibbons R, Balady G, Bricker J, et al 2002). In different literature and by different authors, this threshold is also called "first ventilatory threshold", "lactate threshold", "anaerobic threshold", "aerobic threshold" and similar. (Binder R, et al, 2008). At this threshold, there is an increase in the production of carbon dioxide (VCO2), which is accompanied by an increase in lactate concentration.
Physical activity below VAT ensures the same level of lactate and lactate/pyruvate ratio in muscles and circulation, as during rest, which means that metabolic acidosis does not develop. On the other hand, physical activity above VAT implies the production of adenosine triphosphate (ATP) through the process of aerobic and anaerobic glycolysis (Wasserman K, et.al 2012, Nedeljković I, Dikic N, et al, 2014). Between VAT and RCP, the organism is in the zone of stable lactate state, because the increased concentration of hydrogen ions is buffered by bicarbonate - isocapnic buffering. During this process, there is an increased production of CO2, which slowly increases the ventilatory response of the organism to the increasingly pronounced acidosis during progressive loading. VAT represents a reliable measure of aerobic fitness and can be used to dose physical activity both in healthy individuals, as well as in patients. VAT is usually achieved between 40 and 60% of predicted VO2max. Pathological VAT (< 40% of predicted VO2max) is most often seen in cardiac patients with chronic heart failure. In these patients, VAT cannot be determined very often due to pronounced oscillatory breathing or the very short duration of the test due to pronounced subjective fatigue.
Therefore, VO2max (maximum oxygen consumption), which represents a plateau in oxygen consumption despite increased exercise intensity, is not determined in these patients, but VO2peak (peak oxygen consumption), i.e. the highest recorded VO2 value in the last 20 to 30 seconds of the maximal exercise test. On the other hand, in well-trained individuals, VAT can be achieved even at 80% of the predicted VO2max ( Pathological VAT (< 40% of predicted VO2max) is most often seen in cardiac patients with chronic heart failure. In these patients, VAT cannot be determined very often due to pronounced oscillatory breathing or the very short duration of the test due to pronounced subjective fatigue. Therefore, VO2max (maximum oxygen consumption), which represents a plateau in oxygen consumption despite increased exercise intensity, is not determined in these patients, but VO2peak (peak oxygen consumption), i.e. the highest recorded VO2 value in the last 20 to 30 seconds of the maximal exercise test. On the other hand, in well-trained individuals, VAT can be achieved even at 80% of the predicted VO2max ( Pathological VAT (< 40% of predicted VO2max) is most often seen in cardiac patients with chronic heart failure. In these patients, VAT cannot be determined very often due to pronounced oscillatory breathing or the very short duration of the test due to pronounced subjective fatigue. Therefore, VO2max (maximum oxygen consumption), which represents a plateau in oxygen consumption despite increased exercise intensity, is not determined in these patients, but VO2peak (peak oxygen consumption), i.e. the highest recorded VO2 value in the last 20 to 30 seconds of the maximal exercise test. On the other hand, in well-trained individuals, VAT can be achieved even at 80% of the predicted VO2max ( Very often VAT cannot be determined due to pronounced oscillatory breathing or the very short duration of the test due to pronounced subjective fatigue. Therefore, VO2max (maximum oxygen consumption), which represents a plateau in oxygen consumption despite increased exercise intensity, is not determined in these patients, but VO2peak (peak oxygen consumption), i.e. the highest recorded VO2 value in the last 20 to 30 seconds of the maximal exercise test. On the other hand, in well-trained individuals, VAT can be achieved even at 80% of the predicted VO2max (Very often VAT cannot be determined due to pronounced oscillatory breathing or the very short duration of the test due to pronounced subjective fatigue). Therefore, VO2max (maximum oxygen consumption), which represents a plateau in oxygen consumption despite increased exercise intensity, is not determined in these patients, but VO2peak (peak oxygen consumption), i.e. the highest recorded VO2 value in the last 20 to 30 seconds of the maximal exercise test. On the other hand, in well-trained individuals, VAT can be achieved even at 80% of the predicted VO2max (i.e. the highest recorded VO2 value in the last 20 to 30 seconds of the maximal exercise test. On the other hand, in well-trained individuals, VAT can be achieved even at 80% of the predicted VO2max (i.e. the highest recorded VO2 value in the last 20 to 30 seconds of the maximal exercise test. On the other hand, in well-trained individuals, VAT can be achieved even at 80% of the predicted VO2max (Mezzani, A.et, al, 2009, Wasserman K, et al, 2012)
Respiratory compensation point (RCP)
RCP or according to different literature, "second ventilatory threshold", "anaerobic threshold", "anaerobic lactate threshold", represents the moment of maximum increase in ventilation due to stimulation of the carotid bodies by a continuous drop in blood pH, i.e. further development of lactic acidosis at the expense of increasing exercise intensity (Binder R, et al 2008). RCP is very close to the very end of the test and occurs at a marked intensity of physical activity (Wasserman K, et.al 2012, Nedeljković I, Dikic N, et al, 2014). Above the point of respiratory compensation, the organism is in the zone of unstable lactate state, when the phase of respiratory compensation of metabolic acidosis occurs in the form of hyperventilation. Buffering, as a compensatory mechanism, increasingly loses its role in regulating acidosis and a sudden and uncontrolled increase in lactate concentration occurs (Figure 3).
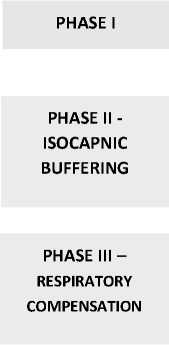
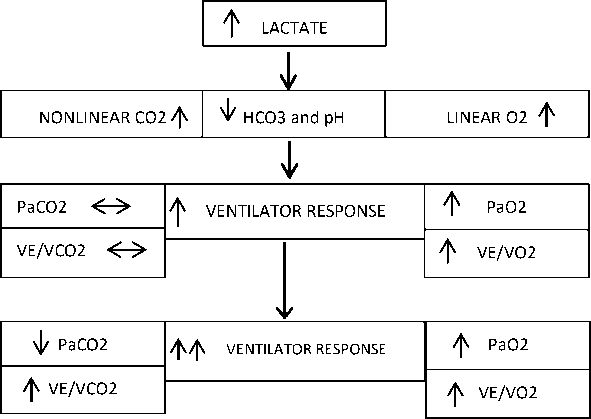
Figure 3 - Effect of lactate increase on gas exchange during progressive load increase
V-slope method (VCO2 vs VO2 curve)
An increase in the concentration of lactate in the blood leads to the appearance of acidosis, and during its buffering, the production of VCO2 exceeds the consumption of oxygen (VO2), while hyperventilation does not yet occur. When the relationship between these two variables (VCO2 vs VO2) is displayed graphically, two linear components are obtained. The lower component (S1) has a slope slightly less than 1 or 1, and the upper component (S2) has a slope greater than 1. The point where these two slopes intersect is the VAT. The transition of the VCO2 vs VO2 curve from a value < 1 (activation of only aerobic metabolism) to a value > 1 (in addition to aerobic metabolism, anaerobic metabolism is also included) represents the point at which VAT is recorded (Figure 4a) (Alessandro M, et. Al; 2009).
This threshold can be most easily determined by placing a 45° - right-angled triangle on the VCO2 vs VO2 curve, where the hypotenuse of the triangle makes a 45° angle with leg 1 of the triangle, while the two legs (1 and 2) make a 90° angle with each other. The hypotenuse of the triangle is placed on the lower component -S1, and the consumption of O2 at which the slope begins to increase above the angle of 45° (upper component - S2, slope > 1) represents VAT (Figure 4b). When determining VAT, it is essential to observe all Wasserman curves, so as not to misinterpret the results. As already stated, values of O2 consumption between 40% and 60% of expected VO2max are usually those at which VAT is achieved in healthy individuals. These values increase with the increase in training of the person (Marques-Neto S, et, al; 2012)
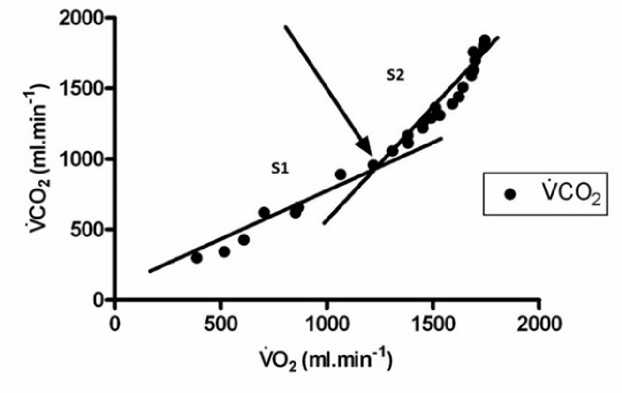
Figure 4a – V slope method for determining ventilatory anaerobic threshold: VCO2 = carbon dioxide output, VO2 = oxygen uptake, S1 = lower linear component, S2 = upper linear component. Adapted from: Ccw Yu, 2010.
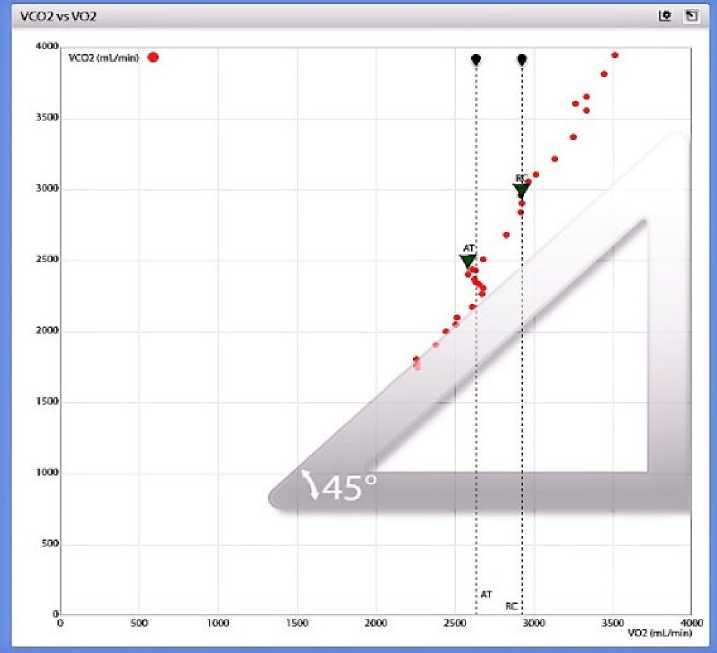
Figure 4b – VCO2 vs VO2 curve: Increase in slope above 45° angle (slope > 1). VCO2 = production of carbon dioxide (eng. carbon dioxide output), VO2 = consumption of oxygen (eng. oxygen uptake). Image taken from the author's laboratory.
Ventilator equivalent curve (VE/VCO2, VE/VO2)
VE/VCO2 represents the ratio of ventilation to CO2 production and the main link between the circulatory and ventilatory responses to physical activity. At the beginning of exercise, the value of VE/VCO2 normally decreases due to the increase in ventilation and perfusion, but during CPET it remains almost constant, and at maximum exercise, due to the occurrence of metabolic acidosis and consequent hyperventilation, it rises sharply, simultaneously with the respiratory equivalent for O2, which corresponds to the point of respiratory compensation. VE/VO2 represents the volume of inspired air per 1L of consumed O2. During CPET the ventilatory equivalent for oxygen constantly increases with increasing workload. An increase in VE/VO2, without a simultaneous increase in VE/VCO2, represents the point of reaching the ventilatory anaerobic threshold (VAT) and occurs as a result of buffering of metabolic acidosis by bicarbonate. Physical load above VAT leads to a further decrease in blood pH and an increase in lactate concentration > 2 mmol/l, which leads to the phase of ventilatory compensation of lactic acidosis and a simultaneous increase in VE/VCO2 and VE/VO2, i.e. until reaching RCP. At RCP, the lactate concentration rises above 4 mmol/l.
Exertion above this threshold represents a very high intensity physical activity and a distinct anaerobic effort that often only well-trained people can achieve (Figure 5). Also, when VE/VO2 values are the lowest during CPET (< 20), with stable ventilation and the lowest FetO2 values, i.e. fraction of O2 in the total exhaled air, means that the use of O2 by the organism is most efficient at that moment, which is very important for dosing aerobic training. This type of endurance is best developed with the intensity of physical activity that corresponds to the above-mentioned lowest values during exercise. Aerobic exercise training is very useful for the population of recreational beginners, obese people, as well as patients with various pathological conditions9. Physical activity at an intensity below this threshold does not make sense, because the training effects cannot be realized in any way. On the other hand, training between this ("aerobic") threshold and VAT, when the lactate concentration is < 2 mmol/l, develops the aerobic capacity of the individual, strengthens the cardiorespiratory system and has a curative effect on a large number of pathological conditions, without endangering the health condition.
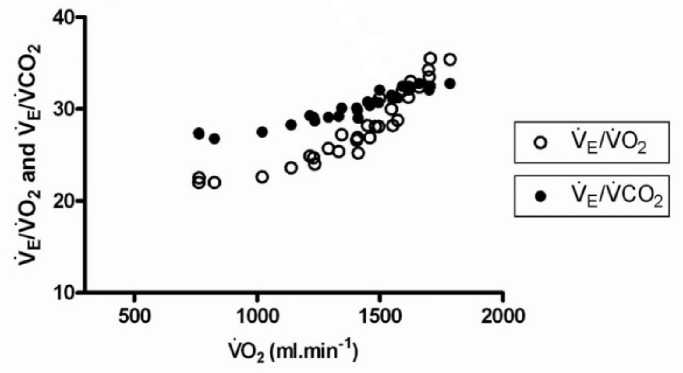
Figure 5 – Ventilator equivalent curve for O2 and CO2. VE = ventilation, VCO2 = carbon dioxide output, VO2 = oxygen uptake. Adapted from: Ccw Yu, 2010.
Dosage of physical activity
In order to achieve optimal health or sports results, it is necessary to dose physical activity in an adequate way, all in accordance with the goals that are being pursued and the abilities that the individual wants to develop through training. The FITT-VPP formula is an abbreviation for the components that are an integral part of every exercise and represents one of the main principles that should be followed when prescribing appropriate physical activity (F - frequency; I - intensity; T - time of training; T - type of training, V - volume of training, P - pattern of physical activity and P - progression, i.e. progress in training). Based on the results obtained by CPET, each person can be prescribed the exact number of training sessions during one week (frequency), exercise intensity (e.g.
Exercise intensity is the most critical component when it comes to prescribing physical activity, and determining ventilatory anaerobic thresholds (VAT and RCP) is key to optimal dosing of intensity, because training, below or above the appropriate threshold, may be too easy, so positive training effects on organism to be absent, or too strong, when training can worsen a person's health condition and do more harm than good11. Exercise intensity can be dosed based on maximum heart rate (HRmax), heart rate reserve (HPP) or VO2 reserve (VO2R), maximal or peak oxygen consumption (VO2max or VO2peak) and indirectly via the Borg scale of subjective fatigue rating equivalent to intensity physical activity and heart rate (Table 1). The maximum heart rate can be indirectly calculated based on various formulas (eg: 220 - number of years; 208 - (0.7 x number of years); 210 - (0.65 x number of years)), and based on CPET, a real value of HRmax is obtained, which is is achieved at maximum physical load, so according to the obtained anaerobic thresholds (VAT and RCP) physical activity can be more reliably and precisely dosed for each individual individually. According to ACSM, the optimal dose of intensity for achieving aerobic training effects is in the zone of 60-90% of HRmax. Heart rate reserve is the difference between HRmax and heart rate at rest (after waking up). Using Karvonen's formula, the target heart rate (THR) can be calculated depending on the desired intensity of physical activity: THR = k (HRmax – HRmir) + HRmir, where k represents the desired training intensity (e.g. k = 0. 5 or 0.80 for an intensity of 50% or 80% of HRmax). HRR is highly correlated with VO2R, which represents the difference between oxygen consumption at rest and VO2max/peak achieved during CPET, so the intensity of physical activity can be dosed based on this value, which is also obtained through CPET.
|
% of HRR or VO2R |
% of VO2max or VO2peak |
% of HRmax |
Borg scale |
|
|
Very low intensity |
< 20 |
< 25 |
< 35 |
< 10 |
|
Low intensity |
20-39 |
25-44 |
35-54 |
10-11 |
|
Moderate intensity |
40-59 |
45-59 |
55-69 |
12-13 |
|
High intensity |
60-84 |
60-84 |
70-89 |
14-16 |
|
Very high intensity |
≥ 85 |
≥ 85 |
≥ 90 |
17-19 |
|
Maximum intensity |
100 |
100 |
100 |
20 |
Table 1 – ACSM (American College of Sports Medicine) classification of exercise intensity. HRR = Heart Rate Reserve, VO2R = Oxygen Consumption Reserve, VO2max = Maximum Oxygen Consumption, VO2peak = Peak Oxygen Consumption, Hrmax = Maximum Heart Rate, Borg Scale = 6-8 to 20. Adapted from: Mezzani et al. EJPC 2013; 20 (3) 442-467.
Aerobic endurance is a reflection of training and the state of the cardiorespiratory system itself, and of all basic motor abilities it is the most important for the overall health of the organism. Also, aerobic capacity practically represents the base for the development of all other motor skills. A measure of aerobic capacity is maximal oxygen consumption (VO2max) or peak oxygen consumption (VO2peak), which is also determined by CPET. Low VO2max or VO2peak values are positively correlated with an increased risk of cardiorespiratory diseases (Nedeljkovic I, Mazic S, et al 2012, Wolpern A, Burgos D, Janot J, Dalleck L 2015). , which implies a larger volume, i.e. longer duration of the training session, but lower intensity at which it is performed. Depending on the health status of the person, level of training of a recreational athlete or the meso/macrocycle phase of a professional athlete, aerobic training of low, moderate or high intensity can be performed. In people with appropriate lung or heart diseases, as well as in extremely obese and poorly trained recreational athletes, low-intensity training is recommended in order to preserve health and improve cardiorespiratory fitness.
The recommended exercise intensity is in the zone between the "aerobic" threshold (FetO2 - value of oxygen fraction in exhaled air and VE/VO2 lowest during the test) and VAT.
In healthy and well-conditioned recreationists, as well as professional athletes, aerobic training of moderate to high intensity is recommended, located in the zone between VAT and RCP. Training in this zone also develops the individual's anaerobic lactate endurance, considering that above VAT, anaerobic glycolysis is involved in the process of creating ATP and the subsequent formation of lactate occurs, and the recommended heart rate range for improving this type of endurance is always closer RCP. Also, the type of training is different in relation to the aerobic type of exercise, considering that the emphasis is placed on much shorter, but more intense parts of the training. With this type of exercise, the body's tolerance to lactates is practically developed, and its goal is to reach VAT and RCP as soon as possible during the physical activity itself (Billat V, et al 2003, Cochrane K, 2014).
Anaerobic endurance is usually developed in professional athletes, who can develop different types of strength and speed in this training zone, less so in recreational athletes, and it is not recommended for poorly trained people, especially not for those with cardiorespiratory and other health problems (Billat V, et al 2003) Training above the RCP represents an extremely high level of physical activity and is recommended only for healthy and well-trained individuals. This type of physical activity develops speed and explosive power, as well as the body's tolerance to a particularly high level of lactate in the blood, i.e. it improves the use of the phosphocreatine system as an energy source, as well as anaerobic endurance (Barbarosa de Lira C et, al, 2013). The type of training is interval, which implies short, but extremely intense sections that are repeated in several series. If the section lasts too long, such a high intensity puts the organism itself in great danger of the occurrence of the so-called "burnout" syndrome, when there is a pronounced depletion of glycogen and a huge accumulation of lactate in the body, i.e. pathological fatigue occurs. Sometimes it takes days or even weeks for the body to recover from the resulting fatigue, which is not the goal of any training, not even in professional sports, which normally require a high level of physical activity.
Conclusion
Physical activity, if it is properly dosed, can act as medicine, and for professional athletes, only that which is properly dosed leads to the achievement of top results. Whether it is a healthy population of recreationists and athletes or individuals with appropriate health problems, a cardiopulmonary exercise test, i.e. ergospirometric testing is a very easy way to gain insight into the functional state of the organism. Based on the obtained parameters, each individual can be prescribed a "prescription" for physical activity, based on his current state of health and fitness and the goals he wants to achieve through training. In this way, each of us can get only the best from physical activity, both in terms of health and sports.
Conflicts of inerests
The authors declare no conflict of interest
References Dosage of physical activity using determination of ventilatory anaerobic threshold by cardiopulmonary exercise test
- Balady, GJ, Arena, R., Sietsema, K., Myers, J., Coke, L., Fletcher, GF, ... & Interdisciplinary Council on Quality of Care and Outcomes Research. (2010). Clinician's guide to cardiopulmonary exercise testing in adults: a scientific statement from the American Heart Association. Circulation, 122(2), 191-225.
- Barbarossa de Lira, CAB, Peixinho-Pena, LF, Vancini, RL, de Freitas Guina Fachina, RJ, de Almeida, AA, Andrade, MDS, & da Silva, AC (2013). Heart rate response during a simulated Olympic boxing match is predominantly above ventilatory threshold 2: a cross sectional study. Open access journal of sports medicine, 175-182.
- Billat, VL, Sirvent, P., Py, G., Koralsztein, JP, & Mercier, J. (2003). The concept of maximal lactate steady state: a bridge between biochemistry, physiology and sport science. Sports medicine, 33, 407-426.
- Binder, RK, Wonisch, M., Corra, U., Cohen-Solal, A., Vanhees, L., Saner, H., & Schmid, JP (2008). Methodological approach to the first and second lactate threshold in incremental cardiopulmonary exercise testing. European Journal of Preventive Cardiology, 15(6), 726-734.
- Cochrane, KC, Housh, TJ, Bergstrom, HC, Jenkins, ND, Johnson, GO, Schmidt, RJ, & Cramer, JT (2014). Perceptual and Physiological Fatigue Thresholds during Cycle Ergometry. Journal of Exercise Physiology Online.
- Fletcher, GF, Ades, PA, Kligfield, P., Arena, R., Balady, GJ, Bittner, VA, ... & Williams, MA (2013). Exercise standards for testing and training: a scientific statement from the American Heart Association. Circulation, 128(8), 873-934
- Gibbons, RJ, Balady, GJ, Timothy Bricker, J., Chaitman, BR, Fletcher, GF, ... & Smith Jr, SC (2002). ACC/AHA 2002 guideline update for exercise testing: summary article: a report of the American College of Cardiology/American Heart Association Task Force on Practice Guidelines (Committee to Update the 1997 Exercise Testing Guidelines). Circulation, 106(14), 1883-1892.
- Marques-Neto, SR, Maior, AS, Neto, GAM, & Santos, EL (2012). Analysis of heart rate deflection points to predict the anaerobic threshold by a computerized method. The Journal of Strength & Conditioning Research, 26(7), 1967-1974.
- Mezzani, A., Agostoni, P., Cohen-Solal, A., Corra, U., Jegier, A., Kouidi, E., ... & Vanhees, L. (2009). Standards for the use of cardiopulmonary exercise testing for the functional evaluation of cardiac patients: a report from the Exercise Physiology Section of the European Association for Cardiovascular Prevention and Rehabilitation. European Journal of Preventive Cardiology, 16(3), 249-267.
- Mountjoy, M. (2011). Health and fitness of young people: what is the role of sport?.June; 45: 837-38.
- Nedeljkovic, I, Dikic N, et al. 2014 Stress Test. Belgrade: Propaganda Jovanović
- Nedeljković, I., Mazić, S., Žugić, V., Giga, V., Dekleva, M., Popović, D., ... & Ostojić, M. (2012). Clinical application of the cardiopulmonary exercise test in modern cardiology and special groups of patients. Heart and blood vessels, 31(3), 166-173.
- Wasserman, K., Hansen, JE, Sue, DY, Whipp, BJ, & Froelicher, VF (1987). Principles of exercise testing and interpretation. Journal of Cardiopulmonary Rehabilitation and Prevention, 7(4), 189.
- Wolpern, AE, Burgos, DJ, Janot, JM, & Dalleck, LC (2015). Is a threshold-based model a superior method to the relative percentage concept for establishing individual exercise intensity? a randomized controlled trial. BMC sports science, medicine and rehabilitation, 7, 1-9.
