Dynamics of mortality in Russia in the context of the epidemiologic transition concept

Author: Korolenko Aleksandra Vladimirovna
Journal: Economic and Social Changes: Facts, Trends, Forecast @volnc-esc-en
Section: Young researchers
Article in issue: 4 (40) т.8, 2015.
Free access
The article briefly presents a modern view on the concept of epidemiologic transition, reflects features of its course in Russia: a lag of the main stages compared to the developed countries of the world and Europe, implementation of accelerated transition, layering of unresolved problems of previous phases. The author considers half-century dynamics of mortality of the Russian population in comparison with the world average and indicators of some developed countries, demonstrating its backlog, despite the overall positive trend. The work confirms persistence of high mortality of the Russian working-age population; presents calculations of demographic, socio-economic losses from premature deaths of citizens of this cohort. It states that external causes of death bring the largest demographic and socio-economic damage in the country and in the region: in Russia they account for 35% of all losses in PYLL and 2.45% of the total volume of GRP and 27 in the Vologda Oblast - 27% of all losses in PYLL and 2.7% of the total GRP...
Epidemiologic transition, mortality, mortality rates of the population, dynamics of mortality in the world, Russia and other countries, losses from premature deaths, regions of Russia, vologda oblast
Short address: https://sciup.org/147223746
IDR: 147223746 | UDC: 314.48:314.174 | DOI: 10.15838/esc/2015.4.40.14
Text of the scientific article Dynamics of mortality in Russia in the context of the epidemiologic transition concept
Mortality is a result of interaction of structural, medical (biological) and behavioral factors. The first includes the demographic and, primarily, the age structure of the population. The larger the share of elderly population, the higher the mortality. Man, having a bio-social essence, is characterized by defined anatomical and physiological properties that determine his/her development and functioning. Death is a natural end of life of any living organism due to natural wear of organs and systems. In 1971 the role of exogenous and endogenous factors of mortality was disclosed by A. Omran in the concept of epidemiological transition [9, pp. 57-91], representing a historically caused change of one type of pathology, defining the nature of morbidity and mortality, into another, one disease pattern and death cause into another. In the modern version of the theory there are 4 stages of epidemiological transition, consequently roles of causes of exogenous and endogenous of nature: period of epidemics and famine, period of declining pandemic of infectious diseases, period of degenerative and occupational diseases, period of delayed degenerative diseases [12, p. 5].
In the first stage (period of epidemics and famine) mortality was regulated mainly by eco-biological factors: level of adverse conditions in the environment, degree of organism’s resistance, prevalence of various infectious diseases; life expectancy of the population was minimum (20–25 years). This stage in the developed world lasted until the mid-18th century. The second stage began in the late 18th century and was characterized by increased life expectancy and reduced mortality from common infectious diseases. Transformation of the social structure of society determined the change: transition from the agrarian to the industrial model of the economic system, formation of the middle class, decline in the share of the poor and, as a consequence, improvement of the living standard of the population. The third stage began in the 1930s and was caused by major success in medicine: discovery and widespread use of antibiotics and sulfonamides, which made it possible to take control of such diseases as tuberculosis and pneumonia. This involved the change in the mortality structure (cardiovascular diseases and neoplasms had a lead) and in its age-related component – reduction of mortality of young population (the life expectancy increased to 60 years) [12, p. 8]. Thus, the health determinant (healthcare system development) together with the improved socio-economic conditions of life made a significant impact.
In the 1960–1970s the mankind faced a new problem – emergence of the so-called quasi-endogenous causes of morbidity and mortality instead of exogenous: cancer, endocrine, mental diseases, diseases of digestive and respiratory systems, etc., due to scientific and technological progress, urbanization and industrialization processes. In this period the foreign hygienists stated the presence of “diseases of civilization” as payment for economical progress, industrial revolution and resulting environmental pollution and growth of high stress due to rapid changes in lifestyle and nature of employment of a significant part of the population [1]. Nowadays the developed states are in the fourth stage of epidemiological transition (period of delayed degenerative diseases), characterized by priority of social and medical determinants in shaping patterns of mortality and morbidity.
In Russia epidemiological transition started later than in most Western countries, as it was hampered by many historical upheavals, faced population’s unreadiness for required changes [3, p. 258]. The second stage was observed in the country only in the late 19th – early 20th century and completed in the 1950s. The most successful and long period of declined mortality in Russian history was recorded during the “Khrushchev thaw”, when the country rapidly passed initial periods of the third stage and in 1965 the life expectancy was close to 70 years [12, c. 11]. Since the second half of the 1960s in Russia there was an increase in mortality from poisonings and injuries, diseases of the circulatory system. However, due to the specifics of the Russian health care system, aimed at combating infectious diseases and child mortality, the problem of high mortality from behavioral causes (e.g., alcoholism) was not solved. And only in the late 1980s due to the anti-alcohol campaign (1985–1986), and mortality, particularly from external causes, declined, and life expectancy reached the mid-1960s level. But the positive effect of the conducted activities was not long-lasting. The end of 1987 was characterized by grown production and per capita consumption of alcohol and, as a consequence, increased mortality rate. Since 1991 the country entered a “black demographic lane”: the population declined rapidly due to catastrophically grown mortality and decreased fertility, life expectancy went down, the transition to the last stage did not occur.
So, the development of epidemiological transition in Russia has the following distinctive features: delay of the main stages in comparison with developed countries of the world and Europe, implementation of an accelerated transition model, layering of unresolved problems of previous stages.
Let us consider the indicators of population’s mortality. For the last 50 years the crude death rate (CDR) in Russia has fluctuated significantly, the maximum peak of mortality was observed in 2003. Since 2004 it had been decreasing gradually. In 2004–2013 CDR declined by 21%. However, despite positive trends in the dynamics of this indicator in the Russian Federation the value of total mortality is consistently higher than in the EU [19] ( fig. 1 ). According to the latest data of the Central Intelligence Agency of the USA, as of 2014 [18] Russia ranges the 10th of 225 countries by mortality rate (of 13.8‰), near to African states, such as Somalia and Swaziland.
According to the WHO, in 2012 the standardized rates of mortality from the main classes of death causes in Russia are much higher than those of the leading world countries. So, the death rate from infectious diseases is 3–5-fold higher in our country, from non-communicable (chronic) diseases – 2–3-fold and from injury – 4–6-fold ( tab. 1 ).
Figure 1. Dynamics of total mortality in the world, the EU and Russia in 1960–2013, per mille, deaths per 1 thousand population)
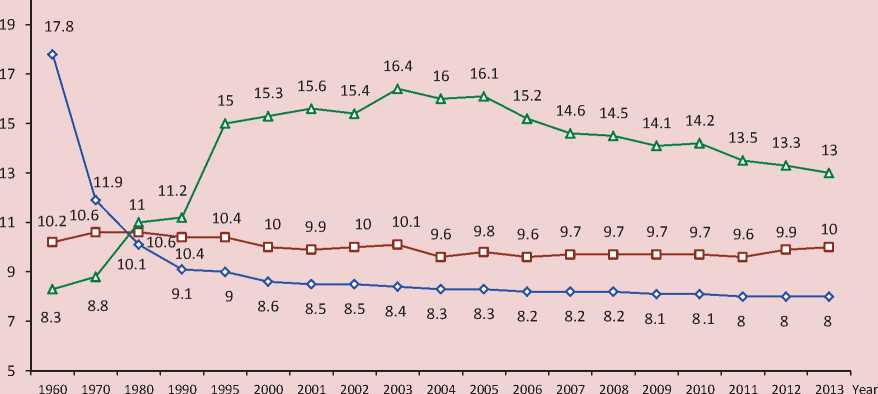
Russia European Union World
Sources: World Development Indicators. The World Bank. Available at: variableSelection/; DataFinder. Population Reference Bureau. Available at:
Table 1. Age-standardized mortality rates by death causes in the developed countries of the world, 2012
|
Country |
Standardized mortality rates, cases per 100 thousand population |
|||
|
All causes |
Communicable diseases |
Noncommunicable diseases |
Injuries |
|
|
World |
790 |
178 |
539 |
73 |
|
USA |
488 |
31 |
413 |
44 |
|
Denmark |
458 |
29 |
406 |
23 |
|
Germany |
410 |
22 |
365 |
23 |
|
England |
409 |
29 |
359 |
21 |
|
Norway |
387 |
25 |
336 |
26 |
|
Sweden |
379 |
19 |
333 |
26 |
|
Canada |
372 |
23 |
318 |
31 |
|
France |
369 |
21 |
313 |
35 |
|
Italy |
339 |
15 |
304 |
20 |
|
Japan |
319 |
34 |
244 |
40 |
|
Russia |
967 |
74 |
790 |
103 |
Source: World Health Statistic 201. World Health Organization, 2014 , pp. 72–87.
Table 2. Structure of mortality from the main classes of death causes in Russia (deaths per 100 thousand population)
|
Main classes of death causes |
1990 |
2000 |
2005 |
2010 |
2011 |
2012 |
2013 |
2013 to …, |
% |
|
|
1990 |
2000 |
2012 |
||||||||
|
Deaths from all causes |
1119.1 |
1529.0 |
1609.9 |
1419.2 |
1347.0 |
1331.2 |
1304.3 |
116.5 |
85.3 |
98.0 |
|
Diseases of the circulatory system |
618.7 |
846.1 |
908.0 |
805.9 |
753.0 |
737.1 |
698.1 |
112.8 |
82.5 |
94.7 |
|
Neoplasms |
194.4 |
204.7 |
201.2 |
205.1 |
204.6 |
203.1 |
203.3 |
104.6 |
99.3 |
100.1 |
|
External causes, of them: |
134.0 |
219.0 |
220.7 |
151.7 |
139.4 |
135.3 |
129.2 |
96.4 |
59.0 |
95.5 |
|
- transport accidents |
29.2 |
27.2 |
28.1 |
20.0 |
20.7 |
21.1 |
20.3 |
69.5 |
74.6 |
96.2 |
|
- suicide |
26.5 |
39.1 |
32.2 |
23.4 |
21.8 |
20.8 |
20.1 |
75.8 |
51.4 |
96.6 |
|
- accidental poisoning by alcohol |
10.9 |
25.6 |
28.6 |
13.4 |
11.4 |
10.6 |
10.1 |
92.7 |
39.5 |
95.3 |
|
- murder |
14.3 |
28.2 |
24.9 |
13.3 |
11.7 |
10.8 |
10.1 |
70.6 |
35.8 |
93.5 |
|
Diseases of the digestive system |
28.7 |
44.4 |
65.5 |
64.4 |
62.2 |
62.1 |
61.6 |
214.6 |
138.7 |
99.2 |
|
Diseases of the respiratory system |
59.4 |
70.2 |
66.2 |
52.3 |
51.9 |
51.6 |
51.6 |
86.9 |
73.5 |
100.0 |
* Ranked by mortality from various causes in the Russian Federation in 2013.
Source: Federal’naya sluzhba gosudarstvennoi statistiki [Federal State Statistics Service of the Russian Federation]. Available at:
Table 3. Dynamics of mortality of the working-age population (15–60 years) in the world leading countries, 1960–2012 (deaths per 100 thousand population)
|
Country |
1960 |
1970 |
1980 |
1990 |
2000 |
2012 |
2012 to …, % |
|||||||||
|
Men |
Women |
Men |
Women |
Men |
Women |
Men |
Women |
Men |
Women |
Men |
Women |
Men |
Women |
Men |
Women |
|
|
World |
383 |
298 |
283 |
225 |
254 |
184 |
232 |
161 |
220 |
152 |
194 |
138 |
83.6 |
85.7 |
88.2 |
90.8 |
|
USA |
233 |
131 |
237 |
128 |
195 |
103 |
172 |
91 |
144 |
83 |
130 |
77 |
75.6 |
84.6 |
90.3 |
92.8 |
|
England |
186 |
109 |
180 |
107 |
162 |
97 |
129 |
78 |
108 |
68 |
90 |
56 |
69.8 |
71.8 |
83.3 |
82.4 |
|
Sweden |
141 |
95 |
140 |
84 |
142 |
76 |
114 |
66 |
87 |
56 |
68 |
44 |
59.6 |
66.7 |
78.2 |
78.6 |
|
Canada |
193 |
110 |
187 |
103 |
164 |
86 |
127 |
70 |
101 |
61 |
68 |
52 |
53.5 |
74.3 |
67.3 |
85.2 |
|
Denmark |
151 |
106 |
159 |
104 |
167 |
106 |
155 |
101 |
126 |
79 |
102 |
61 |
65.8 |
60.4 |
81.0 |
77.2 |
|
Norway |
142 |
82 |
158 |
76 |
146 |
67 |
132 |
68 |
107 |
61 |
73 |
44 |
55.3 |
64.7 |
68.2 |
72.1 |
|
France |
217 |
115 |
204 |
101 |
196 |
85 |
168 |
69 |
138 |
61 |
109 |
52 |
64.9 |
75.4 |
79.0 |
85.2 |
|
Italy |
189 |
109 |
176 |
95 |
165 |
77 |
131 |
61 |
101 |
51 |
70 |
39 |
53.4 |
63.9 |
69.3 |
76.5 |
|
Germany |
No data |
No data |
No data |
No data |
No data |
No data |
158 |
77 |
124 |
63 |
94 |
50 |
59.5 |
64.9 |
75.8 |
79.4 |
|
Japan |
217 |
149 |
173 |
104 |
130 |
69 |
109 |
53 |
98 |
48 |
82 |
43 |
75.2 |
81.1 |
83.7 |
89.6 |
|
Russia |
277 |
127 |
313 |
123 |
362 |
135 |
316 |
116 |
443 |
159 |
339 |
127 |
107.3 |
109.5 |
76.5 |
79.9 |
Source: World Development Indicators. The World Bank. Available at:
Table 4. Demographic and socio-economic losses from the main classes of death causes of the able-bodied population in Russia and the Vologda Oblast in 2013
|
Classes of death causes |
PYLL, persons-years |
PYLL in % of total losses |
Loss of profit in the production of GRP, rubles* |
Loss in % of GRP** |
||||
|
RF |
VО |
RF |
VО |
RF |
VО |
RF |
VО |
|
|
All death causes |
10,003,450 |
122,157 |
100 |
100 |
3,765,128.5 |
34,878.6 |
6.97 |
10.22 |
|
External causes |
3,511,963 |
32,471 |
35.1 |
26.6 |
1,321,843.2 |
9,271.2 |
2.45 |
2.72 |
|
Diseases of the circulatory system |
2,464,329 |
22,452 |
24.6 |
18.4 |
927,531.5 |
6,410.6 |
1.72 |
1.88 |
|
Neoplasms |
1,186,930 |
10,908 |
11.9 |
8.9 |
446,740.3 |
3,114.5 |
0.83 |
0.91 |
|
Diseases of the digestive system |
802,195 |
12 204 |
8.0 |
10.0 |
301,932.6 |
3,484.5 |
0.56 |
1.02 |
|
Infectious and parasitic diseases |
668,001 |
2,068 |
6.7 |
1.7 |
251,424.2 |
590.5 |
0.47 |
0.17 |
|
Diseases of the respiratory system |
454,377 |
3,970 |
4.5 |
3.2 |
171,019.8 |
1,133.5 |
0.32 |
0.33 |
* GRP per capita.
** GRP at basic prices.
Table 5. Losses of PYLL and GRP among men and women of working age in the Vologda Oblast in 2013
|
Classes of death causes |
Men |
Women |
||||
|
PYLL, persons-years |
Loss (million rubles)* |
Loss in % of GRP** |
PYLL, persons-years |
Loss (million rubles)* |
Loss in % of GRP** |
|
|
All death causes |
93,503 |
26,697.2 |
7.82 |
28,654 |
8,181.4 |
2.40 |
|
External causes, |
26,395 |
7,536.4 |
2.21 |
6,076 |
1,734.8 |
0.51 |
|
including: |
3,634 |
1,037.6 |
0.30 |
1,061 |
302.9 |
0.09 |
|
- transport accidents |
4,166 |
1,189.5 |
0.35 |
1,122 |
320.3 |
0.09 |
|
- suicide |
2,457 |
701.5 |
0.21 |
571 |
163.0 |
0.05 |
|
- accidental poisoning by alcohol |
1,727 |
493.1 |
0.14 |
449 |
128.2 |
0.04 |
|
- murder |
17,302 |
4,940.1 |
1.45 |
5,150 |
1,470.4 |
0.43 |
|
Diseases of the circulatory system |
7,062 |
2,016.4 |
0.59 |
3,679 |
1,050.4 |
0.31 |
|
Diseases of the digestive system |
5,805 |
1,657.5 |
0.49 |
5,103 |
1,457.0 |
0.43 |
|
Neoplasms |
3,206 |
915.4 |
0.27 |
764 |
218.1 |
0.06 |
|
Diseases of the respiratory system |
1,663 |
474.8 |
0.14 |
405 |
115.6 |
0.03 |
|
* GRP per capita. ** GRP at basic prices. |
||||||
Table 6. PYLL from the main classes of death causes in different age groups of the working population in Russia and the Vologda Oblast in 2013 (years)
|
Classes of death causes |
15-19 |
20-24 |
25-29 |
30-34 |
35-39 |
40-44 |
45-49 |
50-54 |
55-59 |
|
Absolute/ in % |
Absolute/ in % |
Absolute/ in % |
Absolute/ in % |
Absolute/ in % |
Absolute/ in % |
Absolute/ in % |
Absolute/ in % |
Absolute/ in % |
|
|
Russian Federation |
|||||||||
|
All death causes |
262,080 / 100 |
656,137 / 100 |
1,125,712 / 100 |
1,460,844 / 100 |
1,424,080 / 100 |
1,235,031 / 100 |
1,221,966 / 100 |
1,446,640 / 100 |
1,170,960 / 100 |
|
External causes |
190,752 / 72.8 |
464,615 / 70.8 |
634,106 / 56.3 |
635,085 / 43.5 |
524,664 / 36.8 |
372,807 / 30.2 |
293,472 / 24.0 |
255,502 / 17.7 |
140,960 / 12.0 |
|
Diseases of the circulatory system |
14,400 / 5.5 |
45,408 / 6.9 |
117,078 / 10.4 |
211,926 / 14.5 |
282,576 / 19.8 |
334,535 / 27.1 |
407,790 / 33.4 |
550,056 / 38.0 |
500,560 / 42.7 |
|
Diseases of the digestive system |
2,496 / 1.0 |
14,706 / 2.2 |
63,536 / 5.6 |
123,849 / 8.5 |
144,256 / 10.1 |
127,236 / 10.3 |
117,414 / 9.6 |
120,614 / 8.3 |
88,088 / 7.5 |
|
Neoplasms |
14,736 / 5.6 |
29,713 / 4.5 |
48,488 / 4.3 |
74,217 / 5.1 |
102,340 / 7.2 |
137,747 / 11.2 |
188,604 / 15.4 |
302,445 / 20.9 |
288,640 / 24.6 |
|
Diseases of the respiratory system |
6,384 / 2.4 |
14,792 / 2.3 |
41,572 / 3.7 |
66,066 / 4.5 |
74,424 / 5.2 |
64,722 / 5.2 |
60,606 / 5.0 |
71,331 / 4.9 |
54,480 / 4.7 |
|
Infectious and parasitic diseases |
3,216 / 1.2 |
24,768 / 3.8 |
104,006 / 9.2 |
193,314 / 13.2 |
150,276 / 10.6 |
83,398 / 6.8 |
50,778 / 4.2 |
38,285 / 2.6 |
19,960 / 1.7 |
|
Vologda Oblast |
|||||||||
|
All death causes |
2,304 / 100 |
8,944 / 100 |
14,668 / 100 |
16,731 / 100 |
14,896 / 100 |
15,318 / 100 |
15,948 / 100 |
18,668 / 100 |
14,680 / 100 |
|
External causes |
816 / 35.4 |
3,741 / 41.8 |
5,662 / 38.6 |
5,610 / 33.5 |
4,284 / 28.8 |
4,094 / 26.7 |
3,384 / 21.2 |
3,328 / 17.8 |
1,552 / 10.6 |
|
Diseases of the circulatory system |
240 / 10.4 |
344 / 3.8 |
684 / 4.7 |
1,221 / 7.3 |
1,596 / 10.7 |
2,484 / 16.2 |
3,996 / 25.1 |
5,863 / 31.4 |
6,024 / 41.0 |
|
Diseases of the digestive system |
0 / 0 |
172 / 1.9 |
798 / 5.4 |
1,914 / 11.4 |
2,212 / 14.8 |
2,093 / 13.7 |
1,836 / 11.5 |
1,651 / 8.8 |
1,528 / 10.4 |
|
Neoplasms |
96 / 4.2 |
215 / 2.4 |
532 / 3.6 |
528 / 3.2 |
896 / 6.0 |
1,357 / 8.9 |
1,890 / 11.9 |
2,626 / 14.1 |
2,768 / 18.9 |
|
Diseases of the respiratory system |
48 / 2.1 |
86 / 1.0 |
380 / 2.6 |
660 / 3.9 |
532 / 3.6 |
391 / 2.6 |
540 / 3.4 |
741 / 4.0 |
592 / 4.0 |
|
Infectious and parasitic diseases |
0 / 0 |
215 / 2.4 |
342 / 2.3 |
495 / 3.0 |
308 / 2.1 |
92 / 0.6 |
252 / 1.6 |
260 / 1.4 |
104 / 0.7 |
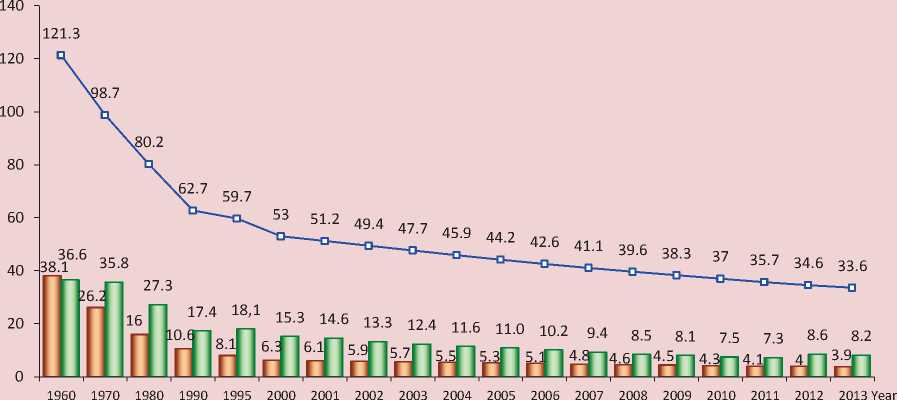
Figure 2. Dynamics of infant mortality in the world, the EU and Russia in 1960–2013, (died under the age of 12 months per 1 thousand live births)
World I----1 European Union ■ —I Russia
Sources: World Development Indicators. The World Bank. Available at: variableSelection/; DataFinder. Population Reference Bureau. Available at:
Figure 3. Dynamics of life expectancy at birth in the world, the EU and in Russia, 1960–2013, years
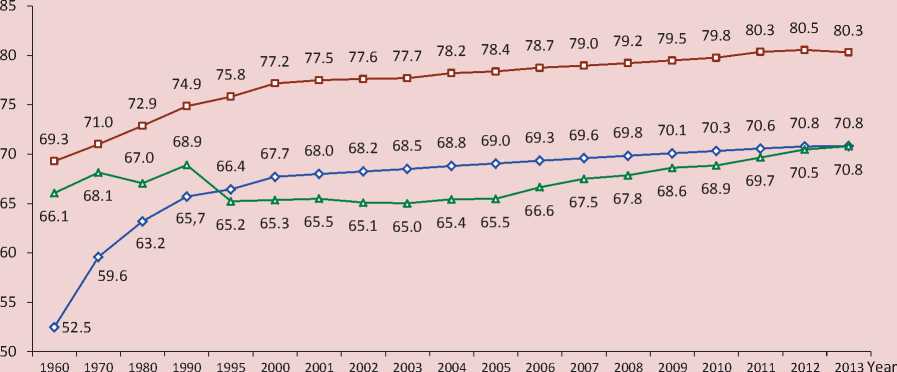
World European Union —±— Russia
Sources: World Development Indicators. The World Bank. Available at: variableSelection/; DataFinder. Population Reference Bureau. Available at:
Figure 4. Gender gap in life expectancy in the world, the EU and Russia* (years)
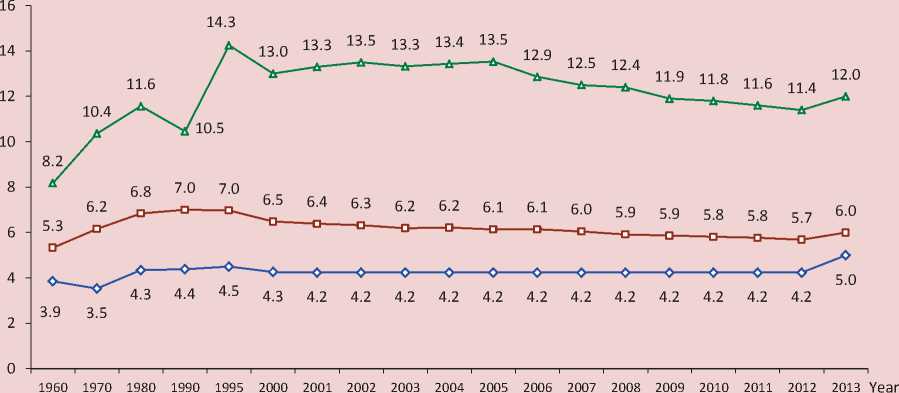
World European Union —д Russia
* Calculated by the author on the basis of data from the World Bank and the Population Reference Bureau.
Sources: World Development Indicators. The World Bank. Available at: variableSelection/; DataFinder. Population Reference Bureau. Available at:
In the structure of mortality of the Russian population the first place is occupied by diseases of the circulatory system (53.5%), the second place – by neoplasms (15.6%) and the third – external causes (9.9%; see tab. 2). Among external causes of death the first place belongs to transport accidents, the second – to suicide, the third – accidental poisoning and murder ( tab. 2 ). The number of deaths from these causes amounts to more than 50% of the total number of deaths from all external causes [11, p. 10].
The Russian model of mortality is characterized by an extremely high mortality rate of the working-age population, especially of men, in comparison with similar indicators in the developed countries: in Russia in 2012 the mortality rate of men of working age was 4 times higher than in
the mentioned countries and by 2 times more than in the world. The mortality rate of women in our country is slightly below the world level, but exceeds the average for economically developed countries ( tab. 3 ).
The excess of premature mortality of men over mortality of women is a trend observed in many countries, including developed ones, but in Russia this indicator has reached values that are unprecedentedly high and threaten the national security. Thus, according to the latest World Bank data, in our country as of 2013 the probability of survival until the age of 65 among men is by 30% lower than among women (49% vs. 79%), whereas in the EU countries and the world the gap is much lower – 8% [20].
The high mortality rate of the workingage population is a consequence and
reflection of complex social problems in Russia at the present stage of development. These include: low level of living, alcoholism, non-compliance with the established norms of working conditions and high rates of occupational injury [16, p. 56]. In addition, excess mortality of working age citizens poses a direct and serious economic threat, as together with a lack of innovative-technological development of the country leads to lower productivity [8].
There is an integral characteristic of demographic losses from premature mortality of the population, such as PYLL (Potential Years of Life Lost), suggested by the World Health Organization. It describes the scale of premature mortality and is calculated as the sum of products of the
deaths number in each age group and the number of years a person has not lived until the age of life expectancy:
PYLL = 2 Di x ai, where D is a number of deaths in the i-th age group, ai is a number of years of life lost, ai = T – xi , where T is an upper age limit, until which life lost is calculated (i.e. age, before reaching which all deaths are considered as premature), xi is a midpoint of the i-th age interval [8].
To assess mortality of the working-age population we, according to the WHO recommendations, consider the age of 65 as the upper age limit. The PYLL calculation is carried out within the relevant five-year age groups from age 15. To express losses in terms of economic units each lost year is
multiplied by the average per capita GRP of the studied year, i.e. the value of PYLL is assessed through premature mortality of the working-age population:
Pt = PYLLt x Ct , where Pt is cost of PYLL resulting from mortality in t year, PYLLt is a number of manyears lost due to premature mortality in t year, Ct is cost of a year of statistical life in t year [8].
It is possible to carry out the most complete and in-depth analysis of demographic and socio-economic losses from different classes of death causes due to regional statistics, as it contains all the necessary information on mortality by gender and five-year age groups. In this regard, the assessment of losses due to mortality of the working population is conducted on the example of the Vologda Oblast in comparison with the national average.
The performed calculations show that external causes of mortality ( tab. 4 ) make the greatest contribution to demographic losses of the country and the region, as they constitute 35 and 27% of the total PYLL, respectively. Diseases of the circulatory system comprise a significant share of losses – 25% in Russia and 18% in the Vologda Oblast. The greatest amount of lost social and economic benefits in the country and the region is identified for mortality from external causes – 2.45 and 2.7% of the total GRP, respectively.
When considering the demographic and socio-economic losses due to mortality of the working-age population from different classes of death causes, significant gender differences in its scale attract attention. So, among men total losses of PYLL and GRP from all death causes are by 3 times higher than among women, from external causes of death – 4 times. Suicide and transport accidents bring most losses ( tab. 5 ).
The highest losses of PYLL from external causes of death are observed in the youngest age groups (under working age) – 15–19 and 20–24 years: in Russia – more than 70% of the total losses of PYLL, in the Vologda Oblast – 35–40%, respectively. In the older age groups the maximum losses are caused by mortality from diseases of the circulatory system: in the country PYLL from this class of death causes reach 38% of the casualties in the age of 50–54 and 43% – in the age of 55–59. In the Vologda Oblast these losses account for 31 and 41%, respectively ( tab. 6 ).
To assess the overall picture of mortality it is significant to consider the indicator, such as infant mortality. Speaking about the dynamics of this indicator in Russia, it is
worth noting that it decreased by 4 times in 1960–2013. Throughout the review period, the excess of infant mortality in our country over the EU countries declined from 3 to 2 times ( fig. 2 ). However, if we analyze the successes in detail, we find them not so significant. So, in 2012 the infant mortality rate grew by 18% compared to 2011. This increase is associated with Russia’s transition to the use of new definition of dead-live birth since April, 2012 [7, p. 280]. It brought our country close to the indicator of live-birth suggested by the WHO. In addition, in 2014 the Russian Federation ranked the 160th by infant mortality [18] (7.1 of the died under the age of 12 months per 1 thousand live births) of 224 possible, being close to Chile and Kuwait.
High mortality from external causes largely determines the dynamics of life expectancy of the population. In 1960– 2013 this indicator in the world grew by 18 years, in the EU – 1 1 years, reaching 71 and 80 years, respectively. The most substantial growth in life expectancy was observed until the early 2000s, then there was a slight decreased in the rate ( fig. 3 ).
In 1960–2013 life expectancy of the population in Russia increased insignificantly – by 5 years. Unlike most developed countries, where over the last decades life expectancy increased steadily and quickly, in our country its level varied markedly: the decrease mainly coincided with the periods of serious financial and socio-economic shocks.
The minimum value of life expectancy (64 years) was recorded in 1994. Since 2003 life expectancy of the population had grown and in 2013 it amounted to 70.8 years. This value is comparable to the global rate and is lower by 10 years than in the EU ( fig. 3 ).
Speaking of gender differences in the life expectancy level, we should note that the gap between men and women amounts to 12 years in Russia, whereas in the world and the EU countries it is about 4 –6 years. The greatest gap in life expectancy of men and women in our country peaked in 1995 (14.3 years; fig. 4 ).
Besides, in the Russian mortality model the indicators vary by regions. In 2013 in 52 RF subjects the crude mortality rate exceeded the national average (13‰), for comparison: in 2000 there were 37 such subjects. The totality of RF regions by crude mortality rate can be divided into 5 groups1: regions with low (below 10‰), below average (10– 12‰), average (12–14‰), above average (14–16‰) and high (above 16‰) mortality ( tab. 7 ).
Table 7. Distribution of RF subjects by crude mortality rate in 2013
Low (<10.0‰) Below average (10.0–12.0‰) Average (12.0–14.0 ‰) Above average (14.0–16.0‰) High (>16.0‰) Republic of Ingushetia (3.5), Chechen Republic (4.9), Yamalo-Nenets Autonomous Okrug (5.1), Republic of Dagestan (5.5), Khanty-Mansi Autonomous Okrug (6.3), Tyumen Oblast (8.2), Sakha (Yakutia) Republic (8.7), Kabardino-Balkar Republic (9.0), Karachay-Cherkess Republic (9.5), Moscow(9.6), Republic of Kalmykia (9.9) Republic of North Ossetia-Alania, Chukotka Autonomous Okrug (10.5), Nenets Autonomous Okrug (10.7); Tuva Republic (10.9), Murmansk Oblast (11), Altai Republic (11.3), Kamchatka Krai (11.4), Tomsk Oblast, Stavropol Krai (11.7), Republic of Buryatia (11.8), Magadan Oblast and Saint Petersburg (11.9) Komi Republic (12.0), Republic of Tatarstan (12.1), Astrakhan Oblast (12.2), Zabaykalsky Krai (12.5), Udmurt Republic, Krasnoyarsk Krai (12.7), Krasnodar Krai (12.8), Republic of Bashkortostan, Chuvash Republic, Republic of Khakassia, Sakhalin Oblast, Kaliningrad Oblast, Republic of Adygea (13.1), Khabarovsk Krai, Arkhangelsk Oblast (13.3), Novosibirsk Oblast, Omsk Oblast (13.4) Primorsky Krai, Volgograd Oblast (15.5), Irkutsk Oblast (13.6), Mari El Republic, Sverdlovsk Oblast (13.7), Belgorod Oblast, Rostov Oblast (13.8), Orenburg Oblast, Chelyabinsk Oblast, Amur Oblast, Moscow Oblast (13.9) Perm Oblast (14.0), Altai Krai (14.2), Samara Oblast (14.3), Ulyanovsk Oblast, Leningrad Oblast (14.4), Kemerovo Oblast (14.5), Jewish Autonomous Oblast, Republic of Karelia (14.6), Penza Oblast (14.7), Republic of Mordovia (14.8), Vologda Oblast (15.0), Kaluga Oblast, Lipetsk Oblast (15.2), Kirov Oblast (15.4), Voronezh Oblast (15.5), Ryazan Oblast, Yaroslavl Oblast (15.8), Nizhny Novgorod Oblast, Bryansk Oblast (15.9) Kostroma Oblast, Kursk Oblast, Tambov Oblast n, Kurgan Oblast (16.1), Orel Oblast n (16.2), Ivanovo Oblast (16.3), Smolensk Oblast (16,4), Vladimir Oblast (16.7), Tula Oblast (17,4), Novgorod Oblast (17.8), Tver Oblast (18,0), Pskov Oblast (18.6) 11 subjects 12 subjects 28 subjects 19 subjects 12 subjects Source: Federal’naya sluzhba gosudarstvennoi statistiki [Federal State Statistics Service of the Russian Federation]. Available at:
The lowest mortality rate is characteristic of 11 RF subjects (predominantly of the North Caucasian Federal district), the below average rate – 12, the average rate – 28 (including the Vologda Oblast), the high rate – 12.
The mortality structure of macroregions generally follows the nationwide (see tab. 2); among federal districts the Northwestern Federal district is in the lead by mortality from circulatory diseases and neoplasms (57% and 17%, respectively), the Far Eastern Federal district – from
external causes and diseases of the digestive system (13.5 and 6%, respectively) and the Siberian Federal district – from diseases of the respiratory system (5%; fig. 5 ).
The gender gap in mortality rates of the working-age population declined in all macro-regions of Russia in 2000–2013. In 2013 the Far Eastern Federal district was the leader in mortality among men and women of working age (1017.4 and 315.7 deaths per 1 thousand population, respectively); the minimum value was observed in the North-Caucasian Federal district (473.1 and
Figure 5. Structure of mortality from most common classes of death causes in RF federal districts of Russia in 2013* (in % of the total mortality)
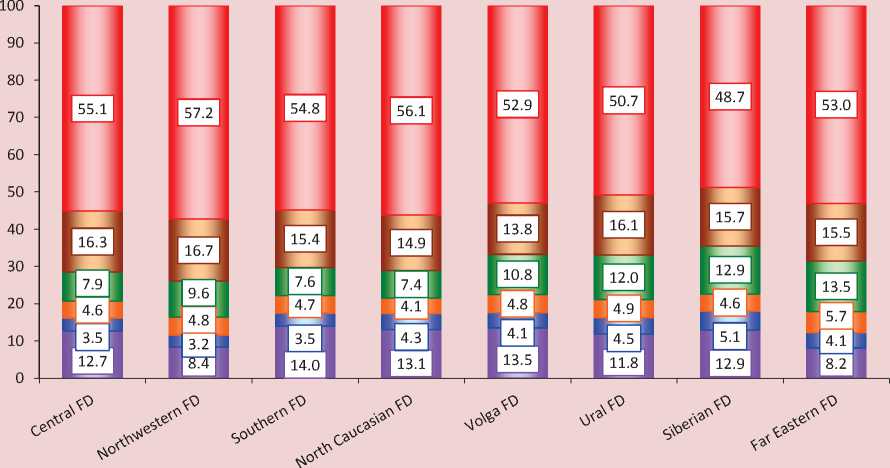
□ Other causes □ Diseases of the respiratory system
□ Diseases of the digestive system □ External causes
□ Neoplasms □ Diseases of the circulatory system
* Calculated by the author on the basis of data of the Federal State Statistics Service of the Russian Federation.
124.7 deaths per 1 thousand population, respectively). However, the greatest gender difference in the value of this indicator was observed in the Central Federal district and Volga Federal district (by 3.83 times).
Considering the Northwestern Federal district, we should emphasize that the maximum mortality rate among ablebodied men is recorded in the Novgorod Oblast (1257.5 deaths per 1 thousand population) and among women – in the Pskov Oblast (341.4 deaths per 1 thousand populations). The most favorable
situation, characterized by the lowest levels of mortality of able-bodied citizens, is observed in Saint Petersburg ( tab. 8 ).
The infant mortality rate also declined in all RF regions over the period. However, in relation to the 2010 level there is an increase in this indicator in each federal district ( tab. 9 ) due to the changed system of birth registration. Among the regions of the Northwestern Federal district the most disadvantaged situation was formed in the Vologda Oblast in 2013 (10.1 deaths per 1 thousand live births). The lowest value
Table 8. Mortality among the working-age population in federal districts of Russia in 2000 and 2013* (deaths per 100 thousand population)
|
Territory |
2000. |
2013 |
2013 to 2000, in % |
|||||
|
Men |
Women |
Gender gap in MRw-a **, times |
Men |
Women |
Gender gap in MRw-a **, times |
Men |
Women |
|
|
Central FD |
1,213.4 |
293.0 |
4.14 |
810.2 |
211.5 |
3.83 |
66.8 |
72.2 |
|
Northwestern FD |
1,260.4 |
346.3 |
3.64 |
850.3 |
248.0 |
3.43 |
67.5 |
71.6 |
|
Republic of Karelia |
1,345.0 |
372.3 |
3.61 |
1,103.5 |
310.6 |
3.55 |
82.0 |
83.4 |
|
Komi Republic |
1,089.3 |
328.7 |
3.31 |
1,050.4 |
271.6 |
3.87 |
96.4 |
82.6 |
|
Arkhangelsk Oblast |
1,361.1 |
351.2 |
3.88 |
964.0 |
242.9 |
3.97 |
70.8 |
69.2 |
|
Vologda Oblast |
1,134.8 |
256.2 |
4.43 |
1,031.7 |
253.0 |
4.08 |
90.9 |
98.8 |
|
Kaliningrad Oblast |
1,234.9 |
373.6 |
3.31 |
826.4 |
268.9 |
3.07 |
66.9 |
72.0 |
|
Leningrad Oblast |
1,495.6 |
412.4 |
3.63 |
914.1 |
291.3 |
3.14 |
61.1 |
70.6 |
|
Murmansk Oblast |
1,063.0 |
292.6 |
3.63 |
822.4 |
270.8 |
3.04 |
77.4 |
92.5 |
|
Novgorod Oblast |
1,477.8 |
344.5 |
4.29 |
1,257.5 |
315.7 |
3.98 |
85.1 |
91.6 |
|
Pskov Oblast |
1,519.8 |
423.4 |
3.59 |
1,135.1 |
341.4 |
3.32 |
74.7 |
80.6 |
|
Saint Petersburg |
1,187.4 |
340.7 |
3.49 |
619.1 |
197.2 |
3.14 |
52.1 |
57.9 |
|
Southern FD |
938.8 |
238.4 |
3.94 |
759.5 |
207.7 |
3.66 |
80.9 |
87.1 |
|
North Caucasian FD |
No data |
No data |
- |
473.1 |
124.7 |
3.79 |
- |
- |
|
Volga FD |
1,125.7 |
272.3 |
4.13 |
959.1 |
250.5 |
3.83 |
85.2 |
92.0 |
|
Ural FD |
1,151.9 |
298.6 |
3.86 |
904.0 |
250.0 |
3.62 |
78.5 |
83.7 |
|
Siberian FD |
1,196.7 |
354.9 |
3.37 |
1,012.1 |
302.4 |
3.35 |
84.6 |
85.2 |
|
Far Eastern FD |
1,139.4 |
335.2 |
3.40 |
1,017.4 |
315.7 |
3.22 |
89.3 |
94.2 |
Table 9. Dynamics of infant mortality in the federal districts of Russia in 1998*–2013 (died under the age of 12 months per 1 thousand live births)
|
Territory |
1998 |
2000 |
2005 |
2010 |
2011 |
2012 |
2013 |
2013 to…, % |
||
|
2000 |
2010 |
2012 |
||||||||
|
Central FD |
15.0 |
13.6 |
10.0 |
6.6 |
6.5 |
7.8 |
7.6 |
55.9 |
115.2 |
97.4 |
|
Northwestern FD |
14.0 |
12.8 |
9.4 |
5.6 |
5.4 |
6.2 |
6.2 |
48.4 |
110.7 |
100.0 |
|
Republic of Karelia |
15.3 |
14.4 |
9.6 |
4.9 |
5.6 |
7.6 |
6.4 |
44.4 |
130.6 |
84.2 |
|
Komi Republic |
16.9 |
13.0 |
8.7 |
5.0 |
4.4 |
5.9 |
6.0 |
46.2 |
120.0 |
101.7 |
|
Arkhangelsk Oblast |
13.9 |
14.1 |
12.6 |
6.8 |
6.9 |
7.1 |
7.7 |
54.6 |
113.2 |
108.5 |
|
Vologda Oblast |
16.6 |
16.0 |
11.6 |
7.4 |
6.5 |
8.4 |
10.1 |
63.1 |
136.5 |
120.2 |
|
Kaliningrad Oblast |
17.5 |
19.6 |
11.3 |
4.5 |
4.5 |
5.6 |
6.5 |
33.2 |
144.4 |
116.1 |
|
Leningrad Oblast |
9.9 |
10.3 |
9.8 |
6.0 |
5.4 |
6.1 |
5.8 |
56.3 |
96.7 |
95.1 |
|
Murmansk Oblast |
11.8 |
12.5 |
11.2 |
5.3 |
8.6 |
6.6 |
6.2 |
49.6 |
117.0 |
93.9 |
|
Novgorod Oblast |
16.9 |
14.0 |
9.7 |
7.2 |
7.7 |
8.2 |
8.5 |
60.7 |
118.1 |
103.7 |
|
Pskov Oblast |
19.9 |
15.1 |
12.8 |
7.9 |
6.1 |
10.0 |
7.7 |
51.0 |
97.5 |
77.0 |
|
Saint Petersburg |
11.4 |
10.7 |
6.0 |
4.7 |
4.3 |
4.5 |
4.4 |
41.1 |
93.6 |
97.8 |
|
Southern FD |
18.7 |
16.9 |
12.2 |
7.1 |
7.1 |
8.4 |
7.9 |
46.7 |
111.3 |
94.0 |
|
North Caucasian FD |
No data |
No data |
No data |
12.0 |
13.0 |
14.6 |
12.2 |
- |
101.7 |
83.6 |
|
Volga FD |
15.9 |
14.4 |
10.5 |
6.8 |
6.3 |
7.7 |
7.5 |
52.1 |
110.3 |
97.4 |
|
Ural FD |
15.0 |
15.4 |
10.0 |
6.7 |
6.6 |
7.5 |
7.4 |
48.1 |
110.4 |
98.7 |
|
Siberian FD |
18.1 |
17.6 |
12.3 |
8.4 |
7.8 |
9.4 |
8.5 |
48.3 |
101.2 |
90.4 |
|
Far Eastern FD |
20.1 |
18.6 |
13.5 |
9.6 |
9.1 |
10.9 |
11.0 |
59.1 |
114.6 |
100.9 |
* Statistical data by RF federal districts has been collected since 1998.
Source: Federal’naya sluzhba gosudarstvennoi statistiki [Federal State Statistics Service of the Russian Federation]. Available at:
Thus, the development of epidemiological transition in Russia has the following distinctive features: delay of the main stages in comparison with developed countries of the world and Europe, implementation of an accelerated transition model and layering of unresolved problems of previous stages. This is reflected in higher mortality rates than in developed countries due to mortality of the working-age population from external causes and, as a consequence, significant socio-demographic and economic losses
from it, as well as in substantial regional differentiation of mortality rates within the country.
As mortality of the working age population, especially among men, is a characteristic feature of the Russian mortality model in the conditions of incomplete epidemiological transition , reducing its level is one of the priorities of the state social policy stipulated in the leading conceptual and normative documents of Russia. The country is implementing federal and regional prog-
Table 10. Life expectancy of the population in federal districts of Russia in 1990-2013, years
|
Territory |
1990 |
2000 |
2005 |
2010. |
2011 |
2012. |
2013 |
2013 to… |
||
|
1990 |
2000 |
2012. |
||||||||
|
Central FD |
69.5 |
66.1 |
66.5 |
69.9 |
71.2 |
71.4 |
71.9 |
103.5 |
108.8 |
100.7 |
|
Northwestern FD |
69.1 |
64.5 |
64.2 |
68.9 |
70.1 |
70.6 |
71.3 |
103.2 |
110.5 |
101.0 |
|
Republic of Karelia |
68.8 |
62.9 |
61.8 |
66.4 |
68.0 |
68.0 |
69.2 |
100.6 |
110.0 |
101.8 |
|
Komi Republic |
68.2 |
63.5 |
62.1 |
66.9 |
68.0 |
68.3 |
69.3 |
101.6 |
109.1 |
101.5 |
|
Arkhangelsk Oblast |
69.1 |
62.8 |
63.0 |
67.9 |
68.8 |
69.7 |
70.2 |
101.6 |
111.8 |
100.7 |
|
Vologda Oblast |
69.3 |
65.7 |
63.2 |
67.1 |
68.4 |
69.2 |
69.4 |
100.1 |
105.6 |
100.3 |
|
Kaliningrad Oblast |
68.7 |
63.6 |
61.5 |
68.8 |
69.9 |
70.1 |
70.5 |
102.6 |
110.8 |
100.6 |
|
Leningrad Oblast |
68.3 |
63.0 |
62.4 |
68.1 |
69.4 |
69.8 |
70.4 |
103.1 |
111.7 |
100.9 |
|
Murmansk Oblast |
70.2 |
64.5 |
63.8 |
68.4 |
68.9 |
69.8 |
70.5 |
100.4 |
109.3 |
101.0 |
|
Novgorod Oblast |
67.6 |
62.8 |
61.8 |
65.0 |
66.5 |
67.6 |
67.7 |
100.1 |
107.8 |
100.1 |
|
Pskov Oblast |
68.1 |
61.9 |
60.2 |
64.6 |
66.5 |
66.5 |
67.8 |
99.6 |
109.5 |
102.0 |
|
Saint Petersburg |
69.7 |
66.7 |
68.0 |
72.1 |
73.1 |
73.4 |
74.2 |
106.5 |
111.2 |
101.1 |
|
Southern FD |
69.7 |
67.3 |
68.1 |
70.1 |
70.7 |
71.3 |
71.8 |
103.0 |
106.7 |
100.7 |
|
North Caucasian FD |
No data |
No data |
69.9 |
72.2 |
72.6 |
73.2 |
74.0 |
- |
- |
101.1 |
|
Volga FD |
69.9 |
65.5 |
65.3 |
68.4 |
69.2 |
69.2 |
70.1 |
100.3 |
107.0 |
101.3 |
|
Ural FD |
69.4 |
64.6 |
65.2 |
68.8 |
69.4 |
69.7 |
70.1 |
101.0 |
108.5 |
100.6 |
|
Siberian FD |
67.9 |
63.7 |
62.7 |
67.1 |
67.7 |
68.0 |
68.6 |
101.0 |
107.7 |
100.9 |
|
Far Eastern FD |
67.2 |
63.2 |
62.2 |
65.8 |
66.4 |
67.0 |
67.8 |
100.9 |
107.3 |
101.2 |
Source: Federal’naya sluzhba gosudarstvennoi statistiki [Federal State Statistics Service of the Russian Federation]. Available at: rams of health care development; much attention is given to the reduction of mortality from road traffic accidents and alcohol consumption, as the alcohol factor contributes significantly to premature mortality, especially among men [17]. At the same time, these documents contain neither target indicators characterizing mortality of the working-age population, nor means for achieving them [13, p. 92]. They do not address the problem of high production traumatism as a factor of disability and subsequent premature death. In Russia in 2013 more than 36 thousand
people suffered from production accidents with disability for 1 day and 1.7 thousand people died because of them. In our opinion, as the rate of industrial accidents is extremely high, it is necessary to take preventive measures, such as:
– creation of special rooms or corners at enterprises devoted to prevention of accidents and occupational diseases;
– promotion of safety measures in the workplace by means of systematic lectures, talks, briefings with experts in the field of life safety, as well as visual study aids, documentaries, TV shows, etc.;
– briefings with medical staff devoted to provision of first medical aid to victims of industrial accidents.
Given the high mortality rates of the working-age population as a result of road accidents, it is advisable to continue the implementation of regional programs devoted to the prevention of such accidents, particularly designing safer road infrastructure, increasing the availability and improving the quality of care provided
to victims of road accidents [6, pp. 90-91]; to strengthen control over observance of traffic regulations.
There is another direction of improving the system to prevent mortality among the working-age population, such as development and maintenance of positive attitudes to a healthy lifestyle through active involvement of mass media, public organizations, trade unions, authorities and agencies.
References Dynamics of mortality in Russia in the context of the epidemiologic transition concept
- Andreev E.M., Kvasha E.A., Khar'kova T.L. Vozmozhno li snizhenie smertnosti v Rossii? . Demoskop Weekly , 2004, no. 145-146. Available at: http://www.demoscope.ru/weekly/2004/0145/tema01.php
- Vishnevskii A.G., Shkol'nikov V.M. Smertnost' v Rossii. Glavnye gruppy riska i prioritety deistvii . Moscow: Moskovskii Tsentr Karnegi, 1997. 84 p.
- Demograficheskaya modernizatsiya Rossii: 1900-2000 . Under editorship of A.G. Vishnevskii. Moscow: Novoe izdatel'stvo, 2006. 608 p.
- Demograficheskii ezhegodnik Rossii 2014: stat. sbornik . Rosstat . Moscow, 2014. Available at: http://www.gks.ru/bgd/regl/B14_16/Main.htm
- Demograficheskii ezhegodnik Rossii 2002: stat. sbornik . Rosstat . Moscow, 2002. 397 p.
- Korolenko A.V. Osnovnye cherty sovremennogo demograficheskogo krizisa v Rossii i puti ego preodoleniya . Problemy razvitiya territorii , 2014, no. 2 (70), pp. 79-94.
- Naselenie Rossii 2012: dvadtsatyi ezhegodnyi demograficheskii doklad . Executive editor A.G. Vishnevskii. Moscow: Izd. dom Vysshei shkoly ekonomiki, 2014. 412 p.
- Prokhorov B.B., Gorshkova I.V., Shmakov D.I., Tarasova E.V. Obshchestvennoe zdorov'e i ekonomika . Moscow: MAKS Press, 2007. 292 p.
- Omran A. Epidemiologicheskii aspekt teorii estestvennogo dvizheniya naseleniya . Problemy narodonaseleniya. O demograficheskikh problemakh stran Zapada: sb. perevodnykh statei . Moscow: Progress, 1977. 303 p.
- Prokhorov B.B., Gorshkova I.V., Tarasova E.V. Usloviya zhizni naseleniya i obshchestvennoe zdorov'e . Problemy prognozirovaniya , 2003, no. 5, pp. 127-140.
- Rossiya na puti k sovremennoi dinamichnoi i effektivnoi ekonomike: doklad . Under editorship of A.D. Nekipelov, V. V. Ivanter, S.Yu. Glazyev. Moscow: RAN, 2013. 93 p.
- Semenova V.G. Obratnyi epidemiologicheskii perekhod v Rossii . Moscow: TsSP, 2005. 287 p.
- Shabunova A.A., Shakhot'ko L.P., Bobrova A.G., Malanicheva N.A. Smertnost' trudosposobnogo naseleniya Rossii i Belarusi kak ugroza demograficheskomu razvitiyu territorii . Ekonomicheskie i sotsial'nye peremeny: fakty, tendentsii, prognoz , 2012, no. 2 (20), pp. 83-94.
- Federal'naya sluzhba gosudarstvennoi statistiki . Available at: http://www.gks.ru/
- Shabunova A.A. Zdorov'e naseleniya v Rossii: sostoyanie i dinamika . Vologda: ISERT RAN, 2010. 408 p.
- Shabunova A.A., Kalashnikov K.N. Ekonomicheskaya otsenka poter' trudovogo potentsiala naseleniya . Ekonomicheskie i sotsial'nye peremeny: fakty, tendentsii, prognoz , 2008, no. 4 (4), pp. 53-61.
- Yumaguzin V.V., Vinnik M.V. Faktory smertnosti ot vneshnikh prichin i puti ee snizheniya: opyt ekspertnogo interv'yu . Sotsial'nye aspekty zdorov'ya naseleniya . Available at: http://vestnik.mednet.ru/content/view/595/lang,ru/
- The World Factbook. Central Intelligence Agency. Available at: https://www.cia.gov/library/publications/the-world-factbook/
- DataFinder. Population Reference Bureau. Available at: http://www.prb.org/
- World Development Indicators. The World Bank. Available at: http://databank.worldbank.org/data/views/variableSelection/selectvariables.aspx?source=world-development-indicators#
- Global Health Observatory Data Repository. World Health Organization. Available at: http://apps.who.int/gho/data/view.main.680?lang=en
- World Health Statistic 201. World Health Organization, 2014. 177 p.
