E-learning in formal education under forced conditions using SDT and tam

Author: Nandi A., Mehendale S.
Journal: Cardiometry @cardiometry
Section: Original research
Article in issue: 22, 2022.
Free access
This study aims to understand the students’ attitude towards e-learning under the forced environment of the COVID-19 pandemic. This study gives a fresh insight into e-learning, considering the lack of comprehensive research on the influencing variables that impact the user acceptance of e-learning by learners in the Indian Universities during COVID-19 pandemic. The rational model has been constituted based on the Technological Acceptance Model (TAM) and Self-Determination Theory (SDT) to study the effective influence of Autonomy, Relatedness & Competency on the construct of TAM. The result showed significant relations of the self-determination variables with perceived ease of use & perceived usefulness, which further helps us establish a relationship between intrinsic & extrinsic factors of SDT framework with attitude and satisfaction level of Indian University students towards e-learning. This study will assist in bridging the gap between the understanding of organizations and actual factors impacting students’ learning process during the pandemic of COVID-19.
Covid-19 pandemic, e-learning, extrinsic & intrinsic motivation, self-determination theory (sdt), technology acceptance model (tam)
Short address: https://sciup.org/148324605
IDR: 148324605 | DOI: 10.18137/cardiometry.2022.22.268276
Text of the scientific article E-learning in formal education under forced conditions using SDT and tam
Anindita Nandi, Smita Mehendale. E-learning in formal education under forced conditions using SDT and TAM. Cardiom-etry; Issue 22; May 2022; p. 268-276; DOI: 10.18137/cardiom-etry.2022.22.268276; Available from: http://www.cardiometry. net/issues/no22-may-2022/E-learning_formal_education
In recent times, e-learning or Information & Communications Technology (ICT) has increasingly gained 268 | Cardiometry | Issue 22. May 2022
When high motivation is observed in students, they tend to grasp topics in a more consistent manner and achieve higher academic performance. We try to understand the more consistently the need to feel ownership of one’s behavior”), competency (“the need to produce desired outcomes and to experience mastery”) & relatedness (“the need to feel connected to others”) on satisfaction in students pursuing formal education via e-learning. The perceptions and attitude of the instructor regarding e-learning plays a determining role in students’ e-learning usage;
2 Literature review
The TAM, developed for studying the intention of any new technology, is developed on the principles mentioned in the “Theory of Reasoned Action,” as observed by Davis. Since then, it is used meticulously by many researchers in developing the predictive frameworks about the usage intention of any emerging technology, for example - mobile devices, Internet, open software or enterprise systems in disciplines like business, medicinal sector, educational sector, and economical sector, as researched by Malaquias et al. In the past studies, TAM had been employed to a vast array of purposes, such as measuring the perceptions of simulation-based learning amongst clinical students, or evaluating the acceptance of mobile technologies by teachers, etc [8].
Since our study is linked to students’ emotions and attitude regarding the acceptance of e-learning under forced situation (Compulsion of online education due to COVID-19 pandemic), SDT is incorporated to associate few external factors that complete and elevates the drafted framework. In recent years, the TAM blended with SDT has been extensively used in the literature. Strong compatibility in them has been found, as in an evaluator study by Nikou et al [9].
2.1 TAM
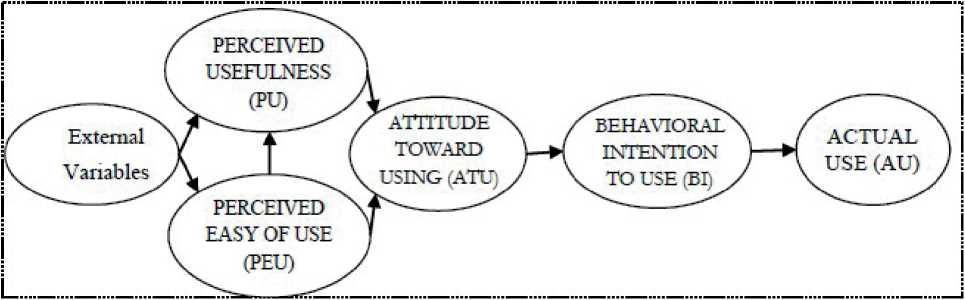
Fig. 1.Original TAM model
Research suggests that the two factors majorly influencing the ATT of the users toward using virtual-based learning are PU and PEOU, as studied by Davis [11]. Apart from these two factors, in several of this domain-related research, many other external constructs have been included to modify the TAM, affecting e-learning acceptance. These external constructs can be related to supporting technology, learner characteristics, subjective norms or aiding environment, etc. Previous research has emphasized the importance of analyzing and reviewing the impact of the motivational drivers on usage intention of e-learning systems, as recorded by Huang, but there lies a research gap that can be detected in the current pandemic situation COVID-19. Hence, further research is required for extensively understanding the influencing factors towards usage intention of e-learning for formal education under forced conditions [12].
2.2 SDT
2.3 SDT and TAM
3 Research frameworks 3.1 Autonomy
Autonomy is pertinent to self-regulation, which is in variation to forced regulation by external instruments. Autonomy reflects the distinctive acts that control an individual’s behavior. Although SDT is more focused on individual’s approval of the act, it also supports contingencies. Sense of ‘learning autonomy’ is observed in students in the education field, as researched by Nikou et al. In his research, Racero et al.
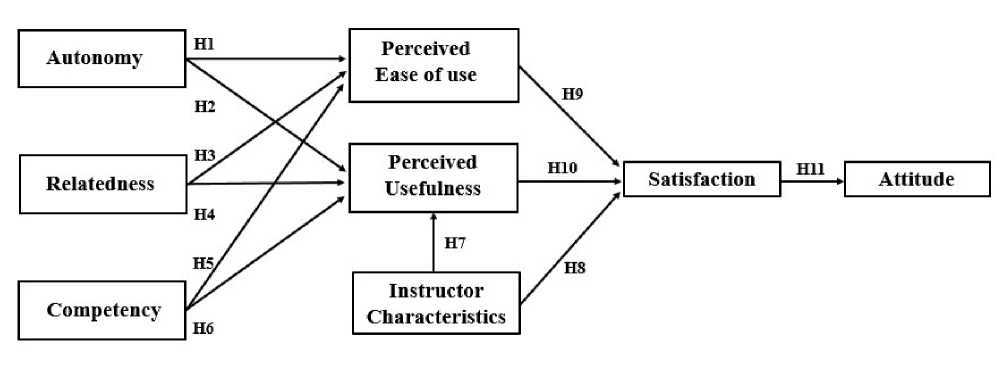
Fig. 2. The conceptual framework
H1 : AUTO has a significant relation with PEOU in e-learning
H2 : AUTO has a significant relation with PU in e-learning
3.2 Relatedness
H3 : REL has a significant relation with PEOU in e-learning
H4 : REL has a significant relation with PU in e-learning
3.3 Competency
H5 : COMP has a significant relation with PEOU in e-learning
H6 : COMP has a significant relation with PU in e-learning
3.4 Instructor characteristics
H7 : INST has a significant relation with PU in e-learning
H8 : INST has a significant relation with SATIS in e-learning
3.5 PEOU and PU
H9 : PEOU has a significant impact on SATIS in e-learning
H10 : PU has a significant impact on SATIS in e-learning
3.6 Satisfaction
H11 : SATIS has a significant impact on students’ ATT in e-learning
3.7 Attitude
Attitude refers to “the degree to which a person has a positive or negative feeling towards e-learning systems.” It was stated by Salloum et al. the relationship of PEOU and PU with learner’s attitude towards usage intention of e-learning. Hence, in our framework, we are analyzing the influence of satisfaction on the attitude of users.
4 Research methodologies
This research has primarily used an online survey to accumulate the data from the desired respondents. The main reason for employing an online survey format is to target the appropriate sample and reach out to them considering the COVID-19 situation. The sample size comprises UG and PG students from various Indian universities currently undergoing online education after universities suspend physical classes. A total of 250 students were invited to fill the survey. Convenience sampling was adopted for the unbiased collection of data. 221 students responded in total, out of which 22 them were found unsuitable for analysis. Therefore, only 199 responses were used for further analysis. The online questionnaire used for this survey consisted of a five-point Likert Scale, where 1 represented ‘Strongly Disagree’ and 5 represented ‘Strongly Agree.’
The scale instruments have been derived from the constructs in previously conducted studies. They are modified to align with this research. The survey instrument includes 6 items of Autonomy (AUTO), 5 items of Relatedness (REL) & 5 items of Competency (COMP) adapted from Racero et al., 4 items of Instructor Characteristics (INST) from Al-Fraihat et al. Ibrahim et al., 6 items of PEOU & 5 items of PU from Racero et al., 5 items of SATIS from Sunkara et al.; Al-Fraihat et al. and 5 items of Attitude (ATT) adapted from Salloum et al.
The data collected has been analyzed using SPSS version 25. The various analysis techniques employed for this research are ‘Linear Regression’ and ‘Multiple Regression test.’ Data characteristic of the demographic information in Table 1.
Table 1
Demographic profile of the sample
|
Descriptive Statistics |
||||
|
S. No. |
Variable |
Group |
Frequency |
% |
|
1) |
Gender |
Male |
115 |
57.79 |
|
Female |
84 |
42.21 |
||
|
Others |
- |
- |
||
|
2) |
Course |
MBA / BBA |
153 |
76.88 |
|
M.Tech / BE / B.Tech |
27 |
13.57 |
||
|
MCA / BCA |
12 |
6.03 |
||
|
MSc / BSc |
4 |
2.01 |
||
|
M.Com / B.Com |
3 |
1.51 |
||
|
3) |
Age |
Under 25 |
162 |
81.41 |
|
Over 25 |
37 |
18.59 |
||
Source: Author’s findings and calculations
5 Data analysis and discussion 5.1 Cronbach’s alpha
The reliability of the construct is tested to confirm and verify that the results obtained are consistent and reliable. The consistency of items scale used for each of the constructs are measured by reliability analysis in SPSS through Cronbach’s Alpha test. The admissible value is 0.7 was suggested by Nunnally. It is observed that Cronbach’s alpha is above 0.7 for the constructs, and the overall value is 0.908. Hence, we can consider the questionnaire to be a reliable measurement instrument in Table 2.
Table 2
Reliability statistics
|
Scale |
Cronbach’s Alpha |
No. of Items |
|
Autonomy |
0.808 |
4 |
|
Relatedness |
0.827 |
5 |
|
Competency |
0.796 |
5 |
|
Instructor Characteristics |
0.783 |
4 |
|
PEOU |
0.866 |
6 |
|
PU |
0.802 |
5 |
|
Satisfaction |
0.814 |
5 |
|
Attitude |
0.818 |
5 |
|
Overall value |
0.908 |
39 |
Source: Author’s findings and calculations
Since multivariate problems often arise in these practical problems, many variables have significant relationships that might increase the complexity of analysis. So, Exploratory Factor Analysis (EFA) is carried out to address this problem. In carrying out EFA, the sampling adequacy is tested through KMO measures. The value obtained is computed as 0.930, which perfectly lies in the range defined by Kaiser, 1974. Bartlett’s Test of Sphericity, indicating a substantial relationship among the constructs.
5.2 Regression analysis
In consideration of the TAM and SDT framework, eleven hypotheses have been drafted. Regression statistics have been used to test the significance of each hypothesis. The summary of the regression data in Table 3 with certain observations like β value is high for high t-value and small p-value.
H1: Regression Analysis carried out to test the hypothesis with Autonomy (AUTO) as the predictor variable and PEOU as the dependent variable, we obtained (β=0.799, t=21.186, p<0.05). Hence, we can conclude that a significant relationship exists between AUTO and PEOU. The obtained outcome of R2 is 0.695, indicating 69.5% of the variation in PEOU is explained by AUTO, which measures the overall stability of the association and reflects the extent to which a predictor factor is associated with a dependent factor. The unstandardized coefficient of β illustrates the degree to which the predictor variable predicts the dependent variable. For every one unit of change in AUTO, a 0.799 unit of change can be observed in PEOU. Hence, the hypothesis is accepted.
The obtained result proves the existence of a significant relationship between AUTO, REL, COMP(predic-tor variable), and PEOU (dependent variable) with the calculated value of (R2=0.725) indicating that the predictor variables explain 72.5% variation in the PEOU. The unstandardized coefficient of β illustrates the extent to which predictor variables predict the dependent variables. AUTO (β=0.636) has the strongest effect on PEOU, followed by REL (β=0.151). VIF (Variance Inflation Factor) and Tolerance are used to measure the presence of multicollinearity. VIF >10 and Tolerance < 0.2 indicates multicollinearity. From Table 5, we can see VIF values are between 2-4, and Tolerance values are in
Table 3
Regression values
|
Hypothesis |
Predictor Variable |
Dependent Variable |
Un-standardized Coefficients |
F |
t |
p |
R2 |
Hypothesis Supported? |
|
|
β |
Std. Error |
||||||||
|
H1 |
AUTO |
PEOU |
0.799 |
0.038 |
448.852 |
21.186 |
0.00 |
0.695 |
Yes |
|
H2 |
AUTO |
PU |
0.621 |
0.05 |
154.728 |
12.439 |
0.00 |
0.44 |
Yes |
|
H3 |
REL |
PEOU |
0.746 |
0.048 |
239.752 |
15.484 |
0.00 |
0.549 |
Yes |
|
H4 |
REL |
PU |
0.787 |
0.042 |
349.61 |
18.698 |
0.00 |
0.64 |
Yes |
|
H5 |
COMP |
PEOU |
0.705 |
0.056 |
156.65 |
12.516 |
0.00 |
0.443 |
Yes |
|
H6 |
COMP |
PU |
0.855 |
0.042 |
423.645 |
20.583 |
0.00 |
0.683 |
Yes |
|
H7 |
INST |
PU |
0.775 |
0.039 |
391.136 |
19.777 |
0.00 |
0.665 |
Yes |
|
H8 |
INST |
SATIS |
0.805 |
0.04 |
397.444 |
19.936 |
0.00 |
0.669 |
Yes |
|
H9 |
PEOU |
SATIS |
0.614 |
0.057 |
114.633 |
10.707 |
0.00 |
0.368 |
Yes |
|
H10 |
PU |
SATIS |
0.916 |
0.034 |
707.907 |
26.607 |
0.00 |
0.782 |
Yes |
|
H11 |
SATIS |
ATT |
0.843 |
0.039 |
471.292 |
21.709 |
0.00 |
0.705 |
Yes |
Source: Author’s findings and calculations
Table 4
Result
|
Model |
R |
R2 |
Adjusted R2 |
Std. The error of the Estimate |
|
1 |
.851 |
0.725 |
0.720 |
0.55404 |
Source: Author’s findings and calculations
Table 5
Multiple regression statistics
|
Coefficients |
||||||||
|
Model |
Unstandardized Coefficients |
Standardized Coefficients |
t |
Sig. |
Collinearity Statistics |
|||
|
B |
Std. Error |
Beta |
Tolerance |
VIF |
||||
|
1 |
(Constant) |
0.221 |
0.126 |
1.746 |
0.082 |
|||
|
Autonomy |
0.610 |
0.057 |
0.636 |
10.786 |
0.000 |
0.406 |
2.462 |
|
|
Relatedness |
0.152 |
0.077 |
0.151 |
1.969 |
0.049 |
0.341 |
4.146 |
|
|
Competency |
0.132 |
0.069 |
0.125 |
1.919 |
0.016 |
0.334 |
2.990 |
|
Source: Author’s findings and calculations the acceptance range, signifying the absence of multicollinearity Table 6 shown the result.
The obtained result proves the existence of a significant relationship between AUTO, REL, COMP, INST (predictor variable), and PU (dependent variable) with the calculated value of (R2=0.785) indicating that predictor variables explain 78.5% variation in the PU. INST (β=0.373) has the strongest effect on PU followed by COMP (β=0.357), REL (β=0.199), and AUTO (β=0.142). From Table 7, we can see VIF values are between 2-4, and Tolerance values are in the acceptance range, signifying the absence of multicollinearity. Table 8 shows the result
Table 6
Result
|
Model |
R |
R2 |
Adjusted R2 |
Std. The error of the Estimate |
|
1 |
.886 |
0.785 |
0.781 |
0.47904 |
Source: Author’s findings and calculations
Table 7
Multiple regression statistics
|
Coefficients |
||||||||
|
Model |
Unstandardized Coefficients |
Standardized Coefficients |
t |
Sig. |
Collinearity Statistics |
|||
|
B |
Std. Error |
Beta |
Tolerance |
VIF |
||||
|
1 |
(Constant) |
0.070 |
0.112 |
0.628 |
0.531 |
|||
|
Autonomy |
0.040 |
0.049 |
0.142 |
0.805 |
0.022 |
0.402 |
2.487 |
|
|
Relatedness |
0.195 |
0.069 |
0.199 |
2.836 |
0.005 |
0.225 |
4.437 |
|
|
Competency |
0.369 |
0.064 |
0.357 |
5.772 |
0.000 |
0.290 |
3.450 |
|
|
Instructor Characteristics |
0.354 |
0.051 |
0.373 |
6.888 |
0.000 |
0.378 |
2.649 |
|
Source: Author’s findings and calculations
Table 8
Result
|
Model |
R |
R2 |
Adjusted R2 |
Std. The error of the Estimate |
|
1 |
.900 |
0.810 |
0.807 |
0.46563 |
Source: Author’s findings and calculations
Table 9
Multiple regression statistics
|
Coefficients |
||||||||
|
Model |
Unstandardized Coefficients |
Standardized Coefficients |
t |
Sig. |
Collinearity Statistics |
|||
|
B |
Std. Error |
Beta |
Tolerance |
VIF |
||||
|
1 |
(Constant) |
0.089 |
0.107 |
0.834 |
0.405 |
|||
|
Instructor Characteristics |
0.285 |
0.054 |
0.290 |
5.250 |
0.000 |
0.320 |
3.126 |
|
|
PEOU |
0.407 |
0.043 |
0.117 |
7.163 |
0.007 |
0.539 |
2.855 |
|
|
PU |
0.676 |
0.059 |
0.653 |
11.449 |
0.000 |
0.300 |
3.338 |
|
Source: Author’s findings and calculations
we can see VIF values are close to 3, and Tolerance values are in the acceptance range, signifying the absence of multicollinearity.
Thus, the proposed framework holds for this domain as proven through the data analysis.
6 Conclusions
The spread of COVID-19 has forced most of the service industry around the world to look for alternatives to sustain. The Internet became the savior, and ‘Online became the ‘New Normal.’ The education industry is also forced to shift from offline to online overnight, impacting millions of students and teachers worldwide. Students in the middle of their academic year are forced to accept and adapt to the new technology of e-learning. Under TAM’s conceptual framework with SDT, the proposed hypotheses were tested to comprehend better the influencing determinants of e-learning acceptance by students pursuing their educational degree.
With adequate infrastructure required for the smooth functioning of e-learning, further studies can be carried out to understand the technical system quality or support system quality. A comparative study can also be conducted on the cost of traditional education methods and online modes of education. Since we have only studied a sample of university students, the drivers for e-learning acceptance can differ for students with changing pedagogy. Generalization of this framework would be unsatisfactory, thus leaving a further scope of research.
Statement on ethical issues
Research involving people and/or animals is in full compliance with current national and international ethical standards.
Conflict of interest
None declared.
Author contributions
The authors read the ICMJE criteria for authorship and approved the final manuscript.
References E-learning in formal education under forced conditions using SDT and tam
- G.G. Conole, MOOCs as disruptive technologies: strategies for enhancing the learner experience and quality of MOOCs. Revista de Educación a Distancia, (39), (2013).
- J. Daniel, E. V. Cano, M.G. Cervera, The future of MOOCs: Adaptive learning or business model? International Journal of Educational Technology in Higher Education, 12, 1, 64-73, (2015).
- F.D. Davis, Perceived usefulness, perceived ease of use, and user acceptance of information technology. MIS Quarterly, 13, 3, 319-340, (1989).
- E.L. Deci, R.M. Ryan, The general causality orientations scale: Self-determination in personality. Journal of research in personality, 19, 2, 109-134, (1985).
- E.L. Deci, R.M. Ryan, The” what” and” why” of goal pursuits: Human needs and the self-determination of behavior, Psychological Inquiry, 11, 4, 227-268, (2000).
- W.H. Delone, E.R. McLean, The DeLone and Mc-Lean model of information systems success: a ten-year update. Journal of management information systems, 19, 4, 9-30, (2003).
- H.F. Kaiser, An index of factorial simplicity. Psychometrika, 39, 1, 31-36, (1974).
- R.F. Malaquias, F.F. Malaquias, Y. Hwang, Understanding technology acceptance features in learning through a serious game. Computers in Human Behavior, 87, 395-402, (2018).
- A.I. Moolla, C.A. Bisschoff, Validating a model to measure the brand loyalty of fast-moving consumer goods. Journal of Social Sciences, 31, 2, 101-115, (2012).
- S.A. Nikou, A.A. Economides, Mobile-Based Assessment: Integrating acceptance and motivational factors into a combined model of Self-Determination Theory and Technology Acceptance. Computers in Human Behavior, 68, 83-95, (2017).
- J.C. Nunnally, Psychometric theory 3E. Tata Mc- Graw-hill education, (1994).
- R.M. Ryan, E.L. Deci, Self-determination theory and the facilitation of intrinsic motivation, social development, and well-being. American psychologist, 55, 1, 68, (2000).
- R.M. Ryan, E.L. Deci, Self-determination theory: Basic psychological needs in motivation, development, and wellness. Guilford Publications, (2017).
- Ø. Sørebø, H. Halvari, V.F. Gulli, R. Kristiansen, The role of self-determination theory in explaining teachers’ motivation to continue to use e-learning technology. Computers & Education, 53, 4, 1177-1187, (2009).
- P.C. Sun, R. J. Tsai, G. Finger, Y.Y. Chen, D. Yeh, What drives a successful e-Learning? An empirical investigation of the critical factors influencing learner satisfaction. Computers & Education, 50, 4, 1183-1202, (2008).
- V.M. Sunkara, R.R. Kurra, An analysis of learner satisfaction and needs on e-learning systems. International Journal of Computational Intelligence Research, 13, 3, 433-444, (2017).
- V. Venkatesh, Determinants of perceived ease of use: Integrating control, intrinsic motivation, and emotion into the technology acceptance model. Information systems research, 11, 4, 342-365, (2000).
- S. Zhang, J. Zhao, W. Tan, Extending TAM for online learning systems: An intrinsic motivation perspective. Tsinghua Science and Technology, 13, 3, 312-317, (2008).
- M. Zhou, Chinese university students’ acceptance of MOOCs: A self-determination perspective. Computers & Education, 92, 194-203, (2016).
