ECG as a quest for extracting new data: non-invasive measurement of acid-alkaline parameters

Author: Rudenko Mikhail Y., Zernov Vladimir A., Mamberger Konstantin, Rudenko Sergey M.
Journal: Cardiometry @cardiometry
Section: Original research
Article in issue: 3, 2013.
Free access
Aims A cardiac muscle performance assessment in terms of acid-alkaline balance has never been carried out before. The studies show it is possible to evaluate indirectly aerobic, anaerobic and phosphocreatine processes in the cardiac muscle using ECG only. The aim is to study the capabilities of acid-alkaline balance measurement in the cardiac muscle using ECG only, in combination with the heart cycle phase analysis. Materials and methods The ECG of the ascending aorta is recorded with Cardiocode device. Amplitudes of the derivatives of leading and trailing edge of R, L and j waves are measured. The QRS complex amplitude depends on the amplitudes of the septum and myocardium muscles contractions. The septum is contracted because of the lesser resistance since the myocardium muscles are not loaded yet. When the myocardium muscles are contracted, they take a heavier load since the septum remains under static strain. It allows evaluating the difference in the energy consumption for each group of the muscles according to the respective ECG derivative...
Acid-alkaline balance, biochemical processes, cardiac cycle, ecg, myocardium
Short address: https://sciup.org/148308743
IDR: 148308743
Text of the scientific article ECG as a quest for extracting new data: non-invasive measurement of acid-alkaline parameters
Aims A cardiac muscle performance assessment in terms of acid-alkaline balance has never been carried out before. The studies show it is possible to evaluate indirectly aerobic, anaerobic and phosphocreatine processes in the cardiac muscle using ECG only. The aim is to study the capabilities of acid-alkaline balance measurement in the cardiac muscle using ECG only, in combination with the heart cycle phase analysis. Materials and methods The ECG of the ascending aorta is recorded with Cardiocode device. Amplitudes of the derivatives of leading and trailing edge of R, L and j waves are measured. The QRS complex amplitude depends on the amplitudes of the septum and myocardium muscles contractions. The septum is contracted because of the lesser resistance since the myocardium muscles are not loaded yet. When the myocardium muscles are contracted, they take a heavier load since the septum remains under static strain. It allows evaluating the difference in the energy consumption for each group of the muscles according to the respective ECG derivative. It will suffice to compare the amplitudes of the first derivative characterizing the muscle contractility rate during Q – R and R – S periods. Results Over 500 patients were examined. As a result, ranges of every biochemical reaction changes have been established. The ranges of energy consumption assessment for the biochemical processes featuring the biochemical reactions in cardiac muscles are defined. Conclusion The ECG heart cycle phase analysis allows obtaining the acid-alkaline balance data of biochemical reactions governing the cardiac muscle contraction that is an important diagnostic marker. Keywords ECG • Acid-alkaline balance • Myocardium • Biochemical processes • Cardiac cycle Imprint Mikhail Y. Rudenko, Vladimir A. Zernov, Konstantin K. Mamberger, Sergey M. Rudenko. ECG as a quest for extracting new data: non-invasive measurement of acid-alkaline parameters; Cardiometry; No.3; November 2013; p.45-57; doi: 10.12710/cardiometry.2013.3.4557 Available from:
Attempts to noninvasively measure the acid-alkaline balance with an ECG have been made since 1984. [1] S.A. Dushanin developed a method for aerobic, anaerobic and phosphocreatine parameter measuring with a three lead ECG. He considered that there was an objective correlation between the ventricular depolarization rate and metabolic parameters, which can be determined by the R-wave amplitude percentage ratio to the sum of R and S amplitudes in the right and left chest leads of ECG at rest [2]. The method has been practically applied to condition athletes for competitions.
The development of the cardiac cycle phase analysis revealed new possibilities for more accurate and easier metabolic parameter measuring using only single ECG lead [3, 4, 5]. Clinical investigations have proven the correctness of the chosen way. Metabolic reactions in both healthy and pathological cardiovascular systems were considered during the investigations. The general approach of the new method is presented herein.
The aim is to develop a principally new method for evaluating aerobic, anaerobic and phosphocreatine reactions that determine the cardiovascular system performance, using only single lead ECG.
Materials and methods
The method is implemented in the way described below. Only single lead ECG is recorded. It is an original system, as it records an ECG of the ascending aorta [3, 4]. As opposed to the standard ECG leads, the ascending aorta ECG records the overall result of the heart performance. This allows evaluating each of the 10 cardiac cycle phases with a high accuracy.
The heart performance is controlled by three baroreceptors: SA node, AV node and aortic baroreceptors (AB). Fig. 1 shows an ECG curve as a sequence of harmonic signals. Periods of nerve impulse generation are marked on the curve. Every neural center is responsible for exciting the corresponding muscles of the heart and the aorta resulting in their contraction.
The amplitudes of these contractions are recorded by the device. These are precisely the amplitudes which form the ECG curve.
The word "baroreceptor" contains the term "bar". This is the unit of measure of pressure. The word indicates the peculiarities of baroreceptor performance stressing their dependence on the blood volumes pressure. So, while the AV node will be pressure-loaded, the nerve impulses-action potentials will be generated, and the IVS and the myocardium will be contracted. It is shown as a sequence of QRS complexes on the ECG on Figure 1. The next QRS, then the second and the third QRS complexes follow the first well-known one. The difference between them is that the first complex is a transition of the muscles from their relaxation to their tension state, and the same contractions as it is the case in the first QRS complex are superimposed on the strained state in the second one. However, due to the constant muscle tension, oscillations similar to the QRS complex will have smaller amplitude. This process occurs in the phase of tension S – L. Then it repeats again, but with smaller amplitude [6-11].
ECG
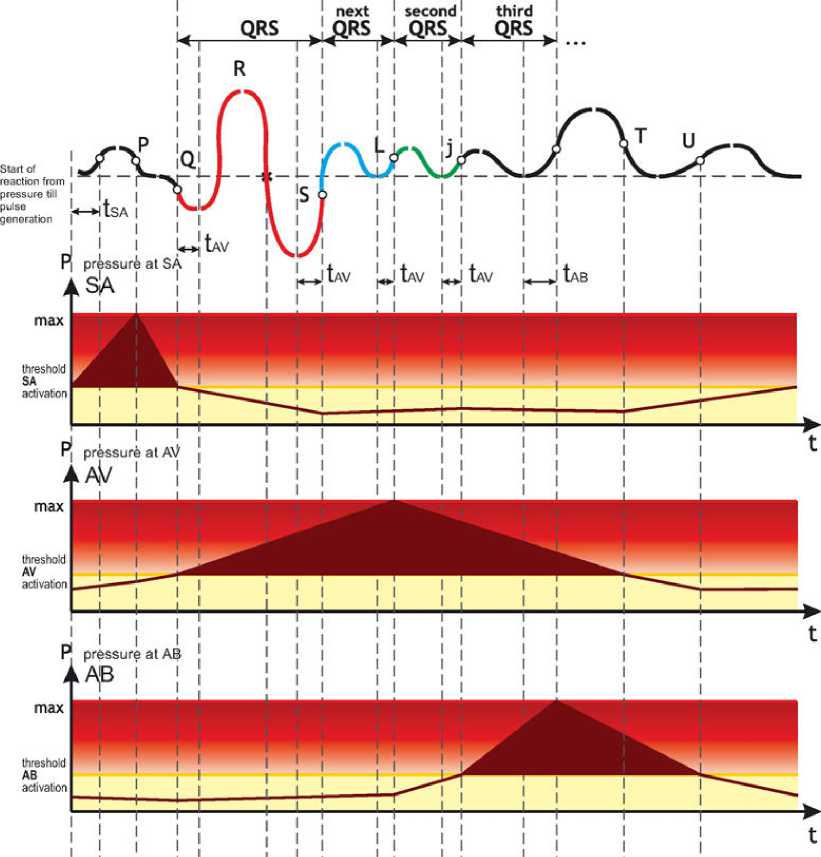
Figure 1. Principle of performance of heart and aortic baroreceptors forming an ECG.
During a very intensive short physical activity these oscillations can be repeated again up to three times (Fig. 2). But because of the energy consumed during oscillations, their number will decrease from cycle to cycle.
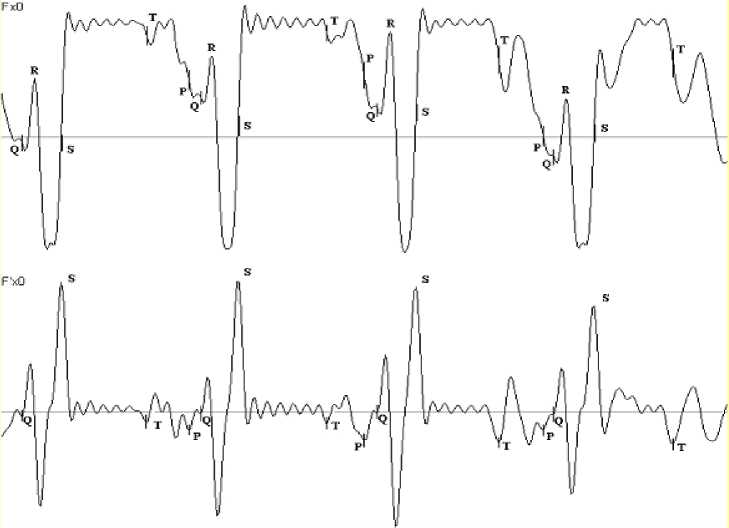
Figure 2. ECG of a weightlifter at the moment of lifting and holding a weight. From cycle to cycle the number of phases called the third QRS following the rapid ejection phase decreases.
The processes of the dynamic contraction and static muscle tension are provided by the biochemical reactions. Thus, the main QRS complex, in which the transition from the muscles relaxation to the static tension occurs, is provided with oxygen stocked during the diastole. At the same time, the initial process of muscle contraction is carried out with the maximum initial stock of ATP in the mitochondria. The low oxygen content is reflected in the rate of heart muscles contraction [6-11]. What can be controlled by the first derivative of ECG? The amplitude of the first derivative will indicate the power of contraction. The smaller is the amplitude, the less is the power.
Considering the heart anatomy and the fact that the QRS complex is formed by the interventricular septum and myocardium contraction amplitudes, first the interventricular septum contracts, as it is exposed to a lesser resistance since the myocardium muscles are not pre-loaded yet. When the myocardium muscles are contracted, they are exposed to a greater load than the interventricular septum, as the interventricular septum remains static.
It allows evaluating the difference in energy consumption for each group of muscles. It is enough to compare the amplitude of the first derivative, characterizing the muscle contraction rate during the Q – R and R - S periods (Fig. 3).The general formula will be of a simple form as follows:
W = R '/ S' (relative units)
where: W – conventional energy of the process; R '-the amplitude of the ECG first derivative characterizing the interventricular septum contraction rate; S '-the amplitude of the ECG first derivative characterizing the myocardium contraction rate;
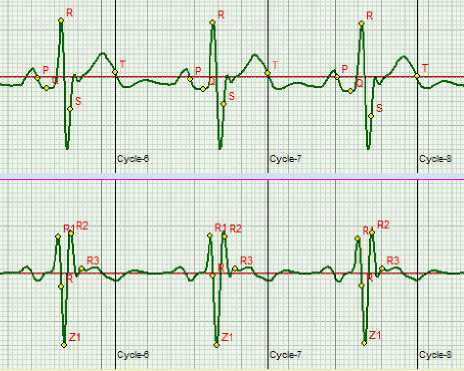
Figure 3. Real ECG and first derivative curves. The first positive amplitude of the first derivative and the next negative one are used for calculations, absolute value is utilized. At the top of the figure, the points designate the corresponding phases, the derivative is shown at the bottom.
Results
Analyzing the above formula, it is seen that if the energy values of both muscle groups contractions are equal, then W = 0,5. There are two variants of changing relations in the formula. The first variant is the decreasing of W when the interventricular septum energy goes down. The second one is the increasing of W when the myocardium contracts with smaller amplitude. But in this case it is necessary to distinguish two cases. The first case is when the myocardium muscle is strengthened by the training process, and its contraction amplitude is reduced, the other case is when the myocardium muscles obtain additional tension because of the compensatory mechanisms. Then the amplitude sharply descends, and the value of W can exceed 1. This is an extreme case which may occur with pathologies corresponding to the mode of reactivation in the system of body state evaluation by L.Garkavi [7].
Thus, ranges of relative energy costs norm for the processes occurring in the period of QRS complex can be identified (Fig. 4).
Figure 4. Ranges of general energy costs.
Middle initial normal level for untrained individuals will be in the range of 0.5...0.55.
For individuals with a middle conditioning level the range will be 0.6...0.65.
For individuals with a high conditioning level and endurance the range will be 0.7 ...0.85.
Intermediate values between the ranges should be evaluated as boundary transitional ones.
0.85 and greater is a pathological energy cost zone.
The practice shows that the method has a high sensitivity. The data before and after training are very informative and indicate trends of heart energy resource dynamics.
Considering that the QRS complex is a basic part of the cardiac cycle and the muscles are evaluated from the time of complete relaxation to the time of creation of the initial conditions for other energy processes, the studies have shown that the W rate evaluates the energy level corresponding to the aerobic processes in the body.
Therefore, Fig. 4 can be used for the aerobic processes evaluation. After an intensive load, the W rate for aerobic processes will decrease.
The studies have shown that the W rate is linked to acid –alkaline balance. However, if W is greater than 1, it is close to the lower limit of blood glucose level.
The processes in the S - L phase occur in the same way as it is the case with the QRS complex. The essential difference is that they occur against the background of the interventricular septum and myocardium muscles tension. A combination of dynamic and static muscle performance is observed herein. This phase is very important in hemodynamics of circulation. Its performance forms the blood flow structure that allows providing blood flow with minimal friction. Also, the synchronization of systemic and pulmonary circulation will depend on the condition of the lungs, or to be more precise, their resistance to blood flow. Static muscle tension requires extra energy costs. With an intensive consumption of oxygen that occurs during intensive physical activity, the mechanism of static muscle tension will be first affected by oxygen deficiency. Lactic acid will be accumulated in muscles under certain conditions. The studies have shown that the S - L phase, it may be also called next QRS, reflects the anaerobic-glycolytic reactions, which can also be evaluated by a similar formula, but with substituting the values of R ' and S' derivatives of the next QRS.
The range of the relative norm for Wg will be different, it will be from 3 to 7 to say exactly (Fig. 5). The studies have shown that the values above 7 will indicate a high content of lactic acid (lactate) in muscles. The worse is overload capability of an athlete, the greater Wg value is detected.
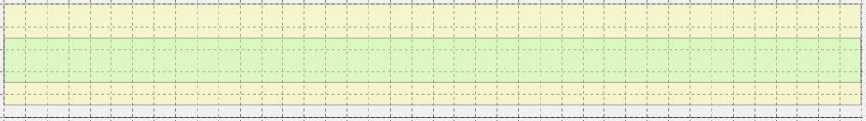
Figure 5. Range of energy cost evaluation for anaerobic glycolytic processes. The norm is from 3 to 7.
It is necessary to bring the lactate level to the normal range till the next training. A low initial value indicates a low concentration of carbon dioxide in the body. It does not provide the normal ATP re-synthesis, and an athlete is not ready for intense accelerations against the monotonous physical load. It is important to note that the lactate accumulation in muscle cells leads to the swelling of the cells due to the accumulation of water therein, which ultimately reduces muscle contractile capability. At the end of the sports career athletes often suffer from mitochondrial cardiomyopathy. The reason is a deranged ATP re-synthesis leading to excessive lactate formation, which was maintained within the norm by the athlete during his career and which cannot be maintained after sudden stopping of physical activity. The result is an accumulation of water in the heart cells. This is reflected in the R wave amplitude change on ECG during orthostatic test. Typically, the interventricular septum cells suffer. Under such conditions the myocardium cells are less affected.
Then the L - j rapid ejection phase begins. At the beginning of this phase the aortic valve opens, and blood starts flowing into the aorta. The studies have shown that this phase can be manifested on ECG several times only in case of great physical load (Fig. 2).The multiple phase manifestation occurs only in case of necessity to intensify the phosphocreatine reactions due to high physical loads. Therefore it can be evaluated as it is the case with the amplitude ratios of derivatives. Then the range of energy cost evaluation for Wkf will be from 2 to 4 (Fig. 6). After physical load this parameter will decrease, indicating the reduction of ATP re-synthesis conditions.
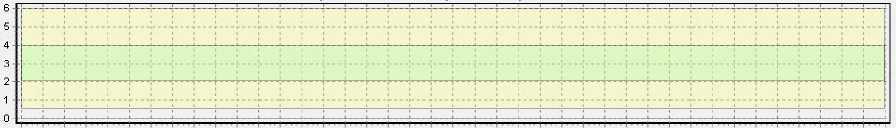
Figure 6. Range of energy cost evaluation for phosphocreatine processes. The norm is from 2 to 4.
It should be noted that all above reactions are closely interconnected. Their common basis is the balance of oxygen and carbon dioxide in the body. Their transport systems: L - carnitine, serotonin and tryptophan are also important. Nutrition and rest conditions are important. Taking into account all the above and using the noninvasive method for biochemical reactions evaluation according to the ECG only, an effective possibility to predict the conditioning process and achieve best athletic results comes to existence.
Let us consider an example of the metabolic processes analysis for an athlete before her world championship and her world record. Figure 7 shows the results of the analysis performed automatically. The use of these graphs as a reference for the further training of the athlete enabled her to become a twice world champion and establish more than one world record.
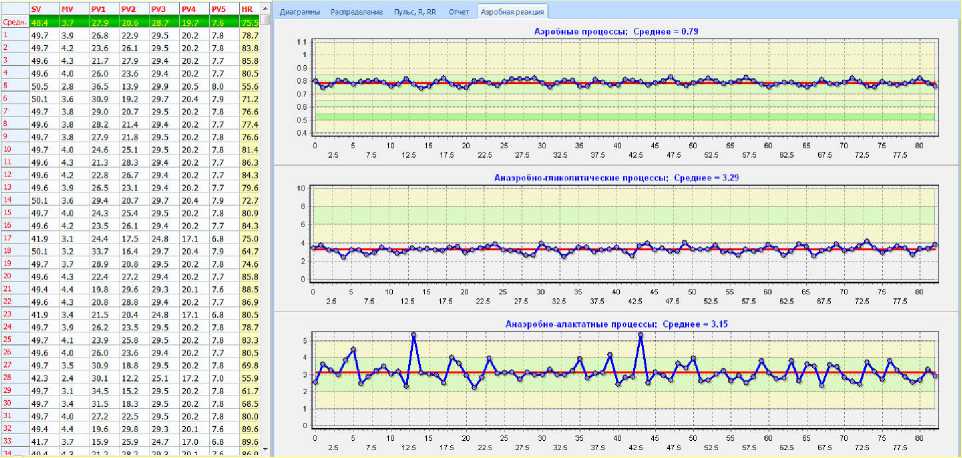
Figure 7. Results of biochemical processes evaluation two months before establishing the world record and winning the world championship. Recorded before the regular training.
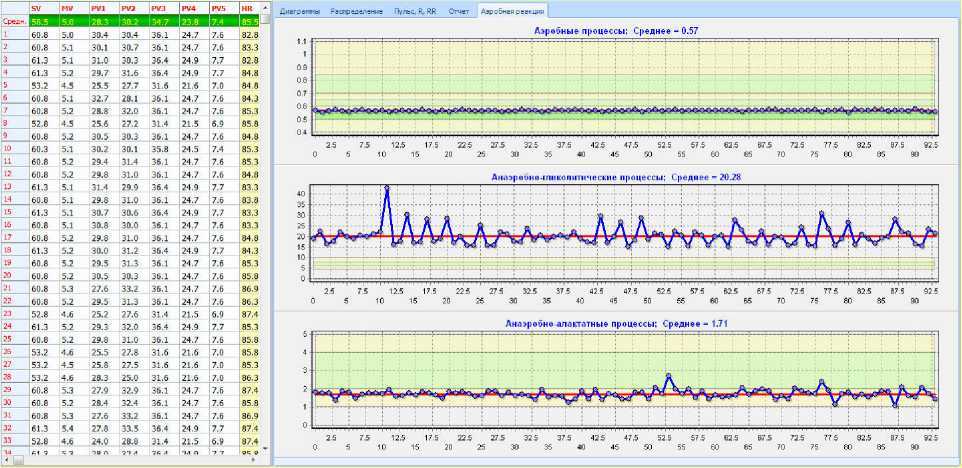
Figure 8. Results of biochemical processes evaluation after training with acceleration load elements. The tested sportsman was an Olympic bronze medal winner one month ago.
Figure 8 shows the data obtained immediately after an intensive training of an Olympic prize winner. It is evident that the aerobic processes being at the lower limit of the norm: W =
0,57 are exhausted. Lactic acid level is Wg = 20,28. This indicates a large accumulation of lactic acid in the heart muscles. Phosphocreatine Wkrf is1, 71. It is below the norm and shows a lack of reserves in ATP re-synthesis. All parameters should be brought to the norm, as shown in Figure 7, before the next training.
Discussion and conclusions
The method allows efficiently and easily monitoring the metabolic processes in the heart muscle. Further research is aimed at building a scale of correlation between the relative units used in the method and the conventional generally accepted units mmol/liter.
Statement on ethical issues
Research involving people and/or animals is in full compliance with current national and international ethical standards.
Conflict of interest
None declared.
Author contributions
All authors developed the concept, analyzed the data, prepared the manuscript and read the ICMJE criteria for authorship. V.A.Z. drafted the manuscript. All authors read and approved the final manuscript.
References ECG as a quest for extracting new data: non-invasive measurement of acid-alkaline parameters
- Dushanin SA. Advanced methods for investigation of energy metabolism in muscles performance. Kiev1984.
- Dushanin S. System for multi-factor express diagnostics of sportsmen functional conditioning under current operative medical & pedagogic control. Kiev1986.
- Rudenko MY, Zernov VA, Voronova O.K. Fundamental Research on the Mechanism of Cardiovascular System Hemodynamics Self-Regulation and Determination of the Norm-Pathology Boundary for the Basic Hemodynamic Parameters and Analysis of the Compensation Mechanism as a Method of Revealing the Underlying Causes of the Disease. Heart Rhythm. November 2012;9(11):1909 DOI: 10.1016/j.jelectrocard.2013.09.016
- Rudenko MY, Zernov VA, Voronova O.K. Study of Hemodynamic Parameters Using Phase Analysis of the Cardiac Cycle. Biomedical Engineering. July 2009;43(4):151-5.
- Rudenko M, Zernov V, Voronova O, Rudenko S, Mamberger K, D. M. Periodic table ECG phase changes (electrocardiography basics). ISBN 978-5-86746-116-5, Mosсow2013.
- Chapleau MW. Baroreceptor Reflexes (book chapter). Primer on the Autonomic Nervous System2012:161-165 DOI: 10.1016/B978-0-12-386525-0.00033-0
- Garkavi L. Activation therapy. ISBN 5-7507-0179-4, Rostov-on-Don: Rostov State University; 2006.
- Kenny D, Polson JW, Martin RP, Caputo M, Wilson DG, Cockcroft JR, et al. Relationship of aortic pulse wave velocity and baroreceptor reflex sensitivity to blood pressure control in patients with repaired coarctation of the aorta. American Heart Journal. August 2011;162(2):398-404.
- La Rovere MT, Maestri R, Pinna GD. Baroreflex sensitivity assessment -latest advances and strategies. Interventional Cardiology (London). 2012;7(2):89-92.
- Morrisona SF, Barmana SM, Gebber GL. Baroreceptor influences on cardiac-related sympathetic nerve activity. Brain Research. 28 May 1984;301(1):175-8.
- Sleight P. Reflex control of the heart. The American Journal of Cardiology. 22 October 1979;44(5):889-94.
