Economic Load Dispatch by Hybrid Swarm Intelligence Based Gravitational Search Algorithm

Author: Hari Mohan Dubey, Manjaree Pandit, B.K. Panigrahi, Mugdha Udgir
Journal: International Journal of Intelligent Systems and Applications(IJISA) @ijisa
Article in issue: 8 vol.5, 2013.
Free access
This paper presents a novel heuristic optimization method to solve complex economic load dispatch problem using a hybrid method based on particle swarm optimization (PSO) and gravitational search algorithm (GSA). This algorithm named as hybrid PSOGSA combines the social thinking feature in PSO with the local search capability of GSA. To analyze the performance of the PSOGSA algorithm it has been tested on four different standard test cases of different dimensions and complexity levels arising due to practical operating constraints. The obtained results are compared with recently reported methods. The comparison confirms the robustness and efficiency of the algorithm over other existing techniques.
PSOGSA, Economic Load Dispatch, Ramp Rate Limits, Prohibited Operating Zones (POZ)
Short address: https://sciup.org/15010450
IDR: 15010450
Text of the scientific article Economic Load Dispatch by Hybrid Swarm Intelligence Based Gravitational Search Algorithm
Published Online July 2013 in MECS DOI: 10.5815/ijisa.2013.08.03
Economic Load Dispatch (ELD) Problem determines the schedule of generation which minimizes the total generation and operation cost while satisfying the load demand and operational constraints of all generating units. As this problem is having a both complex and nonlinear characteristic with heavy equality and inequality constraints [1].However modern generating units have higher order non-linearities and discontinuities in input-output characteristics due to valve point loading, ramp rate limits and prohibited operating zones[2]-[4], which makes the finding of optimal solution very hard.
Classical optimization methods such as lambda iteration, base point and gradient method [5]-[6] were employed to solve the ELD problem. Lambda iteration method is the most commonly used, but for the effectiveness of this method, the formulation needs to be continuous. Dynamic programming [7] has been used to solve ELD problem with valve point effect but it is time consuming, computationally extensive and unnecessarily increases the dimension of the problem.
Due to the inadequacy of these methods to stuck to the local solution instead of global ones, artificial intelligence techniques are used to solve ELD problem, these techniques include Genetic algorithm (GA) [8], Particle Swarm (PSO) [8], Evolutionary Programming (EP) [9], Differential Evolution (DE)[10], Hopfield neural network (HNN)[11]. Other techniques are New Particle Swarm with Local Random Search (NPSO_LRS)[12], Self-Organizing Hierarchical Particle Swarm Optimization (SOH_PSO)[13], Bacterial Foraging Optimization Nelder Mead Hybrid Algorithm (BFONM)[14], Biogeography based optimization (BBO) [15], continuous Quick Group Search Optimizer (QGSO) [16], Chemo tactic Differential Evolution Algorithm (BF_DE hybrid)[17], Hybrid swarm intelligence harmony search (HHS)[18], Firefly algorithm (FA)[19], Artificial bee colony optimization(ABC)[22].These optimization methodologies have been applied successfully to solve economic load dispatch problem.
Here, a new population based hybrid algorithm (PSOGSA) is implemented to solve economic dispatch problem. The PSOGSA algorithm incorporates some features of particle swarm optimization algorithm into gravitational search algorithm i.e. exploitation ability of PSO with ability of exploration in GSA to unify their strength. The agents are initialized randomly and each agent in the search space is attracted towards the agent having a good solution. The agents near the optimal solution moves more slowly and assures the exploitation step of algorithm. Here gbest is used to exploit the global best. The position and velocity are updated until it reaches to the stopping criterion.
To validate the effectiveness of PSOGSA algorithm ELD problem with smooth and non-smooth cost function are considered in this paper. Non- smooth cost function includes generator capacity constraints, ramp rate limits, prohibited operating zones and losses whereas smooth cost function considers generator capacity constraints and power balance constraints with and without power loss.
The paper is organized as: sections 2 emphasize on the ELD problem with various practical constraints, section 3 gives a brief description about the PSOGSA algorithm. Section 4 presents the implementation of PSOGSA for ELD problem. In section 5 simulation results for our test cases are compared with the other recently reported methods. Finally the conclusion is drawn in section 6.
max(pmin,UR -p) < p < min(pmax,p0 -DR)
Where Pi is the current output power of ith unit and Pio is the power generation of ith unit at previous hour and URi and DRi are the up and down ramp rate limits respectively.
-
II. Problem Formulation
-
2.1 Power Balance Constraints:
The aim of economic load dispatch problem is to minimize the overall cost of production of power generation while satisfying power balance, generator constraints with ramp rate limits and prohibited operating zones. The objective function is usually stated as quadratic function. Mathematically the problem is formulated as:
min f = E N G F ( p i ) (1)
where
F ( p i ) = ap 2 + bp + C i (2)
Where F i is the total generating cost of ith generating unit and a i , b i and c i are the coefficients of ith generator. P i is the real power output (MW) of ith generator corresponding to time t, NG is the total number of generating units. The ELD problem discussed is subjected to the following constraints:
У N G p = p + p
4—11 = 1 i D L
Where PD is total load demand and PL is the total transmission loss. PL is calculated using B- coefficients, given by-
E Np Nr
GGPB P (4)
i = 1 4—1 J = 1 l 4 J v ’
-
2.2 Generator Constraints:
The power output of each unit is restricted by its upper Pmax and lower Pmin limits of real power generation and is given by- min

max
i
-
2.3 Ramp rate limits:
-
2.4 Prohibited Operating Zone:
When the ramp rate limits are considered, the generator operation constraints (5) are modified as follows:
A unit with prohibited operating zone has discontinuous cost characteristics. So the unit operation is avoided in prohibited zones. The concept of prohibited operating zone considers the following constraints:
F min < p < p L (I = 1,2,..., ng )
i ,1
p"—1
N ) ^ (7)
G
Where P i U j-1 and P i L j are the upper and lower boundaries of jth prohibited zone of ith generator and N Zi is the number of prohibited zones of ith generator.
-
III. Hybrid Algorithm (PSOGSA)
PSOGSA is formulated by S. Mirjalili et al. in 2010[20]. The basic concept behind the hybridization is to combine the ability of social thinking (gbest) in PSO using the local search capability of GSA.
The proposed algorithm considers the agents as objects and the position of ith agent is given by-
X, = ( x 1 ,..., x d ,..., x n )l = 1,2,..., N (8)
Where x i d is the position in the dth dimension of the ith agent (mass).
The masses are described randomly and the force acting on mass i from mass j is given as
, Mt ( t ) x M, ( t ) ,
f * ( t ) = g ( t ) l'; jV’ ( x d ( t ) - x d ( t )) (9)
j R j ( t ) + c J
Where Mi (t) and Mj(t) are masses of objects I and j, G(t) is the gravitational constant at time t, ε is a small constant, Rij(t) is the Euclidean distance between I and j objects.
R j( I ) = | X l ( t ), X j ( t )||2 (10)
Gravitational constant G (t) is initialized randomly in the beginning and is reduced with time to control the search accuracy.
t a
G ( t ) = G o eT (11)
It means G is the function of time t and initial value G0, where G0 is the initial value of gravitational constant, α is the user specified constant and T is the maximum number of iterations and t is the current iteration.
Let the total force acting on agent i in the dimension d is described as-
Mt( t ) =
m z ( t ) * 5 Z n = 1 m , ( t )
Where current-fitness i (t) is the fitness value of the agent i at any time t, and best (t) and worst (t) are the minimum and maximum fitness value of all agents.
The agents exploring in the search space are attracted towards other agents by means of gravity force and causes a movement to the agents having heavier mass. The heavier mass represents a good solution. Here gbest help them in finding the optima around a good solution. The optimal solution is found by using the exploitation ability of PSO. Global search and local search balance is accomplished by adjusting the values C1 and C2.
F id ( 1 ) = Z N .„„r^nd ^ FF ( t) (12)
Where, rand j is a random number between the interval [0, 1].
The acceleration of ith agent at iteration t having d dimension is given by the law of motion- acd (t) =
F d ( t )
M i ( t )
The velocity of an agent is calculated as- vd (t +1) = w.v (t)c. x rand x acf (t)
i ' i 1 d i (14)
+ c 2 x rand x (gbest - xt ( t ))
Where vid(t) is the velocity of agent i at iteration t in dimension d, c j ´ is a weighting factor, w is a weighting function, rand is a random number between 0 and 1, αc i d(t) is the acceleration of ith agent at iteration t in dimension d and gbest is the best solution found so far.
At each, iteration the position of an agent is calculated as- xd (t + 1) = xd (t) + vd (t +1) (15)
Where vid(t+1) is the velocity of next agent and xid is the position of ith agent in dth dimension at iteration t.
The value of masses of agents are calculated by comparison of fitness- mi(t) = currentfitnesst (t) - 0.99 * worst(t) best(t) - worst(t)
i = 1,2,..., n
-
IV. Implementation of PSOGSA Algorithm for Economic Load Dispatch
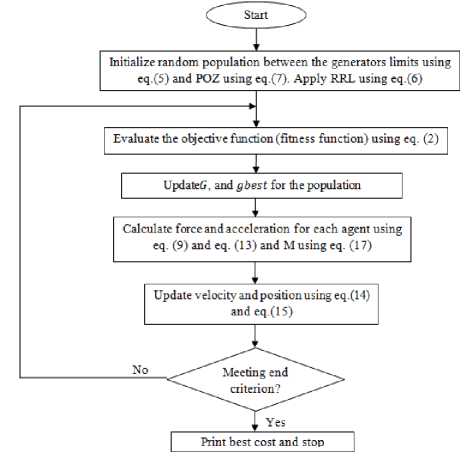
Fig. 1: Flow chart of PSOGSA approach for ELD
Step1: Search space identification
In this agents are randomly initialized and located between the minimum and maximum operating limits of generators. Each agent should satisfy the constraints given by “(3)” and “(5)”.
Step 2: Fitness evaluation
This evaluates fitness for each agent using “(2)” while constraints are satisfied. Update G and gbest for the population.
Step 3: Agent force calculation
In this total force acting on agent i in different dimensions is calculated using “(9)”.
Step 4: Evaluation of mass and acceleration of an agent
The acceleration of ith agent in d dimension is calculated using “(13)” and mass is calculated using “(17)”.
Step 5: Update velocity and position of agents
The next velocity of agent is calculated using “(14)” and position is updated using “(15)”.
Step 6: Stopping criteria
Repeat process 2 to 5 until stopping criteria is met.
In this paper maximum number of iterations is the stopping criteria. The step by step process involved to solve ELD problem using PSOGSA approach is shown with the help of flow chart in figure 1.
-
V. Case Studies and Numerical Results
-
5.1 Test case I: Six unit system
The system contains six generating units. The input data for this system is taken from [8]. The load demand is set as 1263 MW. In this system transmission loss, POZ and ramp rate limits are also considered. The experimental result obtained from PSOGSA approach, Hybrid SI based Harmony Search (HHS) [18], and Biogeography Based Optimization (BBO) [15] and Self-Organizing Hierarchical Particle Swarm
-
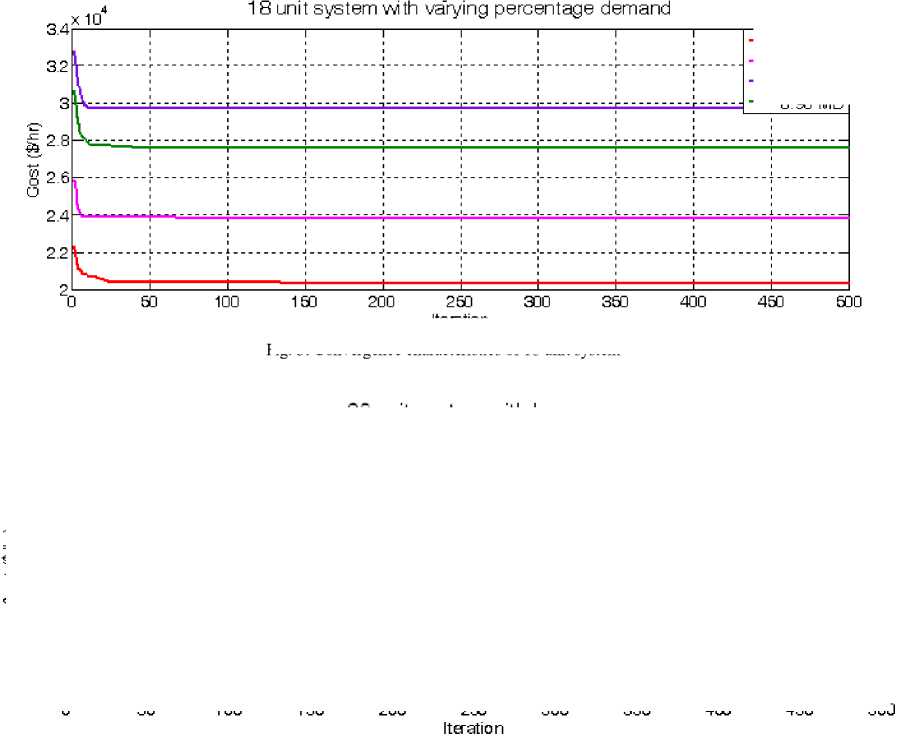
5.2 Test case II: Eighteen unit system
-
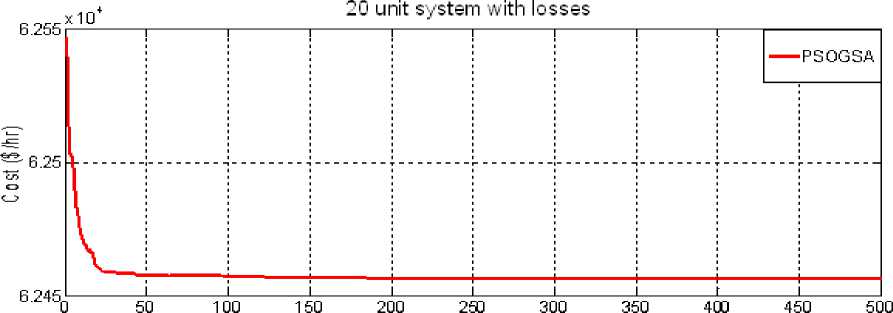
5.3 Test case III: Twenty unit system
The system contains twenty generating units with loss coefficients. The input data for this test system is taken from [11].The system load demand is 2500 MW. The obtained results in terms of optimum power output and power loss using PSOGSA approach has been compared with General Algebraic Modeling System (GAMS) [24], Biogeography Based Optimization (BBO) [15] and other methods are shown in Table 4. Convergence characteristic of the 20 unit system with loss is shown in (4).
-
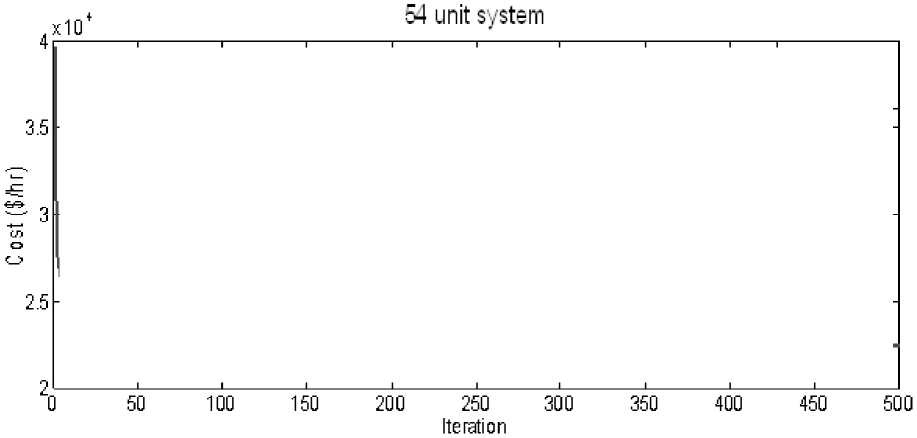
5.4 Test case IV: Fifty four unit system
A large scale IEEE 114 bus system consisting of 54 generating units is considered here. The load demand is set to 4242 MW. The input data for this system is taken from Dieu et al . 2012 [25]. The optimum power output achieved by PSOGSA is presented in Table 5. The minimum cost obtained is compared with Augmented Lagrange Hopfield Network (HN) [25], Differential evolution (DE) [25], particle swarm optimization (PSO) [25]. A convergence characteristic of 54 unit system is shown in (5).
To validate the effectiveness of hybrid PSOGSA approach, four standard test cases having different properties were considered. These are a 6 unit system with POZ and ramp rate limits, an 18 unit system with varying percentage of maximum demand, a 20 unit system with losses and a large scale 54 unit system. The algorithm is implemented in MATLAB 7.8 and the system configuration is Intel core i3 processor with 2.3GHz speed and 2GB RAM.
Optimization (SOH_PSO) [13] are shown in Table 1. (2) shows the convergence characteristic of the six unit system with ramp rate limits, POZ and losses.
This test case contains Crete Island system of 18 generating units. The input data for this test case is taken from [21], and the maximum power output for the system is 433.22MW. The simulations were carried out with varying percentage of maximum power demand. Their best solutions using PSOGSA are shown in Table 2. The result obtained from PSOGSA approach, simulated annealing (SA) [23], artificial bee colony (ABC) [22] and other techniques is listed in Table 3. The convergence characteristics for eighteen unit system obtained by PSOGSA approach is shown in (3).
|
Unit |
SOH-PSO |
BBO |
HHS |
PSOGSA |
|
Pg1 |
438.21 |
447.3997 |
449.9094 |
447.5144 |
|
Pg2 |
172.58 |
173.2392 |
172.7347 |
173.1461 |
|
Pg3 |
257.42 |
263.3163 |
262.9643 |
263.3337 |
|
Pg4 |
141.09 |
138.0006 |
136.03 |
138.9189 |
|
Pg5 |
179.37 |
165.4104 |
166.967 |
165.3541 |
|
Pg6 |
86.88 |
87.07979 |
86.8778 |
87.1269 |
|
O/P (MW) |
1275.55 |
1275.446 |
1275.4832 |
1275.3941 |
|
P loss |
12.55 |
12.446 |
12.4834 |
12.39404 |
|
Cost($/hr) |
15446.02 |
15443.0963 |
15442.8313 |
15442.3931 |
|
6 unit system with FiRL, POZ and losses |
||||||||||
|
PSOGSA |
||||||||||
|
5. S 1.55 1 545 |
||||||||||
|
1-Ы0 |
50 1 00 1 50 2 00 2 50 30 0 8 50 400 4 50 500 |
|||||||||
Iteration
Fig. 2: Convergence characteristics of 6 unit system
Table 2: Results for eighteen unit system using PSOGSA
|
Unit |
0.70*MD |
0.80*MD |
0.90*MD |
0.95*MD |
|
Pg1 |
15.0000 |
15.0000 |
15.0000 |
15.0000 |
|
Pg2 |
44.6316 |
45.0000 |
45.0000 |
45.0000 |
|
Pg3 |
25.0000 |
25.0000 |
25.0000 |
25.0000 |
|
Pg4 |
25.0000 |
25.0000 |
25.0000 |
25.0000 |
|
Pg5 |
25.0000 |
25.0000 |
25.0000 |
25.0000 |
|
Pg6 |
3.0000 |
3.0000 |
8.2149 |
13.7055 |
|
Pg7 |
3.0000 |
3.0000 |
8.2195 |
13.7069 |
|
Pg8 |
12.2800 |
12.2800 |
12.2800 |
12.2800 |
|
Pg9 |
12.2800 |
12.2800 |
12.2800 |
12.2800 |
|
Pg10 |
12.2800 |
12.2800 |
12.2800 |
12.2800 |
|
Pg11 |
12.2800 |
12.2800 |
12.2800 |
12.2800 |
|
Pg12 |
14.8842 |
20.7256 |
24.0000 |
24.0000 |
|
Pg13 |
3.0000 |
3.0000 |
3.1481 |
6.4138 |
|
Pg14 |
21.1318 |
30.8653 |
36.2000 |
36.2000 |
|
Pg15 |
23.2361 |
32.3543 |
42.4920 |
45.0000 |
|
Pg16 |
24.1260 |
33.2650 |
37.0000 |
37.0000 |
|
Pg17 |
24.1243 |
33.2458 |
43.3525 |
45.0000 |
|
Pg18 |
3.0000 |
3.0000 |
3.1510 |
6.4127 |
|
O/P(MW) |
303.254 |
346.576 |
389.898 |
411.5589 |
|
Min cost ($/hr) |
20386.2157 |
23855.2865 |
27653.7507 |
29731.0666 |
|
Avg. cost ($/hr) |
20386.2360 |
23855.28655 |
27653.7893 |
29731.0666 |
|
SD |
0.0372 |
0.0001 |
0.0253 |
0.0000 |
|
Time/Iter (sec) |
0.0280 |
0.0215 |
0.0187 |
0.0158 |
Table 3: Comparison of results (18 unit system MD=433.22MW)
|
Method |
0.70*MD |
0.80*MD |
0.90*MD |
0.95*MD |
|
λ_ Iteration |
20393.48 |
23861.58 |
27652.47 |
29731.05 |
|
Binary GA |
20444.68 |
23980.24 |
27681.05 |
29733.42 |
|
RGA |
20396.39 |
23861.58 |
27655.53 |
29731.05 |
|
ABC |
20391.60 |
23589.40 |
27653.60 |
29730.80 |
|
SA |
20386.309 |
23855.855 |
27653.78 |
29731.066 |
|
PSOGSA |
20386.2157 |
23855.2865 |
27653.75 |
29731.066 |
---0.70 "MD
---0.80 "MD
---0.95-MD
---0 90-MD
Iteration
Fig. 3: Convergence characteristics of 18 unit system
-
Fig. 4: Convergence characteristic of 20 unit system
Table 4: Result of 20 unit systems with losses
|
Unit |
BBO |
GAMS |
QGSO |
PSOGSA |
|
Pg1 |
513.0892 |
512.782 |
512.7303 |
512.7788 |
|
Pg2 |
173.3533 |
169.102 |
169.0263 |
169.0469 |
|
Pg3 |
126.9231 |
126.891 |
126.8806 |
126.8915 |
|
Pg4 |
103.3292 |
102.867 |
102.8723 |
102.8666 |
|
Pg5 |
113.7741 |
113.683 |
113.6836 |
113.6839 |
|
Pg6 |
73.06694 |
73.572 |
73.5741 |
73.5798 |
|
Pg7 |
114.9843 |
115.290 |
115.3037 |
115.2981 |
|
Pg8 |
116.4238 |
116.400 |
116.4090 |
116.4039 |
|
Pg9 |
100.6948 |
100.405 |
100.4303 |
100.4041 |
|
Pg10 |
99.99979 |
106.027 |
106.0581 |
106.0575 |
|
Pg11 |
148.977 |
150.239 |
150.2337 |
150.2512 |
|
Pg12 |
294.0207 |
292.766 |
292.7813 |
292.7548 |
|
Pg13 |
119.5754 |
119.114 |
119.1165 |
119.1124 |
|
Pg14 |
30.54786 |
30.832 |
30.8179 |
30.8350 |
|
Pg15 |
116.4546 |
115.805 |
115.8179 |
115.8097 |
|
Pg16 |
36.22787 |
36.254 |
36.2542 |
36.2548 |
|
Pg17 |
66.85943 |
66.859 |
66.8611 |
66.8649 |
|
Pg18 |
88.54701 |
87.971 |
87.9696 |
87.9650 |
|
Pg19 |
100.9802 |
100.803 |
100.8088 |
100.7982 |
|
Pg20 |
54.2725 |
54.305 |
54.3106 |
54.3083 |
|
P Loss |
92.1011 |
91.967 |
91.965 |
91.9654 |
|
O/P (MW) |
2592.1011 |
2591.967 |
2591.965 |
2591.9654 |
|
Min Cost ($/hr) |
62456.7926 |
62456.633 |
62456.6330 |
62456.63309 |
Table 5: Result of 54 units System
|
Unit |
PSOGSA |
Unit |
PSOGSA |
|
Pg1 |
30.0000 |
Pg30 |
80.0000 |
|
Pg2 |
30.0000 |
Pg31 |
46.4558 |
|
Pg3 |
30.0000 |
Pg32 |
30.0000 |
|
Pg4 |
30.0000 |
Pg33 |
20.0000 |
|
Pg5 |
150.0000 |
Pg34 |
20.0000 |
|
Pg6 |
156.0356 |
Pg35 |
100.0000 |
|
Pg7 |
30.0000 |
Pg36 |
88.2642 |
|
Pg8 |
100.0000 |
Pg37 |
150.0000 |
|
Pg9 |
30.0000 |
Pg38 |
30.0000 |
|
Pg11 |
30.0000 |
Pg39 |
234.5160 |
|
Pg12 |
100.0000 |
Pg40 |
212.3911 |
|
Pg13 |
124.5674 |
Pg41 |
20.0000 |
|
Pg14 |
30.0000 |
Pg42 |
50.0000 |
|
Pg15 |
30.0000 |
Pg43 |
100.0000 |
|
Pg16 |
69.8064 |
Pg44 |
196.1548 |
|
Pg17 |
30.0000 |
Pg45 |
100.0000 |
|
Pg18 |
86.6968 |
Pg46 |
20.0000 |
|
Pg19 |
30.0000 |
Pg47 |
58.1562 |
|
Pg20 |
30.0000 |
Pg48 |
86.0867 |
|
Pg21 |
92.5384 |
Pg49 |
20.0000 |
|
Pg22 |
108.1637 |
Pg50 |
50.0000 |
|
Pg23 |
100.0000 |
Pg51 |
100.0000 |
|
Pg24 |
100.0000 |
Pg52 |
100.0000 |
|
Pg25 |
132.5493 |
Pg53 |
100.0000 |
|
Pg26 |
77.0648 |
Pg54 |
50.0000 |
|
Pg27 |
100.0000 |
Min Cost ($/hr) Time/Iter (sec) |
22432.2510 0.0416 |
|
Pg28 |
100.0000 |
||
|
Pg29 |
156.8691 |
|
--PSOGSA |
||||||||||
-
Fig. 5: Convergence characteristic of 54 unit system
Parameter Selection
There are four important parameters in the hybrid PSOGSA algorithm: Gravitational constant (G0), acceleration coefficient (α), weighting factor (C1, C2) and population size (n). These parameters are selected in such a way that a smooth convergence behavior is ensured. To obtain the optimal values of these parameters a detailed study was carried out by varying these parameters. For each combination 20 trials have been made with maximum number of iterations set to 500 per trial. Performance of PSOGSA is analyzed for a large scale 54 generating unit ELD problem.
Table 6: Effect of weighing factor C1 and C2 on Case 4 (20 trials)
|
Case |
C1 |
C2 |
Min cost ($/hr) |
Avg cost ($/hr) |
Max cost ($/hr) |
SD |
|
1. |
1.0 |
1.5 |
22432.3168 |
22432.5327 |
22432.4247 |
0.1079 |
|
2. |
2.0 |
22432.3443 |
22436.2074 |
22434.2758 |
1.9315 |
|
|
3. |
2.5 |
22432.2529 |
22452.2598 |
22442.2563 |
10.003 |
|
|
4. |
1.5 |
1.5 |
22432.6282 |
22436.4184 |
22434.5233 |
1.8950 |
|
5. |
2.0 |
22432.2665 |
22432.3059 |
22432.2862 |
0.0196 |
|
|
6. |
2.5 |
22449.3487 |
22458.2204 |
22453.7845 |
4.4358 |
|
|
7. |
2.0 |
1.5 |
22432.2510 |
22432.3347 |
22432.2928 |
0.0418 |
|
8. |
2.0 |
22432.2674 |
22432.3018 |
22432.2846 |
0.0172 |
|
|
9. |
2.5 |
22432.2529 |
22432.2561 |
22432.2545 |
0.0016 |
|
|
10. |
2.5 |
1.5 |
22432.2709 |
22432.3706 |
22432.3207 |
0.0498 |
|
11. |
2.0 |
22432.2671 |
22432.2817 |
22432.2744 |
0.0073 |
|
|
12. |
2.5 |
22432.2641 |
22436.2362 |
22434.2501 |
1.9860 |
The optimum parameters are selected as follows: population size (n=10), gravitational constant (G0 ) =1 and acceleration coefficient (α)=10 are initially considered. To analyze optimum value of weighting factor c1 and c2; the values of C1 varied between 1.0 and 2.5 with a step increase of 0.5 and C2 is varied from 1.5 to 2.5 with a step increase of 0.5. The results of variation in C1 and C2 for obtaining minimum, maximum and average costs and the standard deviation for 20 trials are shown in Table 6. Best results were obtained when C1=2.0 and C2=1.5.
Table 7 lists the effect of acceleration coefficient α on the performance of the algorithm. Too large α is not capable in searching the minimum for the problem in addition to this it reduces the computational speed of the algorithm and increases standard deviation. For repeated 20 trial α=10 resulted in achieving optimal solution.
Table 7: Effect of α on 54 unit System (case 4, 20 trials)
|
Sr.No |
α |
Min cost ($/hr) |
Max cost ($/hr) |
Avg cost ($/hr) |
SD |
|
1. |
10 |
22432.2510 |
22432.3347 |
22432.2928 |
0.0418 |
|
2. |
100 |
22455.3955 |
22550.7479 |
22503.0717 |
47.6761 |
|
3. |
1000 |
23717.9908 |
23890.5514 |
23804.2711 |
86.2809 |
Table 8: Effect of population size on 54 unit system (case 4, 20 trials)
|
Sr.No |
n |
Min cost ($/hr) |
Max cost ($/hr) |
Avg cost ($/hr) |
SD |
|
1. |
50 |
22432.3948 |
22432.4233 |
22432.4085 |
0.0142 |
|
2. |
100 |
22432.2510 |
22432.3347 |
22432.2928 |
0.0418 |
|
3. |
150 |
22432.4186 |
22432.4223 |
22432.4204 |
0.0018 |
|
4. |
200 |
22432.3456 |
22432.7407 |
22432.5431 |
0.1975 |
Table 8 depicts the performance of PSOGSA algorithm for different population sizes. Test was carried out for repeated 20 trials with population size 50, 100, 150, 200.The study shows that too large population size makes the algorithm slow whereas with small population size average cost and standard deviation increases. Based on the simulation result it is concluded that n=100 gives minimum generation cost.
Table 9: Effect of G0 on 54 units System (case 4, 20 trials)
|
Sr.No |
G 0 |
Min cost ($/hr) |
Max cost ($/hr) |
Avg cost ($/hr) |
SD |
|
1. |
1 |
22432.2510 |
22432.3347 |
22432.2928 |
0.0418 |
|
2. |
50 |
22432.5305 |
22432.5980 |
22432.5642 |
0.0337 |
|
3. |
100 |
22432.4986 |
22432.8893 |
22432.6939 |
0.1953 |
|
4. |
150 |
22432.8355 |
22433.0643 |
22432.9499 |
0.1143 |
|
5. |
200 |
22432.7453 |
22433.2283 |
22432.9868 |
0.2414 |
Table 9 shows the effect of G 0 on the performance of hybrid PSOGSA algorithm. G 0 was varied from 1 to 200 with a step increase of 50. G0=1 gives minimum generation cost. Increase in G0 beyond this value does not produce any significant improvement rather it increases standard deviation.
After a numerous careful experimentation the following values of PSOGSA parameters for all cases have been used.
n=100, α=10, G 0 =1, C1=2.0, C2=1.5.
Comparative Study
-
A) Solution Quality
As seen in the Table 1, 4 and 5 the minimum cost achieved by PSOGSA approach is 15442.3930$/hr, 62456.63309$/hr, 22432.2510$/hr for test case I, III and IV. The minimum cost obtained for the test case II is listed in Table 2, 3 and the results are very close to the recent reported techniques. Over 20 repeated trials PSOGSA approach produce small standard deviation of evaluation values in all the test cases. Table 9, 11 and 12 shows that then average cost obtained by PSOGSA approach for the test case I, III and IV is less than the reported average cost of other methods. It is observed that PSOGSA provides better results as compared to other existing techniques.
Table 10: Comparison of convergence results for 6 unit System
|
Method |
Generation Cost ($/hr) |
S.D |
||
|
Max |
Min |
Avg. |
||
|
PSO |
15492 |
15450 |
15454 |
0.0002 |
|
GA |
15542 |
15459 |
15469 |
0.0570 |
|
NPSO-LRS |
NA |
15450 |
15450.5 |
NA |
|
ABF-NM |
NA |
15443.8164 |
15446.95383 |
2.58223 |
|
DE |
NA |
15449.766 |
15449.777 |
NA |
|
SOH-PSO |
15609.64 |
15446.02 |
15497.35 |
NA |
|
HHS |
15453 |
15449 |
15450 |
0.0420 |
|
BBO |
15443.096 |
15443.096 |
15443.096 |
NA |
|
Hybrid SI-based HS |
NA |
15442.8423 |
15446.7142 |
1.8275 |
|
PSOGSA |
15442.3962 |
15442.3930 |
15442.39423 |
0.0007 |
Table 11: Comparison of convergence result for 20 unit system
|
Method |
Generation Cost($/hr) |
||
|
Min |
Max |
Avg |
|
|
λ iteration |
62456.6391 |
NA |
NA |
|
Hopfield model |
62456.6341 |
NA |
NA |
|
BBO |
62456.7926 |
NA |
NA |
|
QGSO |
62456.6330 |
62456.63337 |
62456.6331 |
|
GAMS |
62456.633 |
NA |
NA |
|
PSOGSA |
625456.63309 |
62456.63310 |
62456.63311 |
Table 12: Comparison of convergence result for 54 unit system
|
Method |
Generation Cost($/hr) |
||
|
Min |
Max |
Avg |
|
|
DE |
25237 |
NA |
NA |
|
PSO |
23625 |
NA |
NA |
|
ALHN |
23368 |
NA |
NA |
|
PSOGSA |
22432.2510 |
22432.3347 |
22432.2928 |
-
B) Computational effciency
The statistical analysis in terms of minimum cost and average computational time is presented in Table 13 for test case I, III and IV. For repeated 20 trials minimum cost and average computational time is less and better than the mentioned methods. The results obtained are compared with the recent reported methods and shows the efficiency of algorithm.
Table 13: Comparison of Computational Efficiency
|
Test Case |
Method |
Min cost($/hr) |
Time /Iter (sec) |
|
6 unit system |
PSO |
15450 |
14.89 |
|
GA |
15459 |
41.58 |
|
|
NPSO-LRS |
15450 |
NA |
|
|
ABF-NM |
15443.8164 |
NA |
|
|
DE |
15449.766 |
0.0335 |
|
|
SOH-PSO |
15446.02 |
0.0633 |
|
|
HHS |
15449 |
0.14 |
|
|
BBO |
15443.096 |
0.0325 |
|
|
Hybrid SI-based HS |
15442.8423 |
0.9481 |
|
|
PSOGSA |
15442.3930 |
0.0420 |
|
|
20 unit system |
λ iteration |
62456.6391 |
0.033757 |
|
Hopfield model |
62456.6341 |
0.006355 |
|
|
BBO |
62456.7926 |
0.29282 |
|
|
QGSO |
62456.6330 |
NA |
|
|
GAMS |
62456.633 |
NA |
|
|
PSOGSA |
625456.63309 |
0.0497 |
|
|
54 unit system |
DE |
25237 |
282.4 |
|
PSO |
23625 |
136.4 |
|
|
ALHN |
23368 |
1.65 |
|
|
PSOGSA |
22432.2510 |
0.0416 |
-
C) Robustness
The search capability of heuristic algorithm can not be analyzed with a single trial because of its randomness. Therefore many trials are required with different initializations. Table 10, 11, 12 shows the minimum cost, maximum cost, average cost over 20 trials for 6 unit with RRL and POZ, 20 unit with losses and 54 unit system. The results show that PSOGSA is more consitent than other reported method as it provides lower average cost while satisfying the different constraints of the various test cases.
-
VI. Conclusion
In this paper hybrid PSOGSA algorithm based on the abilities of PSO and GSA is successfully employed to solve ELD problem. Here αci is used to accelerate the search space and gbest to exploit the best solution so far. The hybrid PSOGSA approach has been tested on four different standard test systems out of which first case is modeled using non linear characteristics like ramp rate limits and prohibited zone. A comparative study is carried out with the recent reported methods. From the results obtained it is seen that the PSOGSA approach affirms the effective high quality solution for ELD problem. The PSOGSA approach has the convergence speed faster than PSO and GSA. In future the algorithm can be use effectively to solve smooth and non- smooth constraint and complex ELD problem.
Acknowledgments
References Economic Load Dispatch by Hybrid Swarm Intelligence Based Gravitational Search Algorithm
- Wood A.J., Wollenberg B.F., Power Generation Operation and Control, New York: Wiley, 1984.
- Walter D.C., Sheble G.B., Genetic Algorithm Solution of Economic Load Dispatch with Valve Point Loading, IEEE Transcations on Power System, 1993 (8), 1325~1332.
- Wang, Shahidepour S.M., Effects of Ramp Rate Limits on Unit Commitment and Economic Dispatch, IEEE transcations on Power System, 1993, 8(3):1341~1350.
- Oreo S.O., Irving M.R., Economic Dispatch of Generators with Prohibited Opertaing Zones:A Genetic Algorithm Approach,IEE Proceedings, Generation, Transmission and Distribution, 1996,143(6).
- Chen C.L., and Wang S.C., Branch and bound scheduling for thermal generating units, IEEE Trans. On Energy Conversion, 1993, 8(2):184~189.
- K.Y. Lee, et al., Fuel cost minimization for both real and reactive power dispatches, IEE Proc. C, Gener. Trsns. & distr., 1984, 131(3): 85~93.
- Shoults R.R., A Dynamic Programming Based Method for Developing Dispatch Curves when Incremental Heat Rate Curves Are Non-Monotonically Increasing, IEEE Transcations on Power System, 1986,1,10~16.
- Gaing Z.L., Particle Swarm Optimization to Solving the Economic Dispatch Considering the Generator Constraints, IEEE Trans. On power systems, 2003,18(3):1187~1195.
- Sinha N., Chakrabarti R. and Chattopadhyay P.K., Evolutionary Programming Techniques for Economic Load Dispatch, IEEE Transcations on Evolutionary Computation, 2003,20(1):83~94.
- Noman Nasimul, Iba Hitoshi, Differential evolution for economic load dispatch problems, Electric Power Systems Research, 2008, 78:1322~1331.
- Ching-Tzong S., Chien-Tung L.,New approach with a Hopfield modeling framework to economic dispatch, IEEE Trans. Power Syst., 2000,15(2):541~545.
- Immanuel Selvakumar A., Thanushkodi K., A New Particle Swarm Optimization Solution to Nonconvex Economic Dispatch Problems, IEEE Trans. Power Syst., 2007, 22(1): 42~ 51.
- Chaturvedi K.T., Pandit M., Srivastava L.,Self-OrganizingHierarchical Particle Swarm Optimization for Non-Convex Economic Dispatch, IEEE Trans. Power Syst., 2008, 23(3): 1079~1087.
- Panigrahi B.K. and Pandi V.R., Bacterial foraging optimization nelder mead hybrid algorithm for economic load dispatch, IET Gener. Transm. Distrib., 2008, 2(4): 556~565.
- Bhattacharya A., Chattopadhyay P.K., Biogeography Based optimization for different economic load dispatch problems, IEEE Trans. Power Syst., 2010,25(2):1064~1077.
- Moradi-Dalvand M., Mohammadi-Ivatloo B., Najafi A., Rabiee A., Continuous quick group search optimizer for solving non-convex economic dispatch problems, electric power system research, 2012, 93: 93~105.
- Biswas A., Dasgupta S., Panigrahi B.K., Pandi V.R., Das S., Abraham A., Badr Y., Economic load dispatch using a chemotactic differential evolution algorithm, Hybrid Artificial Intelligence Systems, 2009,5572, 252~260.
- Pandi V.R., Panigrahi B.K., Bansal R.C., Das S., Mohapatra A., Economic Load Dispatch Using Hybrid Swarm Intelligence Based Harmony Search Algorithm, Electric Power Components and Systems, 2011,39(8): 751~767.
- Xin-She Yang, Seyyed Soheil Sadat Hosseinib, Amir Hossein Gandomic, Firefly Algorithm for solving non-convex economic dispatch problems with valve loading effect, Applied Soft Computing, 2012,12, 1180~1186.
- Mirjalili S, Mohd Hashim S Z, A new Hybrid PSOGSA Algorithim for Function Optimization, IEEE International Conference on Computer Information and application (ICCIA 2010), China , 2010, 374~ 377.
- Ioannis G., Damousis, Anastasios G. Bakirtzis and Petros S. Dokopoulos, Network-Constrained Economic Dispatch Using Real-Coded Genetic Algorithm. IEEE Trans on power system, 2003, 18(1):198~204.
- Dixit Gaurav Prasad, Dubey Hari Mohan, Pandit Manjree, Panigrahi B.K., Economic Load Dispatch using Artificial Bee Colony Optimization. International Journal of Advanced in Electronics Engineering. 2011, 129~124.
- Vishwakarma Kamlesh Kumar, Dubey Hari Mohan, Pandit Manjaree, Panigrahi B.K., Simulated annealing approach for solving economic load dispatch problems with valve point loading effects, International Journal of Engineering Science and Technology, 2012, 4(4): 60~72.
- Bisen Devendra, Dubey Hari Mohan, Pandit Manjaree and Panigrahi B. K., Solution of Large Scale Economic Load Dispatch Problem using Quadratic Programming and GAMS: A Comparative Analysis, Journal of Information and Computing Science(jic.org.uk), 2012,7(3): 200~211.
- Dieu V.N., Schegner P., Real Power Dispatch on Large Scale Power Systems by Augmented Lagrange Hopfield Network, International Journal of Energy Optimization and Engineering, 2012,1(1):19~38.
