Educational data mining: a case study perspectives from primary to university education in Australia

Author: B.M. Monjurul Alom, Matthew Courtney
Journal: International Journal of Information Technology and Computer Science @ijitcs
Article in issue: 2 Vol. 10, 2018.
Free access
At present there is an increasing emphasis on both data mining and educational systems, making educational data mining a novel emerging field of research. Educational data mining (EDM) is an attractive interdisciplinary research domain that deals with the development of methods to utilise data originating in an educational context. EDM uses computational methodologies to evaluate educational data in order to study educational questions. The first part of this paper introduces EDM, describes the different types of educational data environments, diverse phases of EDM, the applications and goals of EDM, and some of the most promising future lines of research. Using EDM, the second part of this paper tracks students in Australia from primary school Year 1 through to successful completion of high school, and, thereafter, enrolment in university. The paper makes an assessment of the role of student gender on successive rates of educational completion in Australia. Implications for future lines of enquiry are discussed.
Data mining, Clustering, Pattern Analysis, Educational systems, Web mining, Web-based educational systems, Classification
Short address: https://sciup.org/15016230
IDR: 15016230 | DOI: 10.5815/ijitcs.2018.02.01
Text of the scientific article Educational data mining: a case study perspectives from primary to university education in Australia
Published Online February 2018 in MECS DOI: 10.5815/ijitcs.2018.02.01
The field of Data Mining is concerned with finding new patterns in large amounts of data. Widely used in Business, it has had a scarce or limited application to the research field of Education. Of course, Data Mining is often applied to the business of education, for example, identification of alumni that are likely to make larger donations. Educational Data Mining (EDM) refers to techniques, tools, and research designed to automatically extract meaning from large repositories of data generated by or related to people's learning activities in educational settings. EDM is an evolving discipline concerned with developing approaches for discovering relationships in the unique and increasingly large-scale data that come from educational domains, and using such approaches to better understand student behavior and learning.
EDM discovers patterns and makes predictions that characterize learner behavior and achievement, domain content knowledge, assessment outcomes, educational functionalities, and applications. For example, learning management systems (LMSs) track information such as when each student accessed each learning object, how many times they accessed it, and how many minutes the learning object was displayed on the user's computer screen. As another example, intelligent tutoring systems record data every time a learner submits a solution to a problem; such systems collect the time of the submission, whether or not the solution matches the expected solution, the amount of time between submissions, the order in which solution components were entered into the interface, etc. The scope and precision of this data is such that even a fairly short session with a computer-based learning environment (e.g., 30 minutes) may produce a large amount of process data for analysis. In other cases, the data is less fine-grained. For example, a student's university transcript may contain a temporally ordered list of courses taken by the student, the grade that the student earned in each course, and when the student selected or changed his or her academic major.
EDM makes use of both highly detailed and limited data to discover meaningful information about different types of learners, how they learn, the structure of domain knowledge, and the effect of instructional strategies embedded within various learning environments. These analyses provide new information that would be difficult to discern by simply looking at the raw data. For example, analyzing data from an LMS may reveal a relationship between the learning objects that a student accessed during the course and their final course grade. Similarly, analyzing student transcript data may reveal a relationship between a student's grade in a particular course and their decision to change their academic major. Such information provides insight into the design of learning environments, which allows students, teachers, school administrators, and educational policy makers to make informed decisions about how to interact with, provide, and manage educational resources.
The purpose of this paper is to synthesize and share our various experience in using Data Mining for Education, and to contribute to the emergence of conventional directions. This paper describes the common sources of data, key objectives of EDM, phases of EDM, and recent findings in educational data mining. To provide a worked example, we make use of educational datasets provided by the Australian Bureau of Statistics by analyzing the patterns of success (and failure) of students and and providing insight into the possible steps that could be taken to improve outcomes.
-
II. Formatting Common Sources of Data
The educational environments from which such data is drawn are varied but generally include traditional education systems (e.g., state- or nationwide-databases), particular web-based courses or programs (e.g., , popular learning content management systems (e.g., , and adaptive and intelligent web-based educational systems (e.g., [1]. Basically, EDM can be applied to a range of instances in which learner behaviors are tracked and archived en masse, and where the analysis of such data provides insights into cognitive processes and patterns of learning.
-
III. Key Objectives of EDM
Although the general goal of EDM is to better understand how students learn, it can be generally oriented in different ways to inform student, teacher, administrative, and research stakeholders [1].
When students are the focus, the goal of EDM is to make use of data to present appropriate tasks, learner activities, and resources aimed at optimizing student learning. For example, in real-time, adaptive and intelligent web-based educational systems use estimates of student ability, and incorporate preferences and goals to present the most appropriate learning material [2]. More generally, recommendations can also be made to students about what behaviors might be beneficial (or detrimental) to learning and engagement in general, for example, course sequencing, usage of university services, behaviours online and on social media, etc. [1].
When teachers are the focus, the objective is to obtain feedback on the content, delivery, and structure of learning. Such feedback may identify common misinterpretations and irregular patterns of learning and enable teaching staff to refine instructional methods. Examples here might include using feedback to determine optimal instructional sequences to support student learning [3].
When administrative staff are the focus, educational data might inform the optimization of learning management systems and servers, user interfaces, and contribute to an understanding of student attendance and retention. An example here may be to draw upon data in a university learning management system to create statistical models that predict student engagement and retention.
Researchers can also be the focus of EDM. In addition to carrying out work in any of the areas outlined above, researchers specializing in the field develop and assess data mining techniques for their effectiveness.
-
IV. Phases of EDM
The field of EDM continues to evolve along with the wide variety of data mining techniques designed to inform the educational environments. Ultimately, the objective is to process meaningful information about learning for the purpose of continual pedagogical improvement. Accordingly, EDM has been broken into four phases [4]. In the first phase, relationships between data are discovered by using statistical techniques such as classification, regression, clustering, factor analysis, social network analysis, association rule mining, and sequential pattern mining [4]. In the second phase, the relationships are then theoretically validated. In the third phase, the validated relationships are used to make predictions about phenomena in future learning contexts. In the final phase, these predictions are used to support pedagogical and policy-level decisions for the purpose of improved student outcomes.
-
V. Recent Findings in EDM
There are a number of recent studies that help define the scope of possibilities in EDM. Here we provide a summary of two such studies: one uses student behavioural data from an LMS, while the other uses student survey data to predict students’ final grades. He [5] makes use of online student-instructor and studentstudent (peer) interactional data from 138 university courses that use a live video streaming system (LVS) of instruction. All interactional data was gleaned while the lectures were being streamed. By way of data and text mining techniques, He identified central themes associated with student-instructor and student-student interactions, and major disciplinary differences in frequency of interaction. Interestingly, He identified substantive positive correlations between the frequency of student-instructor interactions and grades, but substantive negative correlations between the frequency of peer interactions and grades. As part of the implications of the findings, He suggested instructors more consistently use the platform to interact with students, and use data from the LVS to identify and contact students who interact less during the initial phases of the course.
Saa [6] conducts EDM to explore the multiple factors theoretically assumed to affect student performance in higher education. Via student surveying, Saa [6] generated a dataset that included student characteristics relating to gender, nationality, prior school achievement, parental job statuses, use of student discount advantages, and end-of-semester grades. The author tested a number of decision tree algorithms that proved useful in predicting students’ end-of-semester grades. Saa [6] also used naïve Bayes classification to mine for relationships among variables. Interestingly, analysis revealed that those with better high school grades, females, and those whose mothers were engaged in work were also more likely to achieve better grades at the conclusion of the semester.
While much work in EDM has been undertaken using data from web-based courses, learning management system, and large-scale surveys, less work has been done using traditional state-wide education system data. The following section details our work in this field.
-
VI. Experimental Results
-
A. Background of educational system in Australia
-
B. Research Questions
The purpose of this example is to use the most up-to-date Australian education data to assess the extent of differential outcomes in male and female completion rates from 2004 to 2015 (Year 1 to 12), and to estimate the number of Year 12 students entering university thereafter in 2016. With these goals in view, the following four research questions (RQs) are posited:
RQ1: What role does student gender play in the comparison between commencing students in 2004 and completing students in 2015?
RQ2: What role does student state play in the comparison between commencing students in 2004 and completing students in 2015?
RQ3: What states appear to have the most equitable outcomes?
RQ4: How does the total number of students completing Year 12 in 2015 compare to those commencing university in 2016?
-
C. Analysis Tools
Many open source data mining suites are available such as the Wilson Calculator [12], R, Tanagra, Weka, KNIME, Orange, and Rapid miner. We have used the data mining software programs called Wilson Calculator [12], and ‘Orange’ for data analysis. The Wilson Calculator [12] is a practical meta-analysis effect size calculator, and Orange is a provides visualization and predictive modelling solutions for given datasets. Orange is a component-based visual programming software for data mining, machine learning, and data analysis. The datasets used in the analysis are publically available and were downloaded from the Australian Bureau of Statistics website [7] in excel format. Data preparation involved the reformatting of these data into conventional data structures necessary for analysis in Orange. This involved correctly assigning numeric data to the appropriate attribute defined by each column in csv format presented in the example, Table A in the Appendix. There are 8 columns in Table A. The first column, State, represents all the states in Australia. Each row of that column represents total commencing students in the year 2004 and school finishing students in 2015 for every state. The second column describes the total number of commencing students in Year 1 in 2004, and, in the row directly below, how many students completed Year 12 in 2015. The third and fourth columns present the total number of male and female students amongst all the students in each corresponding state for that year. The percentage of males and females are presented in the fifth and sixth column. The columns Year and Grade represent the commencing year (2004) of the students in Year 1 and the completion year of the students in Year 12 (2015). For this example, we utilize the data visualization process to present results. With this process, relative frequencies are measured according to the identification of male and female students. Scatter plot techniques are also used to measure the student’s success from enrollment to finishing high school according to each state of the country.
-
VII. Data Analysis Procedures
To answer RQ1, concerning the role that gender plays in the comparison between commencing and completing students for the period, we use the Wilson calculator [12] (2 by 2 frequency; probit estimation) to determine the effect size (Cohen’s d) and the level of statistical significance associated with the shortfall of male completion. Concerning the role that the state plays in the comparison between commencing and completing students for the period, we also use the Orange visualization tool, to answer RQ1.
To answer RQ2, concerning the role that the state plays in the comparison between commencing and completing students for the period, we use the Orange visualization tool. The following instructions provide the reader how to carry out this procedure.
After downloading and opening the Orange Data Mining tool [8], the first step is to link the csv data file to the Orange program. Once the data file is connected, all analysis and visualization techniques can be carried out by selecting the appropriate option (Figure 1). We have used visualize process to create the graphs (see first option under Data). Under visualization we have used distribution and the scatter plot technique to draw the graph that is presented in Figure 2, and Figure 3 respectively. To note, there are various options for data mining in Orange: within the Classify option, you can choose to identify nearest neighbors; within the Regression option, uni- or multi-variate regression; under evaluate, predictions; and under unsupervised, write your own analysis.
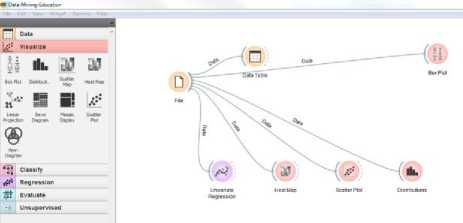
Fig.1. View of Visualisation Options Available in Orange.
To answer RQ3, concerning gender equitableness by state, we calculate the percentage males and the percentage of females completing Year 12 ([ N 2004 – N 2015 ] * 100). Using this approach, we can account for asymmetric immigration over the 2004 to 2015 period (the assumption here is that the number of male and female immigrant students would be relatively equal across states). After carrying out this procedure, the states can be tabulated and ranked by the percentage of more females completing Year 12.
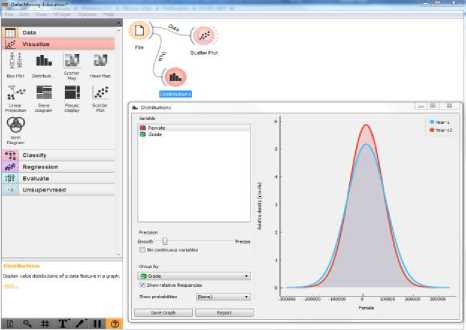
Fig.2. The Selection of the Distribution Technique in Orange.
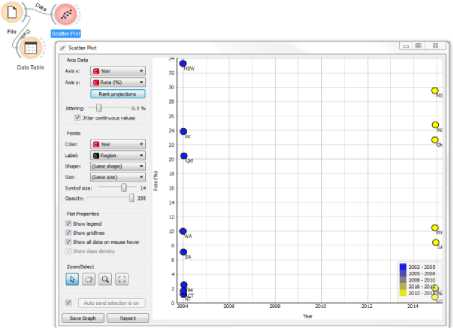
Fig.3. The Selection of the Scatterplot Technique in Orange.
To answer RQ4, concerning the number of completing students in 2015 and the number of commencing university students in 2016, we use simple deductive logic based on numbers reported by the Bureau of Statistics to estimate congruence between the number of students completing Year 12 (2015) and those commencing university in 2016. We also illustrate the percentage of students entering each discipline in 2016 using a basic Excel graphing function.
RQ1: On the Role of Gender in Commencing and Completing Students, 2004-2015.
Based on data made available from the Australian Bureau of Statistics [7], the total number of domestic students commencing primary school in 2004 was 263,413, presented in Table 1, whilst the total number completing Year 12 was estimated at 233,358. These numbers can be broken down by gender. A total 135,199 males commenced Year 1 in 2004, whilst 114,545 completed Year 12 in 2015 (shortfall of 20,654). In addition, 128,214 females commenced Year 1 in 2004, whilst 118,812 completed Year 12 in 2015 (shortfall of 9,402). In accordance with the procedures outlined in the Analysis subsection of this paper, the overall effect of being male is estimated at d = -0.43 ( p < .001) (medium sized) [9]. We can see that the rate of incompletion is more among the male population. Conversely, the completion or success rate is comparatively higher amongst female students. The results are represented visually in Figure 2.
RQ2: On the Role of State for Commencing and Completing Students, 2004-2015.
In accordance with the procedures outlined, the scatterplot in Figure 5 was generated. We note that for most states, the 2015 completion numbers were higher than the 2014 commencement numbers.
RQ3: On the Role of State for Gender Equity Outcomes, 2004-2015.
In accordance with the procedures outlined, the estimates of % Higher female completion were generated. Results suggest that in the state of Victoria there is a larger discrepancy in male-female completion (10.2%), whilst in the Australian Capital Territory, this discrepancy is smaller at 2.5%.
Table 1. Commencing Students in Year 1(2004) and Completing Students in Year 12 (2015) by State and Gender
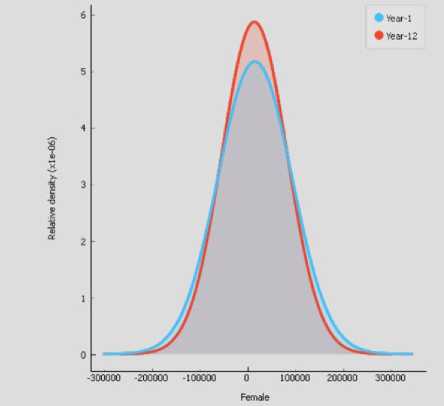
Fig.4. Distribution of completion status for female Student.
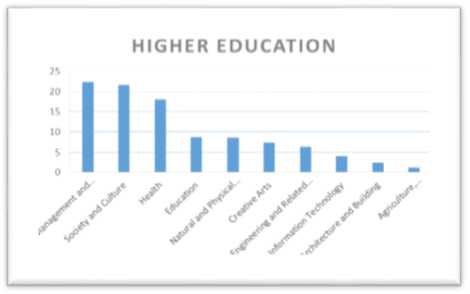
Fig.6. The trend of higher education (2016) in Australia.
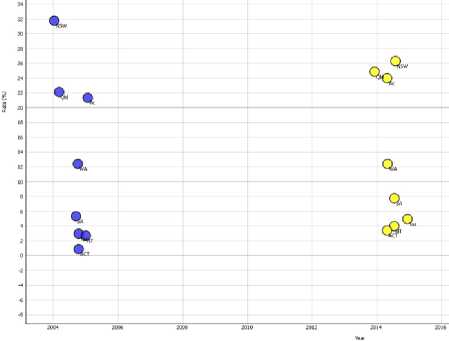
Fig.5. Distribution of Total Student Success by State.
The first column in Table 3 is Field of Education which describes the domain of education selected by the students at the university level in 2016 in Australia. The percentage of the students on the domain of education are presented in the second column. The third column represents the percentage changed in the student’s preference of higher education from 2015 to 2016. Based on data made available from the Australian Bureau of Statistics [7], we know that 233,358 students completed Year 12 in 2015. In addition, concerning the numbers enrolled in higher education in 2016, the bureau reports that, 74% of the students are undergraduate, with 76% of student identified as domestic, and 34% identified as commencing students (first year). With these numbers, it is estimated (see note, Table 2) that 238,932 undergraduate university students commenced their studies in 2016. Figure 6, represents the trend of higher education (2016) in Australia where students have the highest numbers in management and commerce. On the other hand, agriculture has the least popular among the students.
RQ4: On Completion and Continuation into Higher Education.
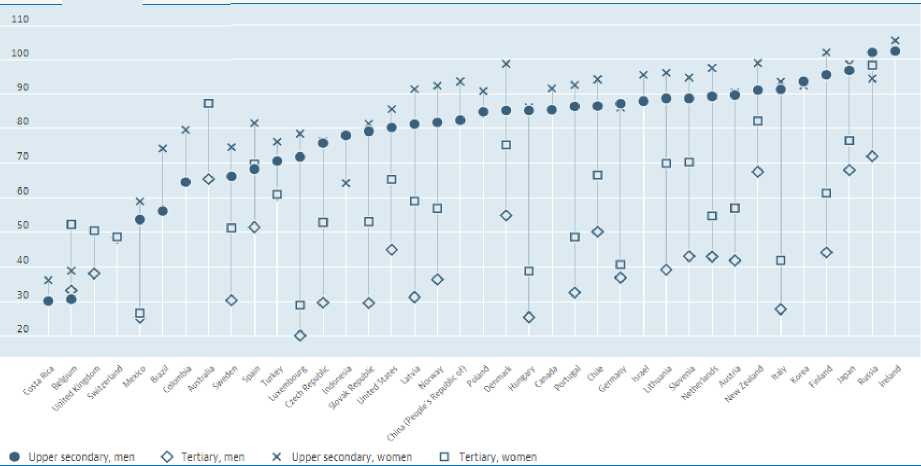
Fig.7. Percentage of Graduation rate for men and women on different countries, 2015 [20].
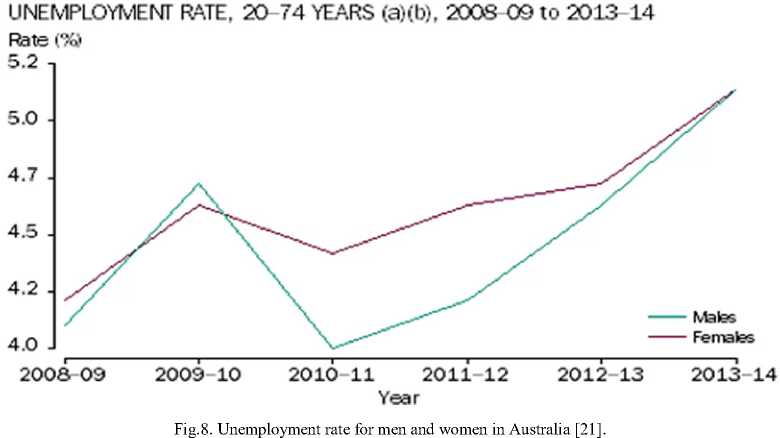
(a) Data were averaged using 12 months in the financial year, (b) For release gender indicator, Australia, labour force estimates dating back to 200102 have been revised in accordance with a new benchmarking process.
-
VIII. Discussion
The tracking of an Australian population of students from commencement of primary school to completion of Year 12 is, to this point in time, an unfeasible task. With this approach not possible, we can make use of aggregate numbers reported by the Australian government. When the commencing students (2004: 263,413 students) and completing students (2015: 233,358) are broken down by gender groups, we begin to see a moderate discrepancy in outcomes—results suggest that males tend to disproportionately drop out. This level of disproportion appears to be unequally distributed across states. It appears that, in the longer term, the state may be lacking on the equity with a seemingly large proportion of boys not continuing through to completion in Year 12. Of course, more research is necessary in this area to confirm these early results.
In terms of completion of Year 12 and commencement into university, the numbers are promising. Compared to the number of Year 12 students eligible for entrance into university, the estimates suggest that at least an equal or larger number of students are entering higher education. Of course, the proportion of students returning from a gap year and students defined as adult students would need to be considered when reviewing these numbers.
From figure 7, Graduation rate represents the estimated percentage of people who will graduate from a specific level of education over their lifetime. Data are broken down by gender and shown for three levels of education: upper-secondary; post-secondary, non-tertiary and tertiary excluding doctoral level presented in [20]. From the figure 7, it is clearly evident that completion rate of female students are more than male students on different countries on different education level.
Table 2. Commencing Undergraduate Students in 2016
|
Student Demographic |
% |
N |
|
Under-graduate/Post-graduate |
||
|
Undergraduate |
74 |
924,670 |
|
Post-graduate |
26 |
324,884 |
|
Total |
100 |
1,249,544 |
|
Domestic/overseas students |
||
|
Domestic |
76 |
949,653 |
|
Overseas |
24 |
299,893 |
|
Total |
100 |
1,249,544 |
Completing and commencing domestic students
|
Total Year 12 Completers |
- |
233,358 |
|
Total Commencing 2016 |
34 |
238 932 |
|
Undergraduates |
Note. Undergraduate students include enabling & non-award students; total number of under-graduate domestic students commencing in 2016 estimated by: (1,249,544) * (74/100) * (76/100) * (34/100) =238,932 (estimate made from data provided by Australian Government Department of Education and Training, [11]).
Table 3. Commencing students by broad fields of Higher Education in 2016 [10]
|
Field of Education |
% of all students |
% change 2015-16 |
|
Management and Commerce |
22.4 |
3.3 |
|
Society and Culture |
21.7 |
1.7 |
|
Health |
18.1 |
5.0 |
|
Education |
8.7 |
-3.6 |
|
Natural and Physical Sciences |
8.5 |
7.1 |
|
Creative Arts |
7.3 |
-0.2 |
|
Engineering and Related |
63 |
23 |
|
Technologies |
||
|
Information Technology |
4.1 |
13.2 |
|
Architecture and Building |
2.4 |
6.6 |
|
Agriculture, Environmental and |
||
|
Related Studies |
From figure 8, it is clearly evident that unemployment rate of women are more than men [21] in Australia. On the other hand it can be stated that men are more employed than women, which could be one of the major reason that the rate of incompletion is more among the male population. Conversely, the completion or success rate is comparatively higher amongst female students
-
IX. Conclusions
Drawing on publically-available statistical data, we demonstrate how to use the statistical software programs, the Wilson Calculator [12] and Orange, to answer our four research questions pertaining to student completion and commencement in Australia. Our results suggested that gender played an important role, especially in some states, and that, in general, enrolment numbers in university in 2016 appeared to be on par with those completing Year 12 in 2015.
Further to the lines of enquiry undertaken herein, future studies could look at the factors that might affect the differential completion rates among male and female students in the different states in Australia. It would also be useful for account for socio-economic effects when assessing the influence of gender in future studies.
Appendix A Appendix Title
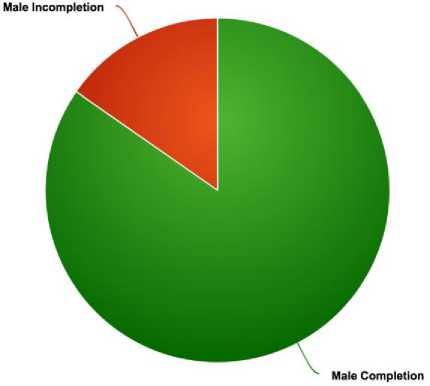
Fig.A1. Australian Male Completion 2004-2015.
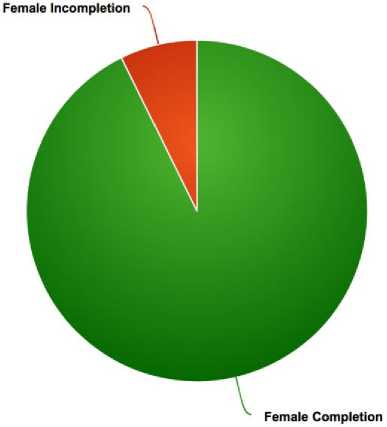
Fig.A2. Australian Female Completion 2004-2015.
Table A. Commencing students in Year-1(2004) and completing in Year-12 (2015) for different states
|
State |
Total |
Male |
Female |
M (%) |
F (%) |
Year |
Gr. |
|
NSW |
87736 |
44735 |
43001 |
51.0 |
49.0 |
2004 |
1 |
|
NSW |
68568 |
33196 |
35372 |
48.4 |
51.6 |
2015 |
12 |
|
Vic |
63114 |
32639 |
30475 |
51.7 |
48.3 |
2004 |
1 |
|
Vic |
57392 |
28070 |
29321 |
48.9 |
51.1 |
2015 |
12 |
|
Qld |
54115 |
27763 |
26352 |
51.3 |
48.7 |
2004 |
1 |
|
Qld |
52829 |
26514 |
26315 |
50.2 |
49.8 |
2015 |
12 |
|
SA |
18614 |
9492 |
9122 |
51.0 |
49.0 |
2004 |
1 |
|
SA |
19194 |
9335 |
9859 |
48.6 |
51.4 |
2015 |
12 |
|
WA |
26033 |
13492 |
12541 |
51.8 |
48.2 |
2004 |
1 |
|
WA |
24119 |
11967 |
12152 |
49.6 |
50.4 |
2015 |
12 |
|
Tas |
6261 |
3214 |
3047 |
51.3 |
48.7 |
2004 |
1 |
|
Tas |
4823 |
2330 |
2493 |
48.3 |
51.7 |
2015 |
12 |
|
NT |
3200 |
1678 |
1522 |
52.4 |
47.6 |
2004 |
1 |
|
NT |
1765 |
858 |
907 |
48.6 |
51.4 |
2015 |
12 |
|
ACT |
4340 |
2186 |
2154 |
50.4 |
49.6 |
2004 |
1 |
|
ACT |
4668 |
2275 |
2393 |
48.7 |
51.3 |
2015 |
12 |
Note. NSW = New South Wales; Vic = Victoria; Qld = Queensland;
SA = South Australia; WA = Western Australia; Tas = Tasmania; NT = Northern Territories; ACT = Australian Capital Territory; M(%)=male percent; F(%)=female percent; Gr.=grade.
References Educational data mining: a case study perspectives from primary to university education in Australia
- C. Romero, and S. Ventura. Educational data mining: A survey from 1995 to 2005. Expert systems with applications. vol. 33(1), pp. 135-146, 2007.
- P. Brusilovsky, and C. Peylo. Adaptive and intelligent web-based educational systems. International Journal of Artificial Intelligence in Education (IJAIED). Vol. 13, pp. 159-172, 2003.
- R. Baker, and K. Yacef. The state of educational data mining in 2009: A review and future visions. Journal of Educational Data Mining (JEDM). Vol. 1, pp.3-17, 2009.
- R. Baker, and K. Yacef. Data Mining for Education. International Encyclopedia of Education. Vol. 7, pp. 112-118, 2010.
- W. He. Examining student’s online interaction in a live video streaming environment using data mining and text mining. Computers in Human Behavior. Vol. 29(1), pp. 90-102, 2013.
- A. Saa. Educational data mining and student’s performance prediction. International Journal of Advanced Computer Science and Applications. vol. 7(5), pp. 212-220, 2016.
- Australian Bureau of Statistics (2016). Education. Retrieved from http://www.abs.gov.au/education.
- https://orange.biolab.si/download
- J. Hattie. Visible learning: A synthesis of over 800 meta-analyses relating to achievement. Routledge, New York; 2009.
- Australian Government Department of Education and Training (2017). 2016 first half of year infographic. Retreived from https://docs.education.gov.au/system/files/doc/other/2016firsthalfyearinfographic.ods
- Training, D. o. E. a. (2017). https://www.education.gov.au
- Wilson Calculator (2017). 2 by 2, probit estimator. Retrieved from https://www.campbellcollaboration.org/escalc/html/EffectSizeCalculator-SMD9.php
- B. Azarnoush, J. Bekki, G. Runger, B. Bernstein, and R. Atkinson. Toward a framework for learner segmentation. Journal of Educational Data Mining (JEDM). Vol. 5(2), pp. 102-126, 2013.
- M. Bienkowski, M. Feng, and B. Means. Enhancing teaching and learning through educational data mining and learning analytics: An issue brief. US Department of Education, Office of Educational Technology. vol. 1, pp.1-57, 2012.
- R. Hirshhorn. Assessing the economic impact of copyright reform in the area of technology-enhanced learning. Industry Canada; Ottawa; 2011.
- R. Jindal, M. Borah. A survey on educational data mining and research trends. International Journal of Database Management Systems. vol. 5(3), pp. 53-73, 2013.
- A. Peña-Ayala. Educational data mining: A survey and a data mining-based analysis of recent works. Expert systems with applications. vol. 41(4), pp. 1432-1462, 2014.
- C. Romero, and S.Ventura. Educational data mining: a review of the state of the art. IEEE Transactions on Systems, Man, and Cybernetics, Part C (Applications and Reviews). 2010;40(6), 601-618.
- P. Thakar. Performance analysis and prediction in educational data mining: a research travelogue. International Journal of Computer Applications. vol. 110(15), pp. 60-68, 2016.
- https://data.oecd.org/eduatt/graduation-rate.htm#indicator-chart
- https://www.businessinsider.com.au/australian-men-and-women-are-equally-unemployed-and-8-other-new-gender-indicators-from-the-abs-2014-8
