EEG based cognitive workload classification during NASA MATB-II multitasking

Author: Sushil Chandra, Kundan Lal Verma, Greeshma Sharma, Alok Mittal, Devendra Jha
Journal: International Journal of Cognitive Research in Science, Engineering and Education @ijcrsee
Section: Original research
Article in issue: 1 vol.3, 2015.
Free access
Short address: https://sciup.org/170198441
IDR: 170198441
Text of the article EEG based cognitive workload classification during NASA MATB-II multitasking
Cognitive Workload is defined as the load generated due to processing of multiple activities (or sub activities of a task) by the human brain in the time domain. In our context, it depends on how efficiently there is an interaction between operator’s resource capabilities and computer/machine on which the tasks have to be displayed. When the operator’s workload is at the peak, then a properly
Corresponding Author
Greeshma Sharma, Research Fellow
Bio Medical Engineering Department,
Institute of Nuclear Medicine and Allied Sciences, DRDO, Delhi.
designed automation task can reduce workload or maintain its optimal level ( Kramer, 1991 ). Workload assessment of operator during task can offload some of his tasks to the machine with the help of smart system design. For designing of such system, psychological and physiological aspects are carefully assessed for finding out suitable combination that can provide optimum utilization of human resource with the machine. In this research paper, we tried to identify EEG channels with the best feature that could give a maximum classification of workload. It also included feature identification without adding any classifiers. There are three methods to assess the cognitive workload, i.e. task score, subjective score and spectral features of the EEG ( Wickens, 1988 ). Workload assessment through giving a questionnaire about a task makes subjective judgments about the task ( Reid and Nygren, 1988 ). Multi Attribute Task Battery (MATB-II) was used for workload assessment in two modes, LWL and HWL. It was used for multitasking as well as for workload assessment ( Singh, A. L., Tiwari, T., Singh, I. L, 2010 ; Singh, I. L., Sharma, H., Singh, A. L., 2005 ). Advantage of choosing MATB over others were its qualification for providing objective and subjective scoring along with different level of workload ( Hart and Staveland, 1988 ).
Different Attentional demands like to divide attention which is generated by a task change pattern of subjective workload and its psychological impacts (Mazloumi, Kumashiro, Izumi, and Higuchi, 2010). There is a nonlinear relation between workload and performance (Gawron, 2000). Therefore, we didn’t rely completely on subjective & objective scores; we included electrophysiological (EEG) factors also (Gevins and Smith, 2003). There are a lot of research articles that show significant relationships between EEG parameters like engagement indices and performance both in fields and off fields (Berka et al., 2007; Freeman, Mikulka, Scerbo and Scott, 2004; Mikulka, Scerbo and Freeman, 2002). EEG analysis is performed using classically defined frequency bands alpha (8-12 Hz), beta (13-22 Hz), delta (23-30 Hz), theta (5-7Hz) and gamma (30-70 Hz) (Dickson, 2005; Dorneich, Ververs, Mathan and Whitlow, 2005) or sometimes it can be analyzed using some ratio of frequency bands, Prinzel et al (2000) developed an EEG-engagement index based on beta power divided by alpha power plus theta power. A feed forward neural network based on back propagation algorithm was used to classify the workload into NWL, LWL and HWL among 14 channels in MATLAB 2012.
The objective was (i) Comparison among input features to determine their qualifications as a workload level discriminating factor. Here input features included objective scores, subjective scores and EEG features. (ii) To determine the most suitable input feature that can be used in designing human-machine load balancing logic for an automated operator. It was based on statistical parametric testing that gave output with significance.
2. MATERIALS AND METHODS
-
A. Procedure
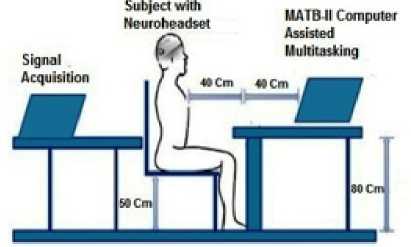
Subjects (n=10, age group 20-30 years, all male and right handed) from the Institute of Nuclear Medicine and Allied Science, New Delhi were invited to perform NASA‘s MATB-II pilots multitasking tasks, which had no prior experience of MATB like piloting tasks. Consent was taken from all subjects to participate in this project. They were required to fill a questionnaire to build their general profile. Each subject was well trained with the MATB-II software at the beginning of the testing as per given module of MATB-II software ( Fairclough and Venables, 2010 ; Fairclough, Venables, and Tattersall, 2005 ).Lab ergonomics were followed by the idealarrangement. The MATB-II task stimuli was presented on a computer screen (15 inches) with a dark
background and a viewing distance of 80cm. EEG from each subject was recorded with low-cost EEG device Emotiv EPOC ( Knoll, Wang, Chen, aand Xu, 2011 ) which was a 14-channel, 128 Hz neuro-signal acquisition and processing wireless neuro headset (Figure 1).
The following steps were performed by the subjects for workload assessment through the tasks assigned as per NASA‘s MATB-II, which was designed according to an eight minute event file.
-
1. During the experiment, three minute baselines was recorded with eyes open. In this situation, a laptop screen with no luminescence was kept in front of the subject‘s eyes.
-
2. 1 minute rest.
-
3. NASA MATB-II tasks at Low workload level were given to subjects.
-
4. 1 minute rest.
-
5. NASA MATB-II tasks at High workload level were given to subjects.
Figure 1. Lab Arrangement
B. Technique
-
(i) Feature Extraction
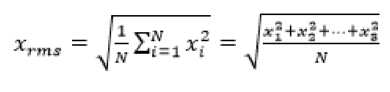
Root mean square (RMS) value
The RMS value is mainly used for varying a quantity and useful statistical parameter to see the effect of workload on EEG signals ( Basmajian and Luca, 1985 ). It is useful to measure power in amplitude of EEG signals from the cerebral cortex ( Abdul-latif, Cosic, Kumar, Polus, and Da Costa, 2004 ).
The RMS for a collection of N values {x1, x2, ..., xN} is given by the equation
Sub band Energy
Wavelet packet node energy is more useful in representing a signal. Wavelet packet component energy E and total signal energy can be defined as
— P — F ■
Multi-channel full-band EEG signals are decomposed into five well-known frequency sub-bands: delta, theta, alpha, beta, and gamma. Different energy bands like gamma, alpha, beta and theta have been calculated with MATLAB programming ( Sun, 2008 ).
Power Spectral Density (PSD)
The power spectral density is mostly directed at the continuous spectrum of the signal ( Sun, Chang, and Tang, 2006 ). In contrast to the mean-squared spectrum, the peaks in this spectrum have no reflection of the power at a given particular frequency ( Zarjam, Epps, and Chen, 2011 ).
Engagement Index (EI)
Task engagement is defined as how much the subject is involved in particular tasks on different levels of workload ( Kamzanova, Matthews, Kustubayeva, and Jakupov, 2011 ). EEG engagement index denoted by formula (β/(α+θ)) and has been to classify workload ( Berka et al., 2007 ).
-
(ii) EEG Signal Analysis
EEG signal processing means for operating in some fashion on a signal to extract some useful information from EEG data, different features such as power spectral densities, energy and root mean square (RMS) were extracted from the signal with the help of MATLAB programming.
(iii) Neural Network classifiers
We used feed forward neural network based on back propagation algorithm. It is assumed superior classifiers for discriminating workload level (Wilson and Russell, 2003, Wilson and Russell, 2007; Wilson, Estepp, andChristensen, 2010; Wilson, Estepp, and Davis,2009). Twenty-five percentage of the inputs
3. RESULTS
were taken for validation and 20% for training and rest inputs were test data. Linear transformation matrix was used to map between input and output. It had used features × channels, matrix for training and testing data set.
The overall result was calculated on the basis of psychological (MATB-II test score analysis with subjective score) and physiological (EEGSignal) data analysis separately.
The following three findings were extracted from MATB-II data.
-
1. Subjective score was calculated using NASA-Tlx scoring and total score displayed in Figure2for comparison between LWL and HWL.
-
2. Objective score was calculated for system monitoring (sysmon) and tracking task in the form of response time (in second) and Root mean square deviation (RMSD) respectively. In sysmon, percentage of correct responses were more in LWL case for five subjects (Figure 3) and also response time was less for HWL (increase stress sometime improve performance) (Figure 4).
-
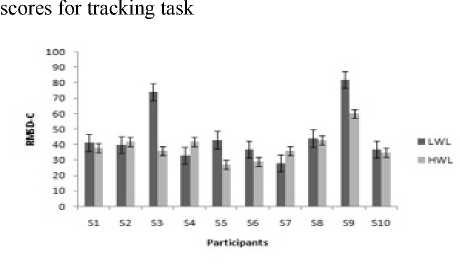
3. Three subjects were unable to give the responseinsysmon as they were unable to shift their attention. Improve performance was observed in a tracking task for HWL as in figure 5. Applying t- test on objective scores, we found: t= 1.550 at degree of freedom =9 for tracking task at probability = 0.155 and t = 1.030 at degree of freedom = 9 for system monitoring task at probability = 0.330.There were no significant difference between LWL and HWL task of tracking and system monitoring.
Figure 2. Total NASA-Tlx score of participants in the MATB-II
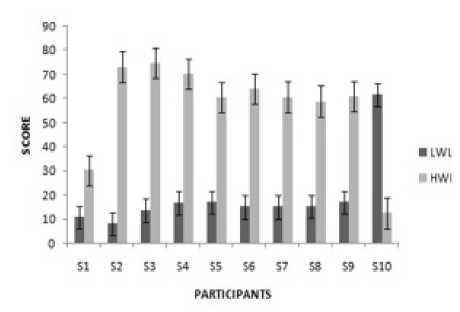
Figure 3. Percentage correct responses for system monitoring task
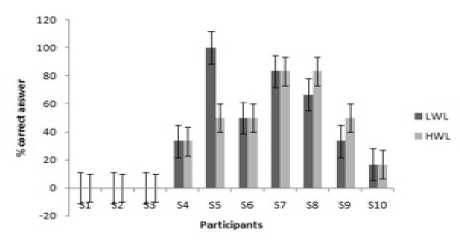
Figure 4. Response Time (in second) of system monitoring for participants who gave responses
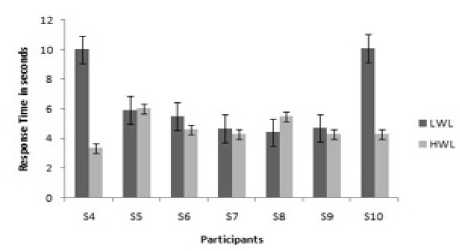
Figure 5. Root means square deviation (RMSD)
Three features are extracted from the EEG signal. To summarize the findings are:
Figure 6. Beta energy for AF3 channel for different condition, energy is summarized among all ten participants. BL=baseline, LWL=Low Workload, HWL=High Workload
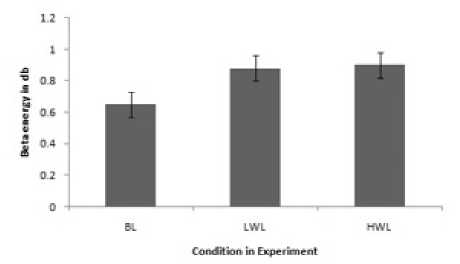
Table1. Significant result on 14 channels for RMS value after applying one way ANOVA. Difference between NWL and LWL after applying post hoc test (Tuckey-d)
|
Serial number |
Channel Name |
F Value |
P Value |
|
1 |
AF3 |
3.772 |
0.036 |
|
2 |
AF4 |
3.243 |
0.055 |
|
3 |
F3 |
4.042 |
0.029 |
|
4 |
F4 |
5.639 |
0.009 |
|
5 |
F7 |
3.689 |
0.039 |
|
6 |
F8 |
4.584 |
0.019 |
|
7 |
FC5 |
5.872 |
0.008 |
|
8 |
FC 6 |
5.117 |
0.013 |
|
9 |
01 |
6.233 |
0.006 |
|
10 |
02 |
5.451 |
0.011 |
|
11 |
P7 |
5.919 |
0.007 |
|
12 |
PS |
6.041 |
0.007 |
|
13 |
T7 |
6.972 |
0.004 |
|
14 |
T8 |
3.664 |
0.039 |
Figure 7. Engagement index for each channel on Baseline (BL), Low workload level (LWL) and high workload Level (HWL)
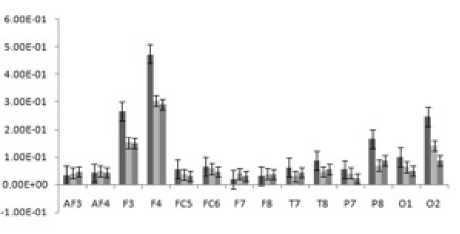
Table 2. Confusion Matrix result for classification of NWL, LWL and HWL, after applying NN classifiers with 1000 iteration for channels
5. CONCLUSIONS
To identify measurement technique for workload assessment supplemented designing of automated operator. Objective score failed to discriminate and subjective score succeeds, but they were invasive. We left with only electrophysiological method of workload discrimination that was necessary for designing of automated operator. Therefore, to rely on electrophysiological measures did become one of the major key in workload classification (Lysaght, 1989; Noyes, J.M. and Bruneau, 2007; Rubio, Diaz, Martin, and Puente, 2004; Verma, 2012). Gamma RMS was identified best feature without adding classifiers and EI was the best feature to be used as an input for NN classifiers. Best selected channels were anterior frontal for workload classification. The limitation of our study could be less number of subjects and channels in EEG. Result based on the onetime assessment of the workload, could have changed in the next assessment. Future direction of work will be based on the overcoming limitation with many time assessments with sufficient number of subjects and channels.
ACKNOWLEDGEMENTS
The authors would like to thank the volunteers for participating in the experiment, and are grateful for the assistance of Mr. James R. Comstock and Miss Yamira Santiago, NASA Langley Research Centre in providing the software NASA MATB-II. The authors are also thankful to Director INMAS for their support and help during the course of the experiment. This research was granted by INMAS, DRDO, Delhi.
Conflict of interests
