Effect of adhesion additive and nature of filler on interfacial interaction and fatigue parameters of asphalt mastic

Author: Gorbatova V.N., Gordeeva I.V., Dudareva T.V., Krasotkina I.A.
Journal: Nanotechnologies in Construction: A Scientific Internet-Journal @nanobuild-en
Section: The results of the specialists’ and scientists’ researches
Article in issue: 5 Vol.16, 2024.
Free access
Introduction. The effect of adhesion additive and nature of filler on fatigue life and interfacial interaction in mastic is analyzed in this paper. Materials and methods of research. Frequency sweep from 0.1 to 100 rad/s at strain 0.05% at temperatures from 30 to –10°С with a step 10°С and cyclic tests (LAS test) at temperatures from 16 to 1°С with a step 3°С for bitumen grade BND 100/130 and mastics based on it, containing fillers of different nature, were performed on the dynamic shear rheometer. Mastics were prepared by mixing bitumen (3 min; 160°С and 600 rpm) and filler (filler volume fraction – 0.275). Adhesion additive in an amount of 0.7%, was introduced into bitumen before the filler to investigate the effect of AD on the properties of bitumen and AB. The damage characteristic curve under cyclic loads was calculated using two models of VECD theory (Viscoelastic Continuum Damage Modeling System): dissipated strain energy and pseudo-strain energy. Results and Discussion. The influence of nature and properties of filler, adhesive additive, temperature and frequency of tests on the parameter of interfacial interaction K-B-G* and thickness of adsorbed layer has been investigated. The intensity of damage in the specimen under cyclic loads and the behavior of fatigue parameters as a function of test temperature at two variants of determining the parameter α have been analyzed. Conclusion. It is shown that an increase in the interfacial layer thickness in asphalt mastic leads to an increase in their resistance to damage accumulation (Damage Intensity) during fatigue testing (LAS), and lowers the rate of pseudo-deformation energy growth.
Mastic, filler, interfacial interaction, adsorbed layer thickness, fatigue parameters
Short address: https://sciup.org/142242275
IDR: 142242275 | DOI: 10.15828/2075-8545-2024-16-5-415-430
Text of the scientific article Effect of adhesion additive and nature of filler on interfacial interaction and fatigue parameters of asphalt mastic
Original article
Gorbatova V. N., Gordeeva I. V., Dudareva T. V., Krasotkina I. A. Effect of adhesion additive and nature of filler on interfacial interaction and fatigue parameters of asphalt mastic. Nanotechnologies in construction. 2024; 16(5): 415–430. –430. – EDN: KQNYDX.
The interfacial interaction between bitumen and stone materials of asphalt mix (crushed stone of different fractions, sand, and fine filler) largely determines the performance and service life of the pavement. In the process of asphalt mix preparation the selective adsorption of bitumen components occurs immediately after the surface wetting of stone materials. The activity of adsorption is controlled by the nature, dispersity and specific surface area of stone materials, chemical composition of bitumen, and surfactants widely used to improve adhesion and the adsorbed bitumen composi- tion is characterized by an increased concentration of the most high molecular weight and polar components compared to volume bitumen [1].
For many decades, the attention of researchers has been targeted to develop effective methods for evaluating the adhesion of bitumen with stone materials [2]. In recent years, the relationship between interfacial interaction and rheological properties of mastics consisting of a matrix phase of bitumen and finely dispersed filler is actively studied [3–6].
Using the Palierne emulsion model [7], that had been developed for a system of solid particles dispersed in a viscoelastic a matrix, the physicochemical interaction
THE RESULTS OF THE SPECIALISTS’ AND SCIENTISTS’ RESEARCHES between filler and bitumen can be characterized by the interfacial interaction parameter K–B–G* through the complex modules of the constituent components:
K—B-Q* — (範/儡 )-1
,
where φ – filler volume fraction; G* c and G* m – values of complex modulus for mastic and matrix (bitumen binder) depending on frequency.
One of the main types of pavement failure is the formation of fatigue cracks at so-called average operating temperatures. The content of mastic in asphalt mixes is only about 10-15%, but mastic is component that can break down first and have a direct effect on the fatigue life of the pavement under cyclic loadings.
The linear amplitude sweep (LAS) test [8–9] by means of a dynamic shear rheometer is widely used to evaluate the fatigue properties of bitumen binder and mastic. In the first stage of the test, the viscoelastic characteristics of the specimen are determined from the frequency sweep results in the LVE range region. At the second stage, when the specimen is subjected to a series of oscillatory load cycles with increasing strain amplitude, the accumulated damage intensity is determined. This provides an ability to determine the fatigue characteristics that are close to the real deformation conditions of bitumen binder or mastic during the operation of pavements [10].
Fatigue properties are analyzed in accordance with the VECD theory (Viscoelastic continuum damage modeling system), based on the Schapery potential theory [11], where the intensity of damage accumulation (D) depends on the potential energy (W), which is related to the damage intensity and the parameter α defining by the ability of a given material to accumulate damage:
damage intensity [13–16]. The latest AASHTO T391-20 [12] standard adopts a model based on dissipated strain energy, where the loss modulus is used as a function characterizing the material integrity:
,
and the damage intensity from test time is determined by the formula (5):
D(t) = 2匕阮小片2 (G:si?id — a i
, (5)
where I D is the value of complex modulus G* at strain of 1%; γ i , G i , δ i and t i – current values of strain, complex modulus, phase angle and time in the linear amplitude sweep test (second part of LAS test).
The second, widely used calculation model is based on pseudo-strain energy, and pseudo-stiffness is used as a function of material integrity under cyclic loading [17–18]:

where γR is pseudo-deformation, C – material integrity defined as pseudo-stiffness by formula (7):

where | G*| in and | G* i |(t) – initial (determined at the second point) and current values of the complex modulus obtained in the second part of the LAS test.
The intensity of damage accumulation in this case:
dD/dt = -(dH'/'d , 「.

The main element of this theory is the construction of the dependence linking the damage intensity with the function characterizing the integrity of the material under cyclic loading. The damage intensity at a certain failure level, determined by the selected failure criterion, is used in the definition of the coefficient A in the fatigue law to determine the fatigue parameter N f :
■ ( 3 )
where N f is the number of cycles to failure, B = 2α – characterizes the undamaged state of the material, it is determined on the basis of experimental data of LAS test in its first part at minimum deformation, and γ max is the maximum deformation at a given pavement design, which is usually taken as 2.5, 5 or 15% [12].
The damage intensity is designed using various VECD theory models based on the energy that determines the

用=『," G |丄吐, ( 9 ) ,
С =
塔 'DM 汽'
where γpR is the pseudo-strain at τ p , α – parameter characterizing the undisturbed state of the sample (the first part of the LAS test); τ p – the strain determined at τ p on the curve τ(γ) in each load cycle, and DMR is defined as:
DMR =丄亠, Iе \lve
THE RESULTS OF THE SPECIALISTS’ AND SCIENTISTS’ RESEARCHES where |G*|LVE – the value of the complex modulus determined in the frequency sweep test (the first part of the LAS test).
To determine the parameter B, the slope of the dependence of the logarithm of the relaxation modulus on time ( m ) is used. There are difficulties in determining the relaxation modulus, therefore the relaxation modulus is usually obtained by transformation methods or, simplifying, by plotting the dependence of the complex modulus or storage modulus (Gʹ) on frequency. Note that the dependence of B on the slope angle ( m ) is left open. For asphalt concrete, В = 2α is usually taken, with α = 1/ m , whereas for binders, both this formula and the formula α = 1/(1+m) are used [12, 19].
The goal of this work is to investigate the effect of adhesive additive and the nature of mineral filler on the interfacial interaction in asphalt mastic based on road bitumen BND 100/130 and to evaluate the influence of the thickness of the adsorbed layer of bitumen on the fatigue life of mastic.
MATERIALS AND METHODS
Materials
The work has been used:
-
• Oil road bitumen of BND 100/130 grade according to GOST 33133 [20]: penetration at 25°С – 115 dmm; softening point on the Ring and Ball – 46°С; Fraas breaking point – minus 23°С. The group chemical composition of bitumen determined by liquid adsorption chromatography with gradient displacement [21] is presented in Figure 1.
-
• Fillers:
– mineral powder of carbonate rocks of MP-1 grade according to GOST R 52129-2003 [22] (H1);
– powder obtained by mechanical crushing of noncarbonate rocks (gabbro) (H2).
The size distribution of filler particles was detected by laser diffraction of particles in liquid flow. The measurements were carried out on an ANALYSETTE 22 NanoTec plus instrument using FRITSCH MaS control software. The obtained results are presented in Figure 2 and Table 1.
The specific surface area of the fillers was carried out on a NOVA Series 1200e Quantachrome (USA) by low-temperature nitrogen adsorption. The specific surface area and pore volume of the studied samples were obtained from the analysis of N2 adsorption-desorption isotherms at –196°C (77K) measured in the region of equilibrium relative vapor pressures (P/P0) from 10–3 to 0.995. The samples were pre-degassed at 180°С for 3 hour. The true density, specific surface area and porous structure parameter values of the fillers determined by the BET method are presented in Table 1. The measurement error did not exceed 5–7%.
In accordance with the IUPAC classification [23], the average pore diameter of both fillers is characteristic of a structure with a predominance of mesopores. The results showed that filler H2 differs from filler H1 in having larger particle size, higher true density and lower values of specific surface area, pore volume and pore size.
-
• Adhesion Additive:
A surfactant applied in road construction to improve the adhesion of petroleum road bitumen to stone materials of both acidic and basic rocks was used as an adhesion additive (AD).
The IR spectrum of the adhesive additive was carried out on a Thermo Scientific Nicolet iS50 FT-IR spectrometer, it is shown in Fig. 3.
When studying the IR spectrum of the adhesive additive, well-defined peaks at 2952, 2922 and 2852 cm–1

Fig. 1. Group chemical composition of bitumen: paraffin-naphthenic hydrocarbons (S), aromatic hydrocarbons (Ar), resins (R), asphaltenes (A)
THE RESULTS OF THE SPECIALISTS’ AND SCIENTISTS’ RESEARCHES

Fig. 2. Differential (1, 2) and integral (3, 4) curves of filler particle size distribution: H1 (1, 3), H2 (2, 4)
Table 1
Basic parameters of fillers
|
Parameter |
Filler |
||
|
Н1 |
Н2 |
||
|
Size distribution |
D50, µ |
7 |
120 |
|
D 75 , µ |
13 |
160 |
|
|
D90, µ |
21 |
201 |
|
|
True density, ρ, g/cm3 |
2.71 |
3.05 |
|
|
Specific surface area, SBET, m2/g |
4.214 |
1.437 |
|
|
Total pore volume at relative pressure Р/Р0 = 0.99, Vt , cm3/g |
0.0106 |
0.002742 |
|
|
Average pore diameter, Dpore, nm |
10.1 |
7.63 |
|

Fig. 3. IR spectrum of the adhesive additive

THE RESULTS OF THE SPECIALISTS’ AND SCIENTISTS’ RESEARCHES corresponding to -CH3, -CH2 and -CH groups were observed. The presence of weaker in intensity peaks at 1457 and 1377 cm–1 indicates a significant content of saturated and aromatic hydrocarbons (paraffins, oils, etc.). The absorption band in the region 3005–3007 cm–1 is formed by valence C–H vibrations manifested in unsaturated fatty acids. The broad absorption band at 3300 cm–1 refers to the valence vibrations of О–Н bonds of phenol. The absorption band at 1743 cm–1 characterizing carbonyl groups of esters of saturated acids is clearly expressed. Absorption bands in the region of 1600–1560 cm–1, are characteristic of functional groups C=O of amino acids. The peak at the wave number 1065 cm–1 refers to the valence vibrations of C–N bonds.
Preparation of samples for rheological tests
It is known that the thermal history of samples, plate size, thickness of the gap between the plates of the rheometer, etc., can affect the results of rheological measurements [24]. Therefore, all samples for rheological tests were prepared and tested under the same conditions.
Sample B was bitumen BND 100/130, heated to 160°С and stirred at this temperature for 3 minutes at a stirrer speed of 600 rpm.
Sample B-AD was prepared in a similar manner by adding 0.7 wt.% adhesion additive to the bitumen before heating it.
Mastics AB1 and AB2 were prepared by mixing BND 100/130 bitumen (B) and filler (H1 and H2, respectively) preheated to T = 160°С for 3 minutes at a stirrer rotation speed of 600 rpm. The mass of fillers was selected taking into account the true density so that the volume fraction (φ) of fillers in AB was the same and amounted to 0.275.
When preparing samples of mastic AB1-AD and AB2-AD containing adhesion additive and filler H1 and H2, respectively, AD was preliminarily introduced into bitumen in the amount of 0.7 wt.% before its heating.
Immediately after preparation, the samples were poured into 8 mm diameter silicone molds to eliminate the reheating procedure, left for 24 hours at room temperature and then used for rheological tests.
Test methods
Rheological tests were performed on a dynamic shear rheometer “MCR 702e” (“Anton Paar”) with parallel plate geometry with a diameter of 8 mm. The measuring gap was 2 mm. Samples were removed from silicone molds, and placed between rheometer plates heated to 64°С. The specimens were trimmed at the same temperature. The discrepancy of the measured parameters from the average value did not exceed 3–7%.
Frequency sweeps were performed over a frequency range of 0.1 to 100 rad/s at a strain (γ) of 0.05% at tem- peratures from 30 to –10°С in steps of 10°С to evaluate the interfacial interaction. The strain of 0.05% was chosen because it is in the LVE range for all samples at –10°С (the minimum value observed for AB was 0.15%). The one specimen was used, which was thermostated after reaching the specified test temperature for 10 minutes.
Parameter K–B–G* characterizing physicochemical interaction between mineral powder and bitumen by means complex modulus was determined by formula (1). When determining the ratio of complex modulus of mastic to matrix ( G* c / G* m ) for AB1 and AB2, the data for bitumen were used as a matrix, and for AB1-AD and AB2-AD – for bitumen with adhesion additive (B-AD).
The thickness of adsorbed layer (d) was determined by formula (12):

where φeff = φ•( K–B–G* ) – effective volume fraction of filler, i.e. filler together with adsorbed bitumen layer, φ – volume fraction of filler; ρ –density of filler, s – specific surface of filler.
Fatigue tests by linear amplitude sweep (LAS according to [12] were performed in the temperature range from 16 to 1°С with a step 3°С. The upper temperature of the test range was chosen so that the initial value of loss modulus ( G* sinδ) of bitumen or bitumen with adhesion additive exceeded 5–6 MPa. A new specimen was used for each temperature. The first part of the test was performed in frequency sweep mode (ω = 0,2–30 Hz at strain of 1%). Then, using the same specimen, the second part of the tests was performed in the mode of stepwise linear amplitude sweep at the frequency of 10 Hz in the strain range of 0.1%; 1% and further in steps of 1% to 30% (100 cycles at each strain value, total 3100 cycles).
RESULTS
Interfacial interaction and adsorbed layer thickness in mastics
In the first stage of the work, the interfacial interaction by the К–B–G * parameter in mastics without adhesive additive (AB1 and AB2) and in its presence (AB1-AD, AB2-AD) was investigated by the frequency sweep method. A testing feature was that a single specimen was used for sequence measurements at five temperatures, starting from 30°С and up to –10°С in increments of 10°С and with the specimen thermostated at each temperature.
As can be seen in Figure 4, at the same filler volume fraction (0.275), a value of the K–B–G * parameter is higher for the AB1 sample both without and in the presence of the adhesion additive, i.e., when H1 carbonate mineral powder was used as a filler.
THE RESULTS OF THE SPECIALISTS’ AND SCIENTISTS’ RESEARCHES
The K–B–G * parameter of mastic AB2 based on the filler of non-carbonate rock powder (gabbro) H2 was more sensitive to the adhesive additive. At the same time, the sensitivity to the effects of temperature and frequency was less for the AB2-AD sample than for the AB1-AD sample.
Figure 5 is shown plots of the dependence of adsorbed layer thickness (d) on temperature and test frequency for all mastics. The adsorbed layer thickness in samples without adhesion additive ranges from 60 to 30 nm for AB1 and from 75 to 10 nm for AB2 (see Figures 5a and 5b).
The introduction of an adhesion additive (AD) into the mastics increases d in both cases (see Figs. 5 c and 5 d). This effect is seen to a lesser extent for the AB1-AD sample, which includes the filler H1. At the same time, it can be noted a tendency to increase the dependence of the adsorbed layer thickness on temperature compared to the AB1 sample without the adhesive additive. For AB2-AD based on H2, an increase in the thickness of the interfacial layer by more than 2 times (up to 190–150 nm) can be noted in comparison with AB2.
Fatigue tests
The range of test temperatures is recommended to be selected so that the complex shear modulus is in the range from 12 to 60 MPa where the failure mechanism is based on the fatigue properties of the material without
а


Fig. 4. Plots of dependence of the interfacial interaction parameter K–B–G* on the test frequency (ω) for samples: AB1 (a), AB2 (b), AB1-AD (c), AB2-AD (d) at temperatures 30 (red), 20 (green), 10 (purple), 0 (blue), and –10°С (black)
THE RESULTS OF THE SPECIALISTS’ AND SCIENTISTS’ RESEARCHES


Fig. 5. Plots of dependence of adsorbed layer thickness d on test frequency (ω) for samples: AB1 (a), AB2 (b), AB1-AD (c), AB2-AD (d) at temperatures of 30 (red), 20 (green), 10 (purple), (0 (blue) and –10°С (black)
the influence of plastic flow and loss of adhesion [25]. Table 3 shows the relationship of the parameters G* (ID) and G* sinδ ( C 0) to the test temperature. According to the conventional approach, I D was defined as the initial value of the complex modulus G* at a strain of 1%; and С 0 as the average value of G* sinδ at a strain of 0.1%.
As can be seen from Table 3, the bitumen sample (B) has С 0 = 6.6 MPa at temperature 16°С, which is quite close to the values characterizing not fatigue behavior, but plastic flow during testing. It can also be seen from the above data that the introduction of fillers into bitumen resulted in an increase in I D and equi-stiff (or close to it) were found when tested 6 degrees higher. The introduction of adhesion additive in bitumen and AB decreased the I D value of the samples and equi-stiff samples were found in all cases when tested 3 degrees lower.
Thus, for example, the values of I D parameter close to 22 and 32 MPa correspond to test temperatures 10 and 7°С for bitumen, 7 and 4°С for B-AD, 16 and 13°С for AB1 and AB2, 13 and 10°С for AB1-AD and AB2-AD. At the same time, as can be seen in Figure 6, which shows the plot of shear stress (τ) versus strain (γ), during fatigue testing, the behavior of equi-stiff specimens with and without adhesive additive differs significantly.
Thus, in Figure 6a, curves 1 (bitumen, at 10°С) and 4 (bitumen with adhesion additive at 7°С) correspond to equi-stiff specimens. Decreasing the test temperature for samples B and B-AD leads to an increase in the maximum shear stress and a decrease in the corresponding strain. The introduction of the adhesive additive into the bitumen reduces the maximum shear stress, which should have a positive effect on fatigue life, but changes the
THE RESULTS OF THE SPECIALISTS’ AND SCIENTISTS’ RESEARCHES
Table 2
Dependences of ID and С 0 parameters on test temperature
|
Parameter |
Sample |
||||||
|
B |
B-AD |
АВ1 |
AB1-AD |
AB2 |
AB2-AD |
||
|
ID , MPa |
|||||||
|
Temperature, °С |
16 |
10.2 |
22.1 |
21.4 |
|||
|
13 |
14.5 |
33.8 |
24.8 |
35.8 |
19.6 |
||
|
10 |
22.1 |
12.3 |
53 |
29.4 |
48 |
31 |
|
|
7 |
31.7 |
20.2 |
61.8 |
50.6 |
59.5 |
43.5 |
|
|
4 |
42.1 |
31.6 |
76.2 |
63.8 |
|||
|
С 0, MPa |
|||||||
|
Temperature, °С |
16 |
6.6 |
15.9 |
15.7 |
|||
|
13 |
9.0 |
22.9 |
16.3 |
24.7 |
13.5 |
||
|
10 |
12.6 |
7.4 |
32.5 |
17.9 |
29.1 |
20.0 |
|
|
7 |
16.8 |
11.0 |
35.5 |
30.9 |
36.6 |
26.0 |
|
|
4 |
21.4 |
16.5 |
40.7 |
36.7 |
|||
Note: cell toning was performed for two groups of equi-stiff (or close to it) samples post-peak behavior of the curve, which apparently may reflect a more rapid failure of the specimen during testing. A similar trend of sharper decrease in τ after passing the maximum can be observed by comparing the curves τ(γ) of equi-stiff AB and AB-AD specimens (Fig. 6b).
The Damage Intensity Curve (Damage Curve) is analyzed to characterize the fatigue life in VECD theory as its behavior reflects the loss of structural integrity of the material under cyclic loading. Figure 7 plots the Damage Curve as a function of the ratio of the parameter C (current loss modulus (G*•sinδ) in the model of dissipated strain energy (see Fig. 7a and 7b) or complex modulus (G*) in the model of pseudo-strain energy (see Fig. 7c and 7d), to its initial value С0. It should be remembered, con-

Fig. 6. Dependence of shear stress (τ) on strain (γ) for samples: a) bitumen (1, 2) and B-AD (3, 4) at temperatures 10 (1, 3) and 7°С (2, 4); b) for AB1 (1) and AB2 (2) at 13°С and AB1-AD (3) and AB2-AD (4) at 10°С.
THE RESULTS OF THE SPECIALISTS’ AND SCIENTISTS’ RESEARCHES


Fig. 7. Dependence of С/C0 on Damage Intensity: (a) at temperature 16°С (a, c) and 10°С (b, d) for samples: B (1), AB1 (2), AB2 (3) according to the models of dissipated strain energy (a, b) and pseudo-strain energy (c, d).
sidering the presented data, that that the value of С / C 0 = 1 corresponds to the strain γ = 0.1%, and the minimum value of С / C 0 for each curve is fixed at γ = 30%. The appearance of cogs is probably related to the peculiarities of Damage Intensity calculation by different models and edge effects at large shear strains.
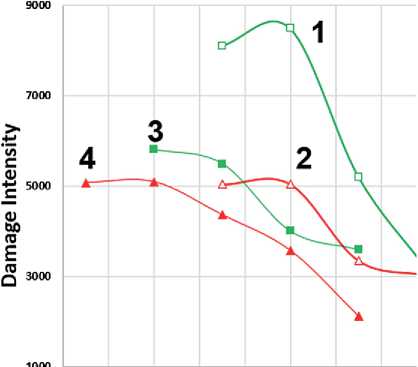
As can be seen from Fig. 7a and 7c, bitumen shows the least damage intensity for both calculation models at temperature 16°С, while for mastic samples there is practically no difference between the curves when calculated by the pseudo-strain energy method. At lower temperatures (see Figs. 7b, 7d and Fig. 8), as well as at the introduction of an adhesive additive (Fig. 8), the advantage of the AB2 sample is manifested, which may be due to the thicker adsorbed layer.
It should be noted that at 7°C the resistance to fracture of bitumen sample without adhesive additive deteriorates
(Fig. 8 a, c), so that the curve of bitumen is close to the curve AB2. It is possible to assume that in this temperature range patterning processes are occurring associated with crystallization of n-alkanes (paraffins), taking into account the high (15.6%) content of paraffin-naphthenic hydrocarbons in bitumen (see Fig. 1). [25]. Bitumen patterning leads to the appearance of new interfaces, along which microcracks can also nucleate. The inclusion of an adhesion additive seems to shift bitumen patterning to lower temperatures, and at 7°C (Fig. 8b and 8d), bitumen with an adhesion additive again has an advantage over mastic with the same AD.
Figure 9 shows the curves of dependence of Damage Intensity on temperature. The calculation was performed using the model of dissipated strain energy and two variants of the failure criterion (failure) – С/C 0 = 0.65 [12] and С/ C 0 at τ max on the curve τ(γ) in the amplitude sweep test. The
THE RESULTS OF THE SPECIALISTS’ AND SCIENTISTS’ RESEARCHES


Fig. 8. Dependence of С/C0 on Damage Intensity: (a) at 7°C for specimens without AD (a, c) and with AD (b, d): B (1) AB1 (2), AB2 (3) according to models I (a, b) and II (c, d)
parameter α, included in the calculation of Damage Intensity, was defined in two ways: α = 1+1/ m and α = 1/ m .
Figure 10 shows similar curves calculated using the pseudo-strain energy model for the failure criterion – С/C 0 at τ max on the curve τ(γ) and for the two variants of the parameter α: α = 1+1/ m and α = 1/ m .
For all variants of calculations, failure criteria and variants of the parameter α, it is possible to find the general tendencies that at one temperature the ranking of specimens in the order of decreasing accumulated damage (Damage Intensity) is as follows: AB1, AB2, AB1-AD, AB2-AD. Comparing the data shown in Figures 9–10 and Figures 5 and 7–8, one can see a certain correlation between the thickness of the adsorbed layer (d) and Damage Intensity: an increasing in d leads to a decreasing Damage Intensity.
Unfortunately, the application of both VECD models for calculation of the parameter N f did not give an unam-
THE RESULTS OF THE SPECIALISTS’ AND SCIENTISTS’ RESEARCHES
а

d

АмифиІ- ШШЛЕЛО


Fig. 9. Dependence of damage accumulation (Damage Intensity) on temperature at α = 1+1/ m (a, b) and α = 1/ m (c, d) and failure criteria: С/C 0 = 0.65 (a, c), С/C 0 at Τ max on the curve τ(γ) (b, d) for samples AB1 (1), AB2 (2), AB1-AD (3), AB2-AD (4)
biguous result. Figure 11 shows the temperature dependence of the parameter number of cycles to failure (Nf) for strains of 2.5, 5, and 15% for mastic specimens using the strain energy dissipation model at α = 1+1/m and α = 1/m and the failure criterion at τmax on the curve τ(γ). For all specimens, Nf decreases with decreasing temperature. In the absence of adhesion additive, the Nf values for specimen AB1 are close to bitumen (curve not shown) and exceed the Nf values for specimen AB2. Addition of adhesion additive slightly decreases Nf for bitumen (curve not given) and AB1, while an increase in fatigue life is observed for AB2, regardless of which formula is used to calculate the parameter α.
The plots of N f dependence on temperature have the same character when calculated by the pseudo-deformation energy model for samples without adhesive additive, but there is practically no difference between samples AB1 and AB2, regardless of the way of the choice of the parameter Α. The AB2-AD specimen shows a slightly higher fatigue life compared to AD1. But the curve N f (t) of the bitumen sample with adhesion additive shows an increase with decreasing temperature (the curve is not

THE RESULTS OF THE SPECIALISTS’ AND SCIENTISTS’ RESEARCHES

Fig. 10. Dependence of damage accumulation (Damage Intensity) on temperature at pseudo-deformation energy model calculation at α = 1+1/m (a) and α = 1/m (b) and failure criterion С/C0 at Τmax on the curve τ(γ) for samples AB1 (1), AB2 (2), AB1-AD (3), AB2-AD (4)
given), which makes us doubt the applicability of this calculation method for predicting fatigue life in such samples.
Thus, it was possible to see only some trends in the influence of the adsorbed layer thickness in mastic and mastics containing an adhesive additive on damage accumulation (Damage Intensity) but not on the fatigue parameter Nf.
An interesting consistency was observed in the parameter F, which actually refers the rate of pseudo-deforma- а
1,E+05
1,E+04
艺 1,E+03
1,E+02
1,E+01
1,E+00

Fig. 11. Dependence of the number of cycles to failure ( Nf ) when calculated by the dissipated strain energy model at α = 1+1/ m (a, b) and α = 1/ m (c, d) and by the pseudo strain energy model at α = 1+1/m (e, f) and α = 1/m (g, h) at failure criterion (failure, failure) τmax on the curve τ(γ) for specimens AB1 (1), AB2 (2); AB1-AD (3), AB2-AD (4) at strains of 2. 5% (1-4), 5% (1’-4’) и 15% (1’’-4’’)
THE RESULTS OF THE SPECIALISTS’ AND SCIENTISTS’ RESEARCHES

d

т,℃

1,E+05
1,E+04
1,E+03
1,E+01
1,E+00
1,E+02

T,℃
Fig. 11. The End
THE RESULTS OF THE SPECIALISTS’ AND SCIENTISTS’ RESEARCHES

Fig. 12. Temperature dependence of the parameter F for samples: bitumen (1), AB1 (2), AB2 (3); B-AD (1’), AB1-AD (2’), AB2-AD (3’)
tion energy build-up. It was shown earlier that a lower value of the F parameter is related to a higher fatigue life of the specimen [26]. As can be seen in Figure 12, the use of filler H2 leads to a stronger regression in the fatigue life of bitumen compared to H1. The use of adhesive additive leads to a decrease in the value of F for mastic, i.e. increases the fatigue life, and this increase is more marked for AB with filler H2, which has a thicker adsorbed layer. It should be noted that for bitumen the effect of adhesion additive on this parameter is practically not present.
CONCLUSION
Standard mineral powder of carbonate rocks (H1) and filler of non-carbonate (gabbro) rocks (H2) differing from H1 by larger particle size, higher true density and lower values of specific surface area, pore volume and pore size were used. At the same filler volume fraction (0.275) in asphalt mastic based on BND 100/130 bitumen, a higher value of the K–B–G* parameter, both without and in the presence of the adhesive additive, was observed for the mastic (AB) sample based on H1 filler. The use of adhesive additive (AD) into the mastic based on H2 filler resulted in a greater increase in the K–B–G* parameter compared to H1-based AB, and a decrease in its sensitivity to temperature and test frequency. The thickness of adsorption layer significantly increases in mastic with filler H2 by using adhesion additive
Different models of VECD theory, fracture criteria and variants of the unbroken structure parameter α were used to estimate fatigue life from LAS test results. For all versions of the calculation For all versions of calculations the tendencies of saving the ranking of samples by resistance to accumulation Damage Intensity at one temperature are observed: AB1 < AB2 < AB1-AD < AB2-AD.
Unambiguous data on the dependence of the fatigue life parameter – the number of cycles to failure ( N f ) on temperature failed to be obtained. It is shown that an increase in the thickness of the adsorption (interphase) layer leads to an improvement in fatigue resistance determined by the fatigue criterion F .
The work will be continued with expansion of the range of investigated objects: bitumens, fillers and adhesion additives.
References Effect of adhesion additive and nature of filler on interfacial interaction and fatigue parameters of asphalt mastic
- Kolbanovskaya A.S., Mikhailov V.V. Road bitumens. Moscow: Transportation; 1973. (In Russ.)
- Pyrig Ya.I. A review of methods for evaluating the adhesion of bitumen to stone materials // Vísnik KHNADU. 2019; 85:73-85. (In Russ.) https://doi.org/10.30977/BUL.2219-5548.2019.85.0.73
- Cardone F., Frigio F., Ferrotti G., Canestrar F. Influence of mineral fillers on the rheological response of polymer-modified bitumens and mastics. // Journal of Traffic and Transportation Engineering (English Edition). 2015; 2(6):373–381. https://doi.org/10.1016/j.jtte.2015.06.003
- Chen M., Javilla B., Hong W., Pan C., Riara M., Mo L. Rheological and Interaction Analysis of Asphalt Binder, Mastic and Mortar // Materials. 2019; 12 (1):128. https://doi.org/10.3390/ma12010128
- Guo M., Tan Y. Interaction between asphalt and mineral fillers and its correlation to mastics’viscoelasticity // International Journal of Pavement Engineering. 2021; 22(1):1–10. https://doi.org/10.1080/10298436.2019.1575379
- Guo M., Bhasin A., Tan Y. Effect of mineral fillers adsorption on rheological and chemical properties of asphalt binder // Construction and Building Materials. 2017; 141:152–159. https://doi.org/10.1016/j.conbuildmat.2017.02.051
- Palierne J.F. Linear rheology of viscoelastic emulsions with interfacial-tension // Rheologica Acta. 1990; 29(3):204–214.
- Hintz C., Velasquez R., Johnson C., Bahia H. Modification and validation of linear amplitude sweep test for binder fatigue specification // Transportation Research Record Journal of the Transportation Research Board. 2011; 2207:99–106. https://doi.org/10.3141/2207-13
- Riccardi C., Falchetto A.C., Wistuba M.P. Comparison of fatigue test methods on asphalt mastic. In book: Functional Pavement Design. Proceedings of the 4th Chinese-European Workshop on Functional Pavement Design. 2016. ISBN 9781138029248.
- Christensen D.W., Tran N. Relationships Between the Fatigue Properties of Asphalt Binders and the Fatigue Performance of Asphalt Mixtures. NCHRP RESEARCH REPORT 982. 2022. Washington, DC. ISBN 978-0-309- 09342-2. https://doi.org/10.17226/26302
- Schapery R. A. A theory of mechanical behavior of elastic media with growing damage and other changes in structure // Journal of the Mechanics and Physics of Solids. 1990; 38(2):215–253. https://doi.org/10.1016/0022-5096(90)90035-3
- AASHTO T391-20. Standard Method of Test for Estimating Fatigue Resistance of Asphalt Binders Using the Linear Amplitude Sweep. Washington, DC: AASHTO
- Cao W., Wang W. New comprehensive analysis framework for fatigue characterization of asphalt binder using the Linear Amplitude Sweep test // Construction and Building Materials. 2018; 171:1–12. https://doi.org/10.1016/j.conbuildmat.2018.03.125
- Zhang H., Shen K., Xu G., Tong J., Wang R., Cai D., Chen X. Fatigue resistance of aged asphalt binders: An investigation of different analytical methods in linear amplitude sweep test // Construction and Building Materials. 2020; 241:118099. https://doi.org/10.1016/j.conbuildmat.2020.118099
- Safaei F., Castorena C., Kim Y.R. Linking asphalt binder fatigue to asphalt mixture fatigue performance using viscoelastic continuum damage modeling // Mechanics of Time-Dependent Materials. 2016; 20:299-323. https://doi.org/10.1007/s11043-016-9304-1
- Chen H., Bahia H.U. Modelling effects of aging on asphalt binder fatigue using complex modulus and the LAS test // International Journal of Fatigue. 2021; 146:106150. https://doi.org/10.1016/j.ijfatigue.2021.106150
- Wang C., Castorena C., Zhang J., Kim Y.R. Unified failure criterion for asphalt binder under cyclic fatigue loading. // Road Materials and Pavement Design. 2015; 16 (2):125–148. https://doi.org/10.1080/14680629.2015.1077010
- Underwood B.S. A continuum damage model for asphalt cement and asphalt mastic fatigue // International Journal of Fatigue. 2016; 82(3):387-401. https://doi.org/10.1016/j.ijfatigue.2015.08.020
- AASHTO TP101-14 Estimating Damage Tolerance of Asphalt Binders Using the Linear Amplitude Sweep.
- GOST 33133-2014 Dorogi avtomobil’nyye obshchego pol’zovaniya. Bitumy neftyanyye dorozhnyye vyazkiye. Tekhnicheskiye usloviya. (In Russ.)
- Metodika izmereniy gruppovogo khimicheskogo sostava tyazhelykh nefteproduktov metodom zhidkostnoadsorbtsionnoy khromatografii s gradiyentnym vytesneniyem. Ufa. 2014. 18 s. (In Russ.)
- GOST R 52129-2003 Poroshok mineral’nyy dlya asfal’tobetonnykh i organomineral’nykh smesey. Tekhnicheskiye usloviya. (In Russ.)
- International Union of Pure and Applied Chemistry Physical Chemistry Division Commission on Colloid and Surface Chemistry, Subcommittee on Characterization of Porous Solids: “Recommendations for the characterization of porous solids (Technical Report)” // Pure and Applied Chemistry. 1994; 66(8):1739–1758.
- Sheidaei M., Gudmarsson A. Sample preparation techniques on dynamic shear rheometer testing: round robin tests on bitumen // Road Materials and Pavement Design. 2024; 25(3):474-491. https://doi.org/10.1080/14680629.2023.2213775
- Frolov I.N., Firsin A.A., Yusupova T.N., Okhotnikova E.S., Ziganshin M.A. Dynamics of formation of asphalt microstructure according to modulated differential scanning calorimetry data // Petroleum Chemistry. 2017; 57(12):1002-1006. https://doi.org/10.1134/S0965544117120039
- Zhang J., Sabouri M., Guddati M., Kim Y. Development of a failure criterion for asphalt mixtures under fatigue loading // Road Materials and Pavement Design. 2013; 14(2):1-15. https://doi.org/10.1080/14680629.2013.812843
