Effect of continuous improvement on the reporting quality of project management information system for project management success

Author: Atsushi Taniguchi, Masahiko Onosato
Journal: International Journal of Information Technology and Computer Science @ijitcs
Article in issue: 1 Vol. 10, 2018.
Free access
Project management information systems have their proven position as an effective tool for achieving project management success in terms of the successful realization of the project regarding time, cost and quality. Recent research results have indicated that quality of project management information system output information is positively and significantly related to project management information system application and project management factors and revealed the empirical support. However, getting the reporting quality of the project status report, monthly generated from the project management information system based on the information timely maintained by the project managers, responsible for ERP implementation up to the satisfactory level at any time, can be problematic without having a systematic approach implemented. This article is to discuss how the continuous quality improvement based on the plan-do-check-act cycle was conducted on the reporting quality of the project status report from project management information system generated by the project managers, for achieving project management success in ERP projects implemented by a solution provider for their customers in the various industries in Japan. The results of the study indicate that the continuous improvement on the reporting quality of project management information system was found to be effective in achieving quality of project management information system output information to help managers in decision making, planning, organizing and controlling the project. It was also found to be effective in positively influencing achievement of project management success in terms of respecting the time, cost and quality.
Project Management Information Systems, PMIS, Project Management Success, ERP, Continuous Quality Improvement, PDCA Cycle, Key Performance Indicators
Short address: https://sciup.org/15016221
IDR: 15016221 | DOI: 10.5815/ijitcs.2018.01.01
Text of the scientific article Effect of continuous improvement on the reporting quality of project management information system for project management success
Published Online January 2018 in MECS DOI: 10.5815/ijitcs.2018.01.01
Information is one of the most important capitals in the organizations, because all physical facilities and environmental decision making are affected by information [1]. In cases when product or service realization has been organized in the projects, one of the main information systems (IS) in the organization is a project management information system (PMIS) [2]. Similar to other IS, a successful PMIS should have individual impacts in terms of satisfied users and effective use [3]. However, a successful PMIS should also have organizational impacts [4], that is, impacts on project management success in terms of respecting the time, cost and quality. Project management success is defined that it focuses upon the project process and, in particular, the successful accomplishment of cost, time, and quality objectives. It also considers the manner in which the project management process was conducted [5].
The recent study result has indicated that the quality of PMIS output information is positively and significantly related to PMIS application and project management factors as it helps managers in decision making, planning, organizing and controlling the project [1]. PMIS were also found to have direct impacts on project success, as they contribute to improving budget control and meeting project deadlines as well as fulfilling the technical specifications [3].
This article describes the case study on how an iterative process of continuous quality improvement [6], [7] based on the plan-do-check-act (PDCA) cycle [8], [9] was applied for getting the reporting quality of the project status report from PMIS generated by the project managers up to the satisfactory level using the key performance indicators (KPIs) [10] for evaluation measurement. The study was conducted for the set of ERP implementation [11], [12] projects carried out by a solution provider for their customers in the various industries in Japan. The set of projects was determined based on the following criteria that the solution provider is:
-
• To provide a project manager and project team
-
• To be responsible for providing particular results based on contractual agreements
-
• To provide advisory services that are mainly relevant to meet customers’ project goals
-
• To provide project work with the budget of the
contract that is greater than the threshold value
The results of the study indicate that the continuous improvement on the reporting quality of PMIS was found to be effective in achieving quality of PMIS output information to help managers in decision making, planning, organizing and controlling the project [1]. It was also effective in positively influencing project management success in terms of the following three project management dimensions [13]:
This article is structured as follows: Section II reviews the works that are related to PDCA cycle, continuous quality improvement, KPIs, scorecards and their adoption. Section III presents the literature review of PMIS and its current configuration implemented. PDCA cycle based process of continuous improvement on the reporting quality of PMIS for ERP implementation projects conducted by the solution provider is presented in Section IV. Results of continuous improvement on the reporting quality of PMIS are summarized in Section V. Finally, Section VI is composed by the conclusion.
-
II. R elated W orks
The PDCA cycle is a renowned continuous quality improvement approach and has been widely used by many successful companies as a strategic weapon for enhancing organizational performance [8]. Deming’s PDCA cycle of continuous quality improvement provides a systematic method to incrementally progress toward the goal [9]. According to this framework, quality improvement will be effective if improvements start with a good plan (P), activities necessary to achieve the plan are implemented (i.e., done, D), results are checked (C) to understand the causes of the results, and actions (A) are taken to improve the processes [14], [15]. Continuous quality improvement is an iterative process of: planning to improve a product or process, plan implementation, analyzing, and comparing results against those expected, and corrective action on the differences between actual and expected results [7].
A KPI is an index used in measuring an individual’s, organization’s or institution’s performance [16]. KPIs are essential for monitoring and controlling the project performance in the industries. An organization contains various types of processes and equipment that have to be controlled and maintained to achieve highest project performance and profit for the plants. KPIs are crucial in measuring the organizational performance and its progress [17]. KPIs help organizations understand how well they are performing in relation to their strategic goals and objectives. In the broadest sense, a KPI provides the most important performance information that enables organizations or their stakeholders to understand whether the organization is on track or not. KPIs serve to reduce the complex nature of organizational performance to a small number of key indicators in order to make it more digestible [18].
In order to be evaluated, KPIs are linked to target values, so that the value of the measure can be assessed as meeting expectations or not. The explored way in this work for improving this process is based on scorecard approach. KPIs accommodated in scorecards is a usual tool within the strategic management, but it is rarely used effectively in the field of software projects [19].
The iterative process of continuous quality improvement based on the PDCA cycle adopted by the solution provider is as follows:
-
• Plan:
o Establish the set of KPIs based on the guideline for evaluation of the reporting quality of PMIS linked to the target values in the scorecard used for the criteria of continuous quality improvement.
-
• Do:
o Provide the training on the KPIs based on the reporting quality guideline referring an actual project status report along with the scorecard for the newly assigned project managers and/or whomever required.
-
• Check:
o Evaluate the reporting quality of the project status report from PMIS monthly generated by the responsible project manager against the reporting quality guideline for all the ongoing projects falling under the criteria.
-
• Act:
o Provide the corrective actions to the project managers in need of reporting quality improvement and did not clear the passing score of the KPIs set in the scorecard.
o Provide the results of reporting quality evaluation of PMIS to the head of project delivery organization and the delivery managers in charge of the portfolio categories where the projects belong to.
The set of KPIs for evaluation of the reporting quality of PMIS is:
-
• Timeliness
-
• Scope
-
• Summary
-
• Risks/Issues
-
• Financials
-
• Milestones
-
• Client Expectation Management
-
• Use of PMIS
Table 1 shows the guideline of reporting quality KPIs based on a 16-point scale which covers the KPIs, a metric of performance measurement, in terms of use case, elements, evaluation criteria and score linked to eight areas of the project status report from PMIS. There are two terminologies, ETC and EAC used in Metric 5 (Financials) of Table 1. ETC (Estimate to Complete) is the expected cost to finish all the remaining project work. EAC (Estimate at Completion) is the expected total cost of completing all work expressed as the sum of the actual cost to date and the estimate to complete [20].
Table 2 shows the reporting quality KPI scorecard template with three sample entries, a full score of data maturity index based on a 5-point scale that is converted from the total score of quality KPIs based on a 16-point scale, a passing score threshold of 4 and a failing score of 3 requiring the corrective actions. The passing score threshold of 3.75 (or 4 after rounding) is calculated by the total KPI score of 12 / the perfect KPI score of 16 x 5. The scorecard is used to assist in monitoring the reporting quality of the project status report and identifying areas in need of improvement by providing a maturity index. Data maturity is measured across eight areas and a maturity index is calculated (1-5). Reviewer feedback is provided.
Table 3 shows the client expectation management template that is described in Metric 7 of Table 1. It is an example in the mail format of how the response from the project sponsor on the performance question asked by the project manager should be fed back.
The project status report template that is described in Metric 8 of Table 1 is shown in Table 4. Project financials automatically calculated by PMIS is based on the earned value management (EVM) [20].
Table 1. Reporting Quality Guideline
Reporting Quality Audits are regularly performed on reporting and quality is scored on a 16 point scale;
|
Use Case |
Elements (KPIs) |
Evaluation Criteria |
Score |
|
Project Management |
Metric 1: Timeliness |
Score of 1 - Updated on time, or Score of 0 - Late, or Not updated. |
1 |
|
Metric 2: Scope |
Score of 2 - Gives a good overview (good to take from scope of contract), a paragraph or two giving a concise overview of the engagement which in addition provides information on customer anticipated benefits. |
2 |
|
|
Metric 3: Summary |
Score of 2 - Provides summary of recent progress and upcoming focus areas, may also summarize some key risks or issues, or Score of 1 - If covers only past, future, or is written in such a way that any leader could not understand progress (e.g. Client specific acronyms are used). |
2 |
|
|
Metric 4: Risks/Issues |
Score of 1 - Risks well articulated, each has 4 components (description, impact, action plan, status), dates and owners assigned, or Score of 0 - If nothing is entered and maintained. |
1 |
|
|
Score of 1 - Issues well articulated, each has 4 components (description, impact, action plan, status), dates and owners assigned, or Score of 0 - If nothing is entered and maintained. |
1 |
||
|
Metric 5: Financials |
Score of 2 - Accurately updated and tracking to plan. Reconcilable to the billing system (automatically interfaced with PMIS), ETC (Estimatate to Complete) completed includes all days forecast to contract total (even if in future years). Baselines effectively managed, or Score of 1 - EAC (Estimate at Completion) cost is increased >= 1.0% from the agreed baseline. Also, requested to enter the reason. |
2 |
|
|
Metric 6: Milestones |
Score of 1 - Sufficient granularity and all key deliverables/phases listed as milestones, and add Score of 1 - Uses effective action verbs i.e. completed, signed off is in Milestone description, and add Score of 2 - Achieving to plan and tracking to agreed baseline. Dates exist for milestones in next couple of months. |
4 |
|
|
Metric 7: Client Expectation Management (CEM) |
Score of 2 - Step 1. Project Manager to ask the Project Sponsor the question verbally based on the Client Expectation Management template separately attached and listen to his response. Step 2. Read back by sending him/her the minutes to confirm what was discussed. The minutes is to be stored in the designated folder in PMIS. |
2 |
|
|
Metric 8: Use of PMIS |
Score of 1 - Integrity of the Project Status Report template regarding use of PMIS retained on the reporting quality guideline, or Score of 0 - If template has been changed or status is over-written from those automatically calculated. |
1 |
Table 2. Reporting Quality KPI Scorecard Template
|
Project Manager |
Project Name |
Metric 1: Timeliness (1) |
Metric 2: Scope (2) |
Metric 3: Summary (2) |
Metric 4: Risks/Issues (2) |
Metric 5: Financials (2) |
Metric 6: Milestones (4) |
Metric 7: CEM (2) |
Metric 8: Use of PMIS (1) |
Total Score (16) |
Data Matutiy Index (DMI) (5 point scale) |
Review Comments and Corrective Actions |
|
Project Manager 1 |
Project A |
1 |
2 |
2 |
2 |
2 |
4 |
2 |
1 |
16 |
5 |
Full Score Example |
|
Project Manager 2 |
Project B |
1 |
2 |
2 |
2 |
2 |
2 |
0 |
1 |
12 |
4 |
Passing Score Threshold |
|
Project Manager 3 |
Project C |
1 |
2 |
2 |
1 |
2 |
2 |
0 |
1 |
11 |
3 |
If DMI < 4 (or Total Score < 12), then the Corrective Actions to be notified. |
Table 3. Client Expectation Management Template
Example — Client response to “Are you satisfied with the service that our company is providing?”*
Dear #,♦■
Thank you for your feedback about the services that our company is delivering at ^Company Name#.*
I am summarizing below the key points of our discussion:^
|
Overall Rating:*3 |
RAG (Ensure that the RAG status is discussed and agreed with the client)*' (Optional - Summary Statement Text)*' |
|
Positive Feedback:»3 p |
List here the bullet points of positive feedback (if any):»*
|
|
Improvement Opportunities:*’ |
List here the bullet points of negative feedback (if any)v
|
|
Actions :* |
Extract agreed action items (in standard Action Tracker format). Note only include actions that will be delivered -do not commit to anything that you cannot confidently deliver.*1 • Create Date. ID, Action Item, Owner. Original Target Date, Current Target Actual Date, Status, Update* |
*1
Regards -1
Project Manager*
Table 4. Project Status Report Template
The configuration use case elements supported by the PMIS implemented for the use by the solution provider are shown in Table 5. It aims to provide the KPIs, risk registers and reports such as project financials in terms of EVM. This part of the paper is based on the previous study conducted [26] in 2017.
Table 5. PMIS Production Configuration Use Case Elements
|
Use Case |
Elements |
|
|
Project Management |
Project Identification |
Key Project Information |
|
Project Classification |
Contract Type (i.e. T&M, FFP), Quality Requirements, Governance |
|
|
Project Scope Description |
Project Scope |
|
|
Management Summary |
Status Reporting |
|
|
Status Indicators |
Overall, Margin, Cost, Accounts Receivable, Schedule, Risks, Issues, Resources, Quality, Scope, Customer Satisfaction, Governance, Value Management |
|
|
Key Issues |
Top Issues Reporting |
|
|
Key Risks |
Top Risks Reporting |
|
|
Project Financials |
Expenses (Bid Baseline / PM Baseline), Revenue (Bid Baseline / PM Baseline), Earned Value Management (EVM) |
|
|
Project Milestones |
Performance Reporting |
|
|
Change Request |
Change Request Management |
|
|
Issue List |
Issue Management |
|
|
Risk Register |
Risk Management |
|
|
Financial Contract |
Plan (Man Days) |
|
|
WBS |
Phases, Schedule, Milestones |
|
|
Roles w/ Assigned Tasks |
Man Days by Resource |
|
|
Resources (Plan vs. Actual) |
Budget Monitoring |
|
|
Contact List |
Project Manager, Quality Manager, Sales |
|
|
Authorization |
Access Authorization Level |
|
|
Accounting |
Plan, Actual, Revenue, Expenses, Billing, Backlog |
|
|
Portfolio Management |
Reports |
Online Portfolio Report, Change Request Report, Issue and Risk Report, Action Item Report, Financial Contract Report, Consolidated Financial Report, Portfolio Revenue Forecast Report, Solution Scope Report |
-
IV. C ontinuous Q uality I mprovement P rocess to achieve R eporting Q uality of PMIS
Continuous Quality Improvement process on the reporting quality of the project status report from PMIS consists of two major processes. One is PMIS Reporting Quality KPI Training process that is conducted at the beginning of each project when the project manager assigned is either newly hired or taking on the role for the first time. The other is an iterative process of Continuous Quality Improvement on Reporting Quality of Project Status Report that is conducted once the financial month end closing of PMIS is completed in the project lifecycle for the set of projects described in Section I. PMIS used to trigger the initiation of the PMIS reporting quality KPI training as well as the succeeding iterative continuous quality improvement process on the reporting quality of PMIS systematically throughout the project duration is discussed below.
-
A. Conduct Continuous Quality Improvement Process on Project Status Report from PMIS in Project Lifecycle
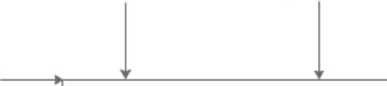
Systematic overview of the continuous quality improvement process to achieve the reporting quality of PMIS that is triggered by the appropriate project initiation information from PMIS can be expressed in IDEF0 (Integration DEFinition level 0) [27], [28] as shown in Fig. 1. This is the top-level context diagram A-0.
It is decomposed to the next level diagram with a systematic framework that consists of two nodes, A1 and A2 as shown in Fig. 2. Node A1 is PMIS reporting quality KPI training process that is triggered by the relevant project initiation information from PMIS to be conducted at the beginning of each project. It is specifically positioned to influence the phase and project results positively, as well as coach and educate project manager on upcoming project status reporting with the methodology, tools, quality and standards based on the reporting quality guideline along with the reporting quality KPI scorecard template and the project status report template. Node A2 is an interactive process of continuous quality improvement on the project status report from PMIS to be conducted monthly throughout the project duration. It is positioned to check that reporting quality of the project status report generated upon completion of the financial month end closing of PMIS is aligned with the reporting quality guideline and up to the satisfactory level at the reporting quality KPI scorecard. It is to make sure that the quality of PMIS output information can help managers in decision making, planning, organizing and controlling the project.
Project Initiation Information from
PMIS
Project Status Report Template
Reporting Quality Guideline
Quality KPI Scorecard Template
Updated Project Status Report
Note 1: Dashed (---)
arrows represent physical items. All other arrows represent information.
Note 2: PMIS = Project Management Information System
Operating Schedule Lifecycle Directive
+ Conduct Continuous Improvement on Reporting Quality of Project Status Report
■* from PMIS in a Proj ect Lifecycle
+ i i 1 i i
1 i
IT Service or Infrastructure

Reviewed Project Status Report
Updated Project Status Report
Corrective Actions____________________
Updated Quality KPI Scorecard
AO Reporting Quality Audit Results
Note 3: KPI = Key
Performance Indicators
Support Standard Note 4: PM = Project Manager
Infrastructure Commercial
Transaction Set
Fig.1. Conduct Continuous Quality Improvement Process on the Project Status Report from PMIS in the Project Lifecycle
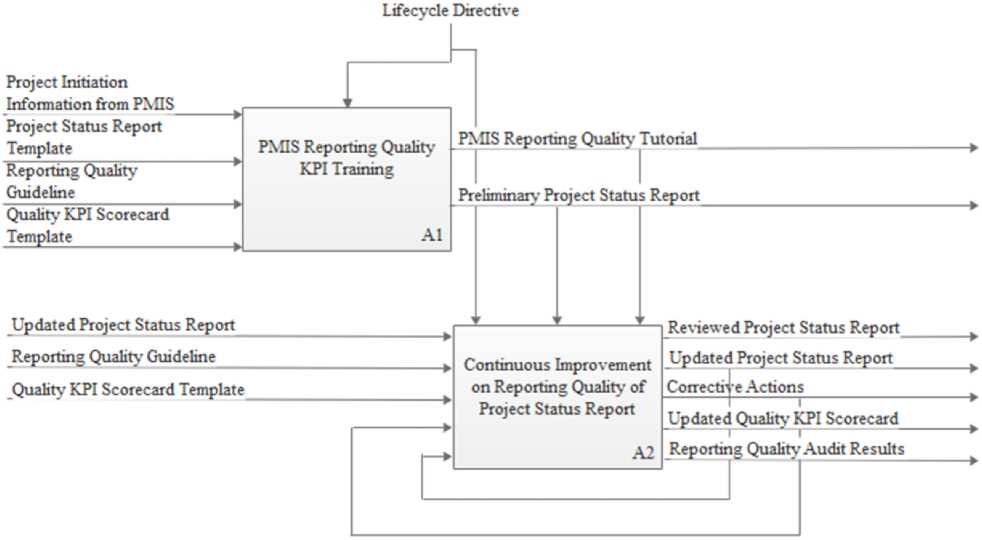
Fig.2. Conduct PMIS Reporting Quality KPI Training and Continuous Quality Improvement on the Project Status Report from PMIS
-
B. Classify Project Having Newly Assigned Project Manager and Conduct Reporting Quality KPI Training
The decomposition of node A1 to 3 activities is shown in Fig. 3. PMIS strategically implemented is effectively used by the independent quality reviewer who does not belong to the organization unit responsible for the project delivery, in searching for the newly registered projects classified for the need of continuous quality improvement on the reporting quality of PMIS, having newly hired project managers assigned. This process for conducting the reporting quality KPI training by the internal quality reviewer plays the most important role to properly kick off the continuous quality improvement process on the reporting quality of PMIS that is to be carried out monthly in the project lifecycle.
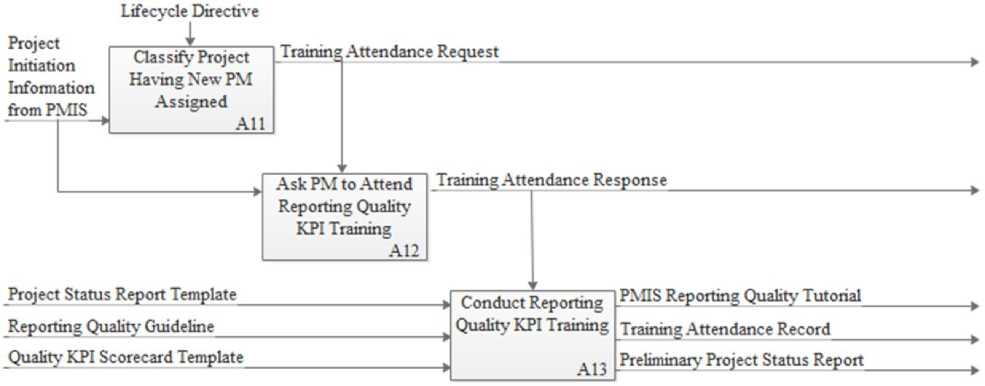
Fig.3. Classify the Project Having the Newly Assigned Project Manager and Conduct the Reporting Quality KPI Training
Below are the major activities required to plan and conduct Reporting Quality KPI Training.
-
• Node A11; Classify Project Having New Project Manager Assigned: The independent quality reviewer is to check (during the 1 st two weeks of the month) if there is any newly started project in PMIS which is having a newly hired project manager assigned and relevant for triggering the initiation of the continuous quality improvement process on the reporting quality of PMIS based on the following criteria that the Solution Provider is:
o To provide a project manager and project team o To be responsible for providing particular results based on contractual agreements o To provide advisory services that are mainly relevant to meet customers’ project goals o To provide project work with the budget of the contract that is greater than the threshold value
Table 6 shows a snapshot of the project initiation information from PMIS taken in January 2017 for classifying the project having a newly hired project manager assigned. Project J1 is identified as the classified project having the newly hired project manager, Project Manager 4 assigned.
-
• Node A12; Ask Project Manager to Attend Reporting Quality KPI Training: Once a relevant project is found:
o The independent quality reviewer is to send an email to the project manager responsible for the execution of the project, which is also copied to the delivery manager in charge of the portfolio category, based on the explanation for the need of getting Reporting Quality KPI Training conducted before a proposed due date for completion stated on the email.
o The project manager is to send back an hour meeting request with a date specified for having the Reporting Quality KPI Training conducted.
o The independent quality reviewer is to respond to the meeting invite to have the training date finally fixed.
-
• Node A13; Conduct Reporting Quality KPI Training: The independent quality reviewer is:
o To educate the project manager responsible for the project on the PDCA cycle of continuous quality improvement process, based on the quality audit monthly conducted on the project status report generated from PMIS against the reporting quality guideline, to keep the quality of the PMIS output information above the passing score threshold defined in the reporting quality KPI scorecard as evaluation criteria.
o To request the project manager to create the preliminary project status report based on the project status report template as an exercise so that it can be used as a basis for quality evaluation and corrective actions for quality improvement if necessary.
o To maintain a record for the training attendance and provide the project manager with the PMIS reporting quality tutorial, the reporting quality guideline as well as the reporting quality KPI scorecard template upon completion of the training session.
Table 6. Project Initiation Information from PMIS Classifying the Project Having the Newly Hired Project Manager Assigned
|
Project ID |
Industry Sector |
Project Manager |
Project Name |
Period |
Contract Type |
Project Type |
Planned Start |
Planned Finish |
|
PS-11170 |
Consumer / Trading |
Project Manager 4 |
Project J1 |
2017 M 01 |
T&M |
Consulting Project |
2017/1/5 |
2017/5/31 |
|
PS-11211 |
High Tech |
Project Manager 8 |
Project T |
2017 M 01 |
T&M |
Consulting Project |
2017/1/16 |
2017/9/29 |
-
C. Conduct Iterative Process of Continuous Quality Improvement on Project Status Report
The decomposition of node A2 to 6 activities is shown in Fig. 4. In an iterative process based on the PDCA cycle, a periodic quality audit by the independent quality reviewer is conducted on the relevant project status reports generated based on the information maintained by the responsible project managers upon completion of the financial month end closing of PMIS. Analysis of the audit results compiled is reported to the managers of the project delivery organization for their governance. Corrective actions for quality improvement required accordingly to the reporting quality guideline are communicated to the project managers who have not cleared the passing score threshold in the reporting quality KPI scorecard.
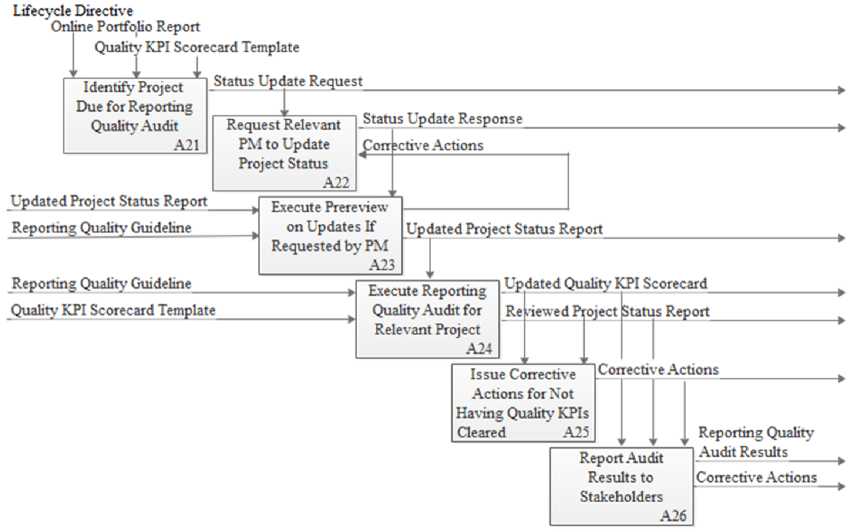
Fig.4. Conduct the Iterative Process of Continuous Quality Improvement on the Project Status Report from PMIS
Table 7. Online Portfolio Report for the Project with the Reporting Quality Audit Requirement
|
Project ID |
Industry Sector |
Project Manager |
Project Name |
Period |
Contract Type |
Project Type |
Planned Finish |
|
PS-10445 |
Consumer / Trading |
Project Manager 1 |
Project A |
2017 M 01 |
T&M |
Consulting Project |
2017/7/31 |
|
PS-10940 |
High Tech |
Project Manager 2 |
Project Y |
2017 M 01 |
T&M |
Consulting Project |
2017/3/31 |
|
PS-10300 |
Consumer / Trading |
Project Manager 3 |
Project D |
2017 M 01 |
T&M |
Consulting Project |
2018/12/31 |
|
PS-11170 |
Consumer / Trading |
Project Manager 4 |
Project J1 |
2017 M 01 |
T&M |
Consulting Project |
2017/5/31 |
|
PS-11014 |
Consumer / Trading |
Project Manager 5 |
Project J2 |
2017 M 01 |
T&M |
Consulting Project |
2017/12/29 |
|
PS-10782 |
Utilities |
Project Manager 6 |
Project K |
2017 M 01 |
T&M |
Consulting Project |
2020/3/31 |
|
PS-09236 |
High Tech |
Project Manager 7 |
Project M |
2017 M 01 |
T&M |
Consulting Project |
2017/5/31 |
|
PS-10717 |
High Tech |
Project Manager 8 |
Project S |
2017 M 01 |
T&M |
Consulting Project |
2017/3/31 |
|
PS-10275 |
Utilities |
Project Manager 9 |
Project T1 |
2017 M 01 |
T&M |
Consulting Project |
2017/9/29 |
|
PS-09889 |
Utilities |
Project Manager 10 |
Project T2 |
2017 M 01 |
T&M |
Consulting Project |
2018/1/31 |
|
PS-09250 |
Utilities |
Project Manager 11 |
Project T3 |
2017 M 01 |
T&M |
Consulting Project |
2018/1/31 |
|
PS-10781 |
Utilities |
Project Manager 11 |
Project T4 |
2017 M 01 |
T&M |
Consulting Project |
2017/1/31 |
|
PS-09796 |
High Tech |
Project Manager 12 |
Project G |
2017 M 01 |
T&M |
Consulting Project |
2019/1/31 |
|
PS-09862 |
Process / Auto |
Project Manager 13 |
Project O |
2017 M 01 |
T&M |
Consulting Project |
2017/5/31 |
|
PS-11211 |
High Tech |
Project Manager 8 |
Project T |
2017 M 01 |
T&M |
Consulting Project |
2017/9/29 |
Below are the steps of major activities required for conducting Continuous Quality Improvement.
-
• Node A21; Identify Project Due for Reporting Quality Audit: By leveraging the Online Portfolio Report that is available in PMIS, the independent quality reviewer is to check the set of relevant projects (based on the criteria set by the Solution Provider) for triggering the iterative process of continuous quality improvement on the reporting quality of PMIS on the 25th of every month. Table 7 shows the set of selected projects classified for continuous quality improvement on the project status report from PMIS due for the monthly reporting quality audit.
-
• Node A22; Request Relevant Project Managers to Update Project Status: For covering each project relevant for continuous quality improvement on the project status report due for the reporting quality audit, the independent quality reviewer is:
o To send an email request to the project manager responsible for execution of the project, which is also copied to the delivery manager in charge of the portfolio category, for getting the project status report updated by the due date specified upon completion of the financial month end closing of PMIS.
o To request the project manager to ask any questions on how to enter the contents of project status report and the prereview on the update if required.
-
• Node A23; Execute Prereview on Updates If Requested by Project Manager: The following major activities are conducted:
o The project manager is to send the updated project status report for review by email to the independent quality reviewer at the earliest timing possible prior to the deadline specified.
o The independent quality reviewer is to provide the project manager with the review results on the updated project status report submitted for prereview by return.
-
• Node A24; Execute Reporting Quality Audit for Relevant Project: The following major activities are conducted:
o The independent quality reviewer is to audit the reporting quality on the latest project status report from PMIS, updated right after the previous month end closing, against the reporting quality guideline along with the reporting quality KPI scorecard template based on the following criteria:
-
• Good Standing: Indicates that the reporting quality audit is passed with the passing score of 4 or above earned in the data maturity index of the quality reporting KPI scorecard. No further action is required except for what is stated as comments for improvement.
-
• Improvement Required: Indicates that the reporting quality audit has not cleared the passing score threshold of 4 in the data maturity index of the quality reporting KPI scorecard. The further corrective actions for reporting quality improvement entered in the reporting quality KPI scorecard are to be applied and completed by the next reporting cycle.
-
• Node A25; Issue Corrective Actions for Not Having Quality KPIs Cleared: The independent quality reviewer is to communicate by email to the project manager and the delivery manager in charge:
o The results of the evaluation on each review item of the project status report against the respective target metric of reporting quality guideline along with the corrective actions (if required), which are entered in the reporting quality KPI scorecard.
Table 8 shows the list of projects not having the quality KPIs cleared with the corrective actions issued in the reporting quality KPI scorecard.
-
• Node A26; Report Audit Results to Stakeholders: The independent quality reviewer is to report by email the final quality audit results to the head of project delivery organization and the delivery managers for their governance on the corrective actions issued for quality improvement. Table 9 shows the quality audit results of the project status report generated from PMIS on all the project manager assigned consulting projects classified for the iterative process of continuous quality improvement upon completion of the financial month end closing of January 2017.
Table 8. Project Earning the Failing Score in the Data Maturity Index of Reporting Quality KPI Scorecard with Corrective Actions
|
Project Manager |
Project Name |
Period |
Metric 1: Timeliness (1) |
Metric 2: Scope (2) |
Metric 3: Summary (2) |
Metric 4: Risks/Issues (2) |
Metric 5: Financials (2) |
Metric 6: Milestones (4) |
Metric 7: CEM (2) |
Metric 8: Use of PMIS (1) |
Total Score (16) |
Data Matutiy Index (DMI) (5 point scale) |
Review Comments and Corrective Actions |
|
Project Manager 1 |
Project A |
2017 M 01 |
1 |
2 |
2 |
2 |
2 |
1 |
0 |
1 |
11 |
3 |
M/s: Bi-weekly based planned action item is to be entered and clearly express the target planned in specificity and granularity. Also, it needs to start with an effective "Action Verb". CEM: No evidence stored in PMIS. |
|
Project Manager 4 |
Project J1 |
2017 M 01 |
1 |
2 |
2 |
2 |
1 |
1 |
0 |
1 |
10 |
3 |
Financials: Why the cost at EAC increased by 1.1% was not explained. Please also provide the corrective action to get it back. M/s: Bi-weekly based planned action item is to be entered and clearly express the target planned in specificity and granularity. Also, it needs to start with an effective "Action Verb". CEM: No evidence stored in PMIS. |
|
Project Manager 6 |
Project K |
2017 M 01 |
1 |
2 |
2 |
2 |
2 |
0 |
0 |
1 |
10 |
3 |
M/s: Planned action items for the month of January not entered at all. Bi-weekly based planned action item is to be entered and clearly express the target planned in specificity and granularity. Also, it needs to start with an effective "Action Verb". CEM: No evidence stored in PMIS. |
Table 9. Quality Audit Results of the Reporting Quality KPIs on the Project Status Report from PMIS for January 2017
|
Project Manager |
Project Name |
Period |
Metric 1: Timeliness (1) |
Metric 2: Scope (2) |
Metric 3: Summary (2) |
Metric 4: Risks/Issues (2) |
Metric 5: Financials (2) |
Metric 6: Milestones (4) |
Metric 7: CEM (2) |
Metric 8: Use of PMIS (1) |
Total Score (16) |
Data Matutiy Index (DMI) (5 point scale) |
Review Comments and Corrective Actions |
|
Project Manager 1 |
Project A |
2017 M 01 |
1 |
2 |
2 |
2 |
2 |
1 |
0 |
1 |
11 |
3 |
M/s: Bi-weekly based planned action item is to be entered and clearly express the target planned in specificity and granularity. Also, it needs to start with an effective "Action Verb". CEM: No evidence stored in PMIS |
|
Project Manager 2 |
Project Y |
2017 M 01 |
1 |
2 |
2 |
2 |
2 |
2 |
0 |
1 |
12 |
4 |
M/s: Bi-weekly based planned action item is to be entered and clearly express the target planned in specificity and granularity. CEM: No evidence stored in PMIS. |
|
Project Manager 3 |
Project D |
2017 M 01 |
1 |
2 |
2 |
2 |
2 |
2 |
0 |
1 |
12 |
4 |
M/s: Express the action items bi-weekly planned in specificity and granularity. Also, it needs to start with an effective "Action Verb" as it is not done that way. CEM: No evidence stored in PMIS. |
|
Project Manager 4 |
Project J1 |
2017 M 01 |
1 |
2 |
2 |
2 |
1 |
1 |
0 |
1 |
10 |
3 |
Financials: Why the cost at EAC increased by 1.1% was not explained. Please also provide the corrective action to get it back. M/s: Bi-weekly based planned action item is to be entered and clearly express the target planned in specificity and granularity. Also, it needs to start with an effective "Action Verb". CEM: No evidence stored in PMIS. |
|
Project Manager 5 |
Project J2 |
2017 M 01 |
1 |
2 |
2 |
2 |
2 |
2 |
0 |
1 |
12 |
4 |
M/s: Bi-weekly based planned action item is to be entered and clearly express the target planned in specificity and granularity. CEM: No evidence stored in PMIS. |
|
Project Manager 6 |
Project K |
2017 M 01 |
1 |
2 |
2 |
2 |
2 |
0 |
0 |
1 |
10 |
3 |
M/s: Planned action items for the month of January not entered at all. Bi-weekly based planned action item is to be entered and clearly express the target planned in specificity and granularity. Also, it needs to start with an effective "Action Verb". CEM: No evidence stored in PMIS. |
|
Project Manager 7 |
Project M |
2017 M 01 |
1 |
2 |
2 |
2 |
2 |
4 |
0 |
1 |
14 |
4 |
CEM: No evidence stored in PMIS. |
|
Project Manager 8 |
Project S |
2017 M 01 |
1 |
2 |
2 |
2 |
2 |
4 |
0 |
1 |
14 |
4 |
CEM: No evidence stored in PMIS. |
|
Project Manager 9 |
Project T1 |
2017 M 01 |
1 |
2 |
2 |
2 |
2 |
2 |
0 |
1 |
12 |
4 |
M/s: Express the action items bi-weekly planned in specificity and granularity. Also, it needs to start with an effective "Action Verb" as it is not done that way. CEM: No evidence stored in PMIS. |
|
Project Manager 10 |
Project T2 |
2017 M 01 |
1 |
2 |
2 |
2 |
2 |
2 |
0 |
1 |
12 |
4 |
M/s: Express the action items bi-weekly planned in specificity and granularity. Also, it needs to start with an effective "Action Verb" as it is not done that way. CEM: No evidence stored in PMIS. |
|
Project Manager 11 |
Project T3 |
2017 M 01 |
1 |
2 |
2 |
2 |
2 |
2 |
0 |
1 |
12 |
4 |
CEM: No evidence stored in PMIS. |
|
Project Manager 11 |
Project T4 |
2017 M 01 |
1 |
2 |
2 |
2 |
2 |
2 |
0 |
1 |
12 |
4 |
M/s: Express the action items bi-weekly planned in specificity and granularity. Also, it needs to start with an effective "Action Verb" as it is not done that way. CEM: No evidence stored in PMIS. |
|
Project Manager 12 |
Project G |
2017 M 01 |
1 |
2 |
2 |
2 |
2 |
2 |
0 |
1 |
12 |
4 |
M/s: Express the action items bi-weekly planned in specificity and granularity. Also, it needs to start with an effective "Action Verb" as it is not done that way. CEM: No evidence stored in PMIS. |
|
Project Manager 13 |
Project O |
2017 M 01 |
1 |
2 |
2 |
2 |
2 |
4 |
0 |
1 |
14 |
4 |
CEM: No evidence stored in PMIS. |
|
Project Manager 8 |
Project T |
2017 M 01 |
1 |
2 |
2 |
2 |
2 |
4 |
0 |
1 |
14 |
4 |
CEM: No evidence stored in PMIS. |
-
V. R esults
The quality audit results in the project lifecycle of Project J1 and Project T, the two projects identified in Table 6 are shown in Table 10 and Table 11 respectively. Project J1 was conducted by the newly hired project manager and Project T was conducted by the experienced senior project manager who is used to the reporting quality requirements of PMIS. At any rate, both the projects have achieved the passing score for the data maturity index of the reporting quality KPI scorecards in the iterative process of continuous quality improvement. They were also completed successfully in terms of project management, respecting the time, cost and quality.
Likewise, there were six other projects, Project S,
Project Y, Project M, Project O, Project A, and Project T1 described in Table 7, having been carried out since 2016 based on the application of PDCA cycle on continuous quality improvement of the PMIS output information that were completed successfully till the end of September 2017 for the period of this study, achieving the reporting quality KPIs of PMIS at the satisfactory level as shown in Table 12, Table 13, Table 14, Table 15, Table 16, and Table 17 respectively, and respecting the time, cost and quality in terms of project management.
Lastly, there was one project, Project T4 described in Table 7 based on the final quality audit results in January 2017, shown in Table 9 with the passing score of 4 was also completed achieving project management success in terms of respecting the time, cost and quality.
Table 10. Quality Audit Results of Project J1 by Reporting Cycle
|
Project Manager |
Project Name |
Period |
Metric 1: Timeliness (1) |
Metric 2: Scope (2) |
Metric 3: Summary (2) |
Metric 4: Risks/Issues (2) |
Metric 5: Financials (2) |
Metric 6: Milestones (4) |
Metric 7: CEM (2) |
Metric 8: Use of PMIS (1) |
Total Score (16) |
Data Matutiy Index (DMI) (5 point scale) |
Review Comments and Corrective Actions |
|
Project Manager 4 |
Project J1 |
2017 M 01 |
1 |
2 |
2 |
2 |
1 |
1 |
0 |
1 |
10 |
3 |
Financials: Why the cost at EAC increased by 1.1% was not explained. Please also provide the corrective action to get it back. M/s: Bi-weekly based planned action item is to be entered and clearly express the target planned in specificity and granularity. Also, it needs to start with an effective "Action Verb". CEM: No evidence stored in PMIS. |
|
Project Manager 4 |
Project J1 |
2017 M 02 |
1 |
2 |
2 |
2 |
2 |
1 |
0 |
1 |
11 |
3 |
M/s: Bi-weekly based planned action item is to be entered and clearly express the target planned in specificity and granularity. Also, it needs to start with an effective "Action Verb". CEM: No evidence stored in PMIS. |
|
Project Manager 4 |
Project J1 |
2017 M 03 |
1 |
2 |
2 |
2 |
2 |
2 |
0 |
1 |
12 |
4 |
M/s: Bi-weekly based planned action item is to be entered and clearly express the target planned in specificity and granularity. CEM: No evidence stored in PMIS. |
|
Project Manager 4 |
Project J1 |
2017 M 04 |
1 |
2 |
2 |
2 |
2 |
2 |
0 |
1 |
12 |
4 |
M/s: Bi-weekly based planned action item is to be entered and clearly express the target planned in specificity and granularity. CEM: No evidence stored in PMIS. |
|
Project Manager 4 |
Project J1 |
2017 M 05 |
1 |
2 |
2 |
2 |
2 |
2 |
0 |
1 |
12 |
4 |
M/s: Bi-weekly based planned action item is to be entered and clearly express the target planned in specificity and granularity. CEM: No evidence stored in PMIS. |
Table 11. Quality Audit Results of Project T by Reporting Cycle
|
Project Manager |
Project Name |
Period |
Metric 1: Timeliness (1) |
Metric 2: Scope (2) |
Metric 3: Summary (2) |
Metric 4: Risks/Issues (2) |
Metric 5: Financials (2) |
Metric 6: Milestones (4) |
Metric 7: CEM (2) |
Metric 8: Use of PMIS (1) |
Total Score (16) |
Data Matutiy Index (DMI) (5 point scale) |
Review Comments and Corrective Actions |
|
Project Manager 8 |
Project T |
2017 M 01 |
1 |
2 |
2 |
2 |
2 |
4 |
0 |
1 |
14 |
4 |
CEM: No evidence stored in PMIS. |
|
Project Manager 8 |
Project T |
2017 M 02 |
1 |
2 |
2 |
2 |
2 |
4 |
0 |
1 |
14 |
4 |
CEM: No evidence stored in PMIS. |
|
Project Manager 8 |
Project T |
2017 M 03 |
1 |
2 |
2 |
2 |
2 |
4 |
0 |
1 |
14 |
4 |
CEM: No evidence stored in PMIS. |
|
Project Manager 8 |
Project T |
2017 M 04 |
1 |
2 |
2 |
2 |
2 |
4 |
0 |
1 |
14 |
4 |
CEM: No evidence stored in PMIS. |
|
Project Manager 8 |
Project T |
2017 M 05 |
1 |
2 |
2 |
2 |
2 |
4 |
0 |
1 |
14 |
4 |
CEM: No evidence stored in PMIS. |
|
Project Manager 8 |
Project T |
2017 M 06 |
1 |
2 |
2 |
2 |
2 |
4 |
0 |
1 |
14 |
4 |
CEM: No evidence stored in PMIS. |
|
Project Manager 8 |
Project T |
2017 M 07 |
1 |
2 |
2 |
2 |
2 |
4 |
0 |
1 |
14 |
4 |
CEM: No evidence stored in PMIS. |
|
Project Manager 8 |
Project T |
2017 M 08 |
1 |
2 |
2 |
2 |
2 |
4 |
0 |
1 |
14 |
4 |
CEM: No evidence stored in PMIS. |
|
Project Manager 8 |
Project T |
2017 M 09 |
1 |
2 |
2 |
2 |
2 |
4 |
0 |
1 |
14 |
4 |
CEM: No evidence stored in PMIS. |
Table 12. Quality Audit Results of Project S by Reporting Cycle
|
Project Manager |
Project Name |
Period |
Metric 1: Timeliness (1) |
Metric 2: Scope (2) |
Metric 3: Summary (2) |
Metric 4: Risks/Issues (2) |
Metric 5: Financials (2) |
Metric 6: Milestones (4) |
Metric 7: CEM (2) |
Metric 8: Use of PMIS (1) |
Total Score (16) |
Data Matutiy Index (DMI) (5 point scale) |
Review Comments and Corrective Actions |
|
Project Manager 8 |
Project S |
2017 M 01 |
1 |
2 |
2 |
2 |
2 |
4 |
0 |
1 |
14 |
4 |
CEM: No evidence stored in PMIS. |
|
Project Manager 8 |
Project S |
2017 M 02 |
1 |
2 |
2 |
2 |
2 |
4 |
0 |
1 |
14 |
4 |
CEM: No evidence stored in PMIS. |
|
Project Manager 8 |
Project S |
2017 M 03 |
1 |
2 |
2 |
2 |
2 |
4 |
0 |
1 |
14 |
4 |
CEM: No evidence stored in PMIS. |
Table 13 Quality Audit Results of Project Y by Reporting Cycle
|
Project Manager |
Project Name |
Period |
Metric 1: Timeliness (1) |
Metric 2: Scope (2) |
Metric 3: Summary (2) |
Metric 4: Risks/Issues (2) |
Metric 5: Financials (2) |
Metric 6: Milestones (4) |
Metric 7: CEM (2) |
Metric 8: Use of PMIS (1) |
Total Score (16) |
Data Matutiy Index (DMI) (5 point scale) |
Review Comments and Corrective Actions |
|
Project Manager 2 |
Project Y |
2017 M 01 |
1 |
2 |
2 |
2 |
2 |
2 |
0 |
1 |
12 |
4 |
M/s: Bi-weekly based planned action item is to be entered and clearly express the target planned in specificity and granularity. CEM: No evidence stored in PMIS. |
|
Project Manager 2 |
Project Y |
2017 M 02 |
1 |
2 |
2 |
2 |
2 |
2 |
0 |
1 |
12 |
4 |
M/s: Bi-weekly based planned action item is to be entered and clearly express the target planned in specificity and granularity. CEM: No evidence stored in PMIS. |
|
Project Manager 2 |
Project Y |
2017 M 03 |
1 |
2 |
2 |
2 |
2 |
2 |
0 |
1 |
12 |
4 |
M/s: Bi-weekly based planned action item is to be entered and clearly express the target planned in specificity and granularity. CEM: No evidence stored in PMIS. |
Table 14. Quality Audit Results of Project M by Reporting Cycle
|
Project Manager |
Project Name |
Period |
Metric 1: Timeliness (1) |
Metric 2: Scope (2) |
Metric 3: Summary (2) |
Metric 4: Risks/Issues (2) |
Metric 5: Financials (2) |
Metric 6: Milestones (4) |
Metric 7: CEM (2) |
Metric 8: Use of PMIS (1) |
Total Score (16) |
Data Matutiy Index (DMI) (5 point scale) |
Review Comments and Corrective Actions |
|
Project Manager 7 |
Project M |
2017 M 01 |
1 |
2 |
2 |
2 |
2 |
4 |
0 |
1 |
14 |
4 |
CEM: No evidence stored in PMIS. |
|
Project Manager 7 |
Project M |
2017 M 02 |
1 |
2 |
2 |
2 |
2 |
4 |
0 |
1 |
14 |
4 |
CEM: No evidence stored in PMIS. |
|
Project Manager 7 |
Project M |
2017 M 03 |
1 |
2 |
2 |
2 |
2 |
4 |
0 |
1 |
14 |
4 |
CEM: No evidence stored in PMIS. |
|
Project Manager 7 |
Project M |
2017 M 04 |
1 |
2 |
2 |
2 |
2 |
4 |
0 |
1 |
14 |
4 |
CEM: No evidence stored in PMIS. |
|
Project Manager 7 |
Project M |
2017 M 05 |
1 |
2 |
2 |
2 |
2 |
4 |
0 |
1 |
14 |
4 |
CEM: No evidence stored in PMIS. |
Table 15 Quality Audit Results of Project O by Reporting Cycle
|
Project Manager |
Project Name |
Period |
Metric 1: Timeliness (1) |
Metric 2: Scope (2) |
Metric 3: Summary (2) |
Metric 4: Risks/Issues (2) |
Metric 5: Financials (2) |
Metric 6: Milestones (4) |
Metric 7: CEM (2) |
Metric 8: Use of PMIS (1) |
Total Score (16) |
Data Matutiy Index (DMI) (5 point scale) |
Review Comments and Corrective Actions |
|
Project Manager 13 |
Project O |
2017 M 01 |
1 |
2 |
2 |
2 |
2 |
4 |
0 |
1 |
14 |
4 |
CEM: No evidence stored in PMIS. |
|
Project Manager 13 |
Project O |
2017 M 02 |
1 |
2 |
2 |
2 |
2 |
4 |
0 |
1 |
14 |
4 |
CEM: No evidence stored in PMIS. |
|
Project Manager 13 |
Project O |
2017 M 03 |
1 |
2 |
2 |
2 |
2 |
4 |
0 |
1 |
14 |
4 |
CEM: No evidence stored in PMIS. |
|
Project Manager 13 |
Project O |
2017 M 04 |
1 |
2 |
2 |
2 |
2 |
4 |
0 |
1 |
14 |
4 |
CEM: No evidence stored in PMIS. |
|
Project Manager 13 |
Project O |
2017 M 05 |
1 |
2 |
2 |
2 |
2 |
4 |
0 |
1 |
14 |
4 |
CEM: No evidence stored in PMIS. |
Table 16 Quality Audit Results of Project A by Reporting Cycle
|
Project Manager |
Project Name |
Period |
Metric 1: Timeliness (1) |
Metric 2: Scope (2) |
Metric 3: Summary (2) |
Metric 4: Risks/Issues (2) |
Metric 5: Financials (2) |
Metric 6: Milestones (4) |
Metric 7: CEM (2) |
Metric 8: Use of PMIS (1) |
Total Score (16) |
Data Matutiy Index (DMI) (5 point scale) |
Review Comments and Corrective Actions |
|
Project Manager 1 |
Project A |
2017 M 01 |
1 |
2 |
2 |
2 |
2 |
1 |
0 |
1 |
11 |
3 |
M/s: Bi-weekly based planned action item is to be entered and clearly express the target planned in specificity and granularity. Also, it needs to start with an effective "Action Verb". CEM: No evidence stored in PMIS |
|
Project Manager 1 |
Project A |
2017 M 02 |
1 |
2 |
2 |
2 |
2 |
2 |
0 |
1 |
12 |
4 |
M/s: Bi-weekly based planned action item is to be entered and clearly express the target planned in specificity and granularity. CEM: No evidence stored in PMIS. |
|
Project Manager 1 |
Project A |
2017 M 03 |
1 |
2 |
2 |
2 |
2 |
1 |
0 |
1 |
11 |
3 |
M/s: No updates properly made on the activities planned for the month of March. Bi-weekly based planned action item is to be entered and clearly express the target planned in specificity and granularity. CEM: No evidence stored in PMIS. |
|
Project Manager 1 |
Project A |
2017 M 04 |
1 |
2 |
2 |
2 |
2 |
2 |
0 |
1 |
12 |
4 |
M/s: Bi-weekly based planned action item is to be entered and clearly express the target planned in specificity and granularity. CEM: No evidence stored in PMIS. |
|
Project Manager 1 |
Project A |
2017 M 05 |
1 |
2 |
2 |
2 |
2 |
2 |
0 |
1 |
12 |
4 |
M/s: Bi-weekly based planned action item is to be entered and clearly express the target planned in specificity and granularity. CEM: No evidence stored in PMIS. |
|
Project Manager 1 |
Project A |
2017 M 06 |
1 |
2 |
2 |
2 |
2 |
2 |
0 |
1 |
12 |
4 |
M/s: Bi-weekly based planned action item is to be entered and clearly express the target planned in specificity and granularity. CEM: No evidence stored in PMIS. |
|
Project Manager 1 |
Project A |
2017 M 07 |
1 |
2 |
2 |
2 |
2 |
2 |
0 |
1 |
12 |
4 |
M/s: Bi-weekly based planned action item is to be entered and clearly express the target planned in specificity and granularity. CEM: No evidence stored in PMIS. |
Table 17. Quality Audit Results of Project T1 by Reporting Cycle
|
Project Manager |
Project Name |
Period |
Metric 1: Timeliness (1) |
Metric 2: Scope (2) |
Metric 3: Summary (2) |
Metric 4: Risks/Issues (2) |
Metric 5: Financials (2) |
Metric 6: Milestones (4) |
Metric 7: CEM (2) |
Metric 8: Use of PMIS (1) |
Total Score (16) |
Data Matutiy Index (DMI) (5 point scale) |
Review Comments and Corrective Actions |
|
Project Manager 9 |
Project T1 |
2017 M 01 |
1 |
2 |
2 |
2 |
2 |
2 |
0 |
1 |
12 |
4 |
M/s: Express the action items bi-weekly planned in specificity and granularity. Also, it needs to start with an effective "Action Verb" as it is not done that way. CEM: No evidence stored in PMIS. |
|
Project Manager 9 |
Project T1 |
2017 M 02 |
1 |
2 |
2 |
2 |
2 |
2 |
0 |
1 |
12 |
4 |
M/s: Express the action items bi-weekly planned in specificity and granularity. Also, it needs to start with an effective "Action Verb" as it is not done that way. CEM: No evidence stored in PMIS. |
|
Project Manager 9 |
Project T1 |
2017 M 03 |
1 |
2 |
2 |
2 |
2 |
2 |
0 |
1 |
12 |
4 |
M/s: Express the action items bi-weekly planned in specificity and granularity. Also, it needs to start with an effective "Action Verb" as it is not done that way. CEM: No evidence stored in PMIS. |
|
Project Manager 9 |
Project T1 |
2017 M 04 |
1 |
2 |
2 |
2 |
2 |
2 |
0 |
1 |
12 |
4 |
M/s: Express the action items bi-weekly planned in specificity and granularity. Also, it needs to start with an effective "Action Verb" as it is not done that way. CEM: No evidence stored in PMIS. |
|
Project Manager 9 |
Project T1 |
2017 M 05 |
1 |
2 |
2 |
2 |
2 |
2 |
0 |
1 |
12 |
4 |
M/s: Express the action items bi-weekly planned in specificity and granularity. Also, it needs to start with an effective "Action Verb" as it is not done that way. CEM: No evidence stored in PMIS. |
|
Project Manager 9 |
Project T1 |
2017 M 06 |
1 |
2 |
2 |
2 |
2 |
2 |
0 |
1 |
12 |
4 |
M/s: Express the action items bi-weekly planned in specificity and granularity. Also, it needs to start with an effective "Action Verb" as it is not done that way. CEM: No evidence stored in PMIS. |
|
Project Manager 9 |
Project T1 |
2017 M 07 |
1 |
2 |
2 |
2 |
2 |
2 |
0 |
1 |
12 |
4 |
M/s: Express the action items bi-weekly planned in specificity and granularity. Also, it needs to start with an effective "Action Verb" as it is not done that way. CEM: No evidence stored in PMIS. |
|
Project Manager 9 |
Project T1 |
2017 M 08 |
1 |
2 |
2 |
2 |
2 |
2 |
0 |
1 |
12 |
4 |
M/s: Express the action items bi-weekly planned in specificity and granularity. Also, it needs to start with an effective "Action Verb" as it is not done that way. CEM: No evidence stored in PMIS. |
|
Project Manager 9 |
Project T1 |
2017 M 09 |
1 |
2 |
2 |
2 |
2 |
2 |
0 |
1 |
12 |
4 |
M/s: Express the action items bi-weekly planned in specificity and granularity. Also, it needs to start with an effective "Action Verb" as it is not done that way. CEM: No evidence stored in PMIS. |
-
VI. C onclusion
As discussed in Section V, the results of the case study indicate that the continuous improvement on the reporting quality of PMIS was found to be effective in:
-
• Achieving quality of PMIS output information to help managers in decision making, planning, organizing and controlling the project [1], as they rely on PMIS 100% for the project financials in terms of project management for predicting and controlling the outcome of the project based on the early detection of issues and risks.
-
• Influencing project management success in terms of the three project management dimensions [13] positively as follows:
o Meeting the quality specifications of the project
Since January 2017, a total of nine projects listed in Table 7 has been completed achieving project management success in terms of respecting the time, cost and quality.
PMIS that captures 100% of the closed contracts used for reporting the monthly project financials can surely influence the project managers on getting the passing score on the reporting quality KPIs for achieving project management success.
References Effect of continuous improvement on the reporting quality of project management information system for project management success
- S. Fallah, Y. Gholipour-Kanani, “The Effect of Project Management Information System on Project Managers and Project Success,” Journal for Studies in Management and Planning, April 2016, Volume 02, Issue 4.
- S. Berzisa, “Application of Project Management Information Systems in Efficiency Improvement of Quality Management System,” in Proceedings of the 10th International Scientific and Practical Conference on Environment. Technology. Resources, (2015), Volume III, 17-21. DOI: http://dx.doi.org/10.17770/etr2015vol3.173
- L. Raymond, F. Bergeron, “Project Management Information Systems: An Empirical Study of Their Impact on Project Managers and Project Success,” International Journal of Project Management, 26 (2008), 213-220.
- W. H. DeLone, E. R. McLean, “The DeLone and McLean Model of Information Systems Success: A Ten-Year Update,” Journal of Management Information Systems, Spring 2003, Vol. 19, No. 4, 9-30.
- D. Baccarini, “The Logical Framework Method for Defining Project Success,” Project Management Journal, December 1999, Vol. 30, No. 4, 25-32.
- S. A. El_Rahman, B. A. Al-Twaim, “Development of Quality Assurance System for Academic Programs and Courses Reports,” International Journal of Modern Education and Computer Science, 2015, 6, 30-36. DOI: 10.5815/ijmecs.201506.05.
- J. A. Lorch, V. E. Pollak, “Continuous Improvement in Daily Clinical Practice: A Proof of Concept Study,” PLOS ONE, May 2014, Volume 9, Issue 5, e97066. DOI: 10.1371/journal.pone.0097066.
- E. Gidey, K. Jilcha, B. Beshah, D. Kitaw, “The Plan-Do-Check-Act Cycle of Value Addition,” Industrial Engineering & Management, 2014, Volume 3, Issue 1, 1000124. DOI: 10.4172/2169-0316.1000124.
- J. E. Knight, S. Allen, “Applying the PDCA Cycle to the Complex Task of Teaching and Assessing Public Relations Writing,” International Journal of Higher Education, Sciedu Press, 2012, Vol. 1, No. 2. DOI: 10.5430/ijhe.v1n2p67.
- M. Y. Ong, B. Muniandy, S. L. Ong, K. N. Tang, K. K. Phua, “Comparing the Acceptance of Key Performance Indicators Management Systems on Perceived Usefulness and Perceived Ease of Use in a Higher Education Institution in Malaysia,” International Journal of Education and Computer Science, 2012, 10, 9-16. DOI: 10.5815/ijmecs.2012.10.02.
- M. R. J. Qureshi, A. M. Abdulkhalaq, “Increasing ERP Implementation Success Ratio by Focusing on Data Quality & User Participation,” International Journal of Information Engineering and Electronic Business, 2015, 3, 20-25. DOI: 10.5815/ijieeb.2015.03.03.
- H. R. Kerzner, Ph.D., Project Management - Best Practices: Achieving Global Excellence, Third Edition, John Wiley & Sons, Inc., 207-211, 2014.
- A. A. Shojaie, M. Shadalooie, K. Khalili-Damghani, M. R. Pakzad, “Development of a Conceptual Model of Project Management Information Systems for Investigating its Effective Factors Impacting the Success of Project Using Structural Equation Model,” International Journal of Life Science & Pharma Research, Special Issue, SP 2016, Issue 1, 17-29.
- M. Matsuo, J. Nakahara, “The effects of the PDCA cycle and OJT on workplace learning,” The International Journal of Human Resource Management, January 2013, Vol.24, No. 1, 195-207. DOI: abs/10.1080/09585192.2012.674961.
- J. J. Dahlgaard, K. Kristensen, G. K. Kanji, “Total Quality Management and Education,” 1995, Taylor & Francis, 445-456. DOI: 10.1080/09544129550035116.
- M. Y. Ong, B. Muniandy, S. L. Ong, K. N. Tang, K. K. Phua, “User Acceptance of Key Performance Indicators Management Systems in a Higher Education Institution in Malaysia: A Pilot Study,” International Online Journal of Educational Sciences, 2013, 5(1), 22-31.
- S. U. Amin, J. Aftab, H. Sarwar, H. Sarwar, “Influence of Project Management Performance Indicators on Project Success in Construction Industry of Punjab, Pakistan,” International Research Journal of Management Science, 2016, Vol. 4 (8), 511-520.
- B. Marr, “How to Design Key Performance Indicators, Management Case Study,” The Advanced Performance Institute, BWMC Ltd., 2010.
- V. R. Montequin, F. O. Fernandez, C. A. Perez, J. V. Balsera, “Scorecard and KPIs for Monitoring Software Factories Effectiveness in the Financial Sector,” International Journal of Information Systems and Project Management, 2013, Vol. 1, No. 3, 29-43. DOI: 10.12821/ijispm010302
- Project Management Institute, A Guide to the Project Management Body of Knowledge (PMBOK® Guide)-Sixth Edition. PMI, 2017-09-22.
- ISO, ISO 9001:2015 – Quality management systems – Requirements. Fifth edition, 2015-09-15.
- S. Berzisa, “The Baseline Configuration of Project Management Information System,” Scientific Journal of Riga Technical University, Computer Science, 2009, Vol. 5, No. 40, 59-65.
- M. Light, B. Rosser, S. Hayward, Realizing the benefits of projects and portfolio management, Gartner, Research ID: G00125673, January 4, 2005, 1-31.
- S. Berzisa, “Application of Knowledge and Best Practices in Configuration of Project Management Information Systems,” Ph.D. Thesis, Riga Technical University, Latvia, 2012.
- S. Berzisa, “Project Management Knowledge Retrieval: Project Classification,” in Environment. Technology. Resources: Proceedings of 8th International Scientific and Practical Conference, June 20-22, 2011, Volume II, Vol. I, 33-39.
- A. Taniguchi, M. Onosato, “Use of Project Management Information System to Initiate the Quality Gate Process for ERP Implementation,” International Journal of Information Technology and Computer Science, 2017, Vol. 9, No. 12, 1-10. DOI: 10.5815/ijitcs.2017.12.01
- B. El-Sharef, K. S. El-Kilany, “Process Modeling and Analysis of a Quality Management System for Higher Education,” in Proceedings of the World Congress on Engineering 2011, Vol. I, WCE 2011, July 6-8, 2011, London, U. K.
- L. Tsironis, A. Gentsos, V. Moustakis, “Empowerment the IDEF0 Modeling Language,” International Journal of Business and Management, May 2008, Vol. 3, No. 5, 109-118.
