Effectiveness of health education on knowledge of hypertension among hypertensive patient - a pilot analysis

Author: Vasantha K.K.R., Hemavathy V.
Journal: Cardiometry @cardiometry
Section: Original research
Article in issue: 22, 2022.
Free access
Hyper tension is often known as high blood pressure. It is a serious medical condition that raises the risk of heart attack, stroke, renal failure, and blindness. When the systolic blood pressure readings are greater than or equal to 140 millimeters of mercury and the diastolic blood pressure readings are greater than or equal to 90 millimeters of mercury on two different days, hypertension is diagnosed. It is one of the leading causes of death in the world. Of the assessed 1130000000 people who have hypertension, fewer than 1 in 5 have it under control. The main contributors to the increase in hypertension are unhealthy diets, physical inactivity.In 2025; anpredictable 1.56 billion adults will be living with hypertension.).The aim of the study is to assess the Awareness regarding Hypertension among hypertensive patient.In this study, the pre-experimental research design was accepted. The samples of the present study were patients with pre hypertension and stage -I hypertension. Conclusion: This pilot study concludes by proving the efficiency of health education on Knowledge of hypertension among rural adult hypertensive patient.
Hypertension, health education, systolic, diastolic, knowledge, blood pressure
Short address: https://sciup.org/148324634
IDR: 148324634 | DOI: 10.18137/cardiometry.2022.22.497503
Text of the scientific article Effectiveness of health education on knowledge of hypertension among hypertensive patient - a pilot analysis
p. 497-503; DOI: 10.18137/cardiometry.2022.22.497503; Available from: effectiveness_health_education
When blood pressure is high, it is called hypertension [1]. .Blood pressure is expressed as two numbers. When the heart contracts or beats, the first number (systolic) represents the pressure in the blood arteries. The second number (diastolic) denotes the pressure in the arteries while the heart is at rest between beats (WHO 2019) [2]. High blood pressure is a significant medical disease that increases the chances of having a heart attack, stroke, kidney failure, and blindness [3]. It is one of the main causes of death in children around the world. In 2025, an estimated 1560000000 individuals will suffer from hypertension. Hypertension kills nearly 8000000 people every year, worldwide and nearly 1500000 people each year in the South-East Asia Region (WHO).Unhealthy diets, physical inactivity, and the consumption of alcohol and cigarettes are the main causes of hypertension [4].Circulating blood exerts a force on the arterial walls of the body, or by major blood arteries, is called blood pressure [5]. Global statistics indicate that only 50% of individuals with hypertension are aware that they actually have high BP and only 14% are controlled (about 8% in low- and middle income countries).
When measured in two separate ways, hypertension is determined when the systolic blood pressure readings are 140 millimeters of mercury and/or the diastolic blood pressure readings are 90 millimeters of mercury [6]. It’s characterized as a persistent systolic blood pressure of 140 mm Hg or higher, and a diastolic blood pressure of 90 mm Hg or higher [7]. Hypertension is leads to cardiovascular condition affecting at least 20% of adult population in several countries. It is one of the important risk influences for cardiovascular mortality accounting for 20-30% of all adults. It is a iceberg disease [8]. In India, high blood pressure is a major public health issue, and its incidence is rapidly rising among both urban and rural populations [9]. Hypertension is, in fact, India’s most common chronic disease [10]. In urban people, hypertension affects 20-40% of them, but in rural adults, it affects 12-17% of them [11].The greater the blood pressure, is the risk and lower is the lifeexpectancy uncontrolled high blood pressure without any appropriate management could harma person [12]. Hypertension occurs in about 10-20% of the adults in developing countries like India and developing countries like Europe [13]. According to a study, men and women aged 45 to 75 years old have a 27-56 percent prevalence of hypertension [14]. A study done by investigators at the University of Michigan suggested that even marginally elevated BP can be dangerous because it often has no warning signs andsymptoms. Irrespective of age, race or gender, anyone can develop hypertension. It is assessed that one in every 4 American adults has high BP [15]. But only about half ofthose who have it known they have it. Once hypertension grows, it usually lasts a lifetime. We can prevent and control hyper tension by taking action [16].
2 Literature Review
Conducting a literature review is an important phase in the development of a research project. The investigator had wisely reread material in light of the study’s objectives. The current study aimed at determining the effectiveness of health education on Knowledge midstrural adult hypertensive patients at Padapai. Katherine T. Mills et al., (2020) detailed about the global epidemiology of hypertension.The study indicates that hypertension prevalence has decreased, particularly in low- and middle-income nations. According to estimates, 31.1 percent of adults in the world had hypertension in 2010. Adult hypertension was more common in poor and middle-income countries (31.5 %, 104 0000000 persons) than in high-income countries. Some of the regional variation in hypertension prevalence may be explained through abnormalities in the degrees of hypertension risk variable for hypertension, such as excessive sodium consumption, stumpy potassium consumption, obesity, alcohol consumption, physical inactivity, and a poor diet. Despite the rising prevalence of hypertension, levels of awareness, management, and blood pressure control were inadequate, particularly in LMICs, and there were few widespread studies of the economic impact of hypertension drip. Future research should focus on evaluating implementation strategies for hypertension prevention and control, particularly in low-income populations, as well as precisely assessing the prevalence and cost burden of hypertension.
Pugie Tawanda et al. (2019) studied hypertension knowledge, attitudes, and behaviours in a disadvan- 498 | Cardiometry | Issue 22. May 2022
taged rural community in southern Zimbabwe.To gather demographic and awareness data, therapy, and control data from consenting hypertension clients, a questionnaire that had been pre-tested and was administered by a real interviewer was used.. The study had 304 participants, with the majority of them being women (65.4 percent). The treatment default rate was 30.9 percent, and 25% of those using blood pressure medication had no idea about their blood pressure control target .64.8 % of defendants said Hypertension was primarily caused by stress, 85.9% said palpitations were an hypertension warning sign , and 59.8 % of those accused salt was added to their diet. In comparison to those without formal education, those with formal education were 3.68 times more likely to be familiar with hypertension and 7.52 times more likely to have a good understanding of higher education. Those who believed in herbal therapies outperformed those who did not believe in or use traditional medicines (50.7 percent )andthose who have previously relied on traditional medications (14.5%) accounted for 53% of the total and 68 percent less likely to be informed about hypertension, respectively. Members of the community were unfamiliar with hypertension. his was linked to a absence of evidence and resilient community belief in the use of herbal and traditional medicines, which influenced hypertension attitudes and practises. Poor understanding was linked to dietary risk factors. Clinic errors in hypertensive medication resulted in worsening hypertension treatment and in the community, there are poor hypertension results.
3 Materials and Methods
A pilot study of 35 hypertension patients was done in a rural location of Padapai in order to determine the study’s relevance and feasibility.
3.1. Aim of this Study
The goal of this study was to examine the level of hypertensive patient’s awareness about hypertension management.
3.2. The Study’s Objectives
• To assess the existing knowledge score regarding management of Hypertensionamong hypertensive patients.
• To assess the knowledge score after the influence of the health education.
• To assess association between the knowledge regarding management of Hypertension and selected demographic variables
3.3. Null Hypothesis
3.3.1. NH1 -There was no significant difference between before and after score on knowledge of Hypertension among adult hypertensive patients at p<0.05 level.
3.3.2. NH2-There was no significant association between level of score on knowledge of Hypertension among adult hypertensive patients and their selected demographic variables
3.4. Research Approach
3.5. Design of Research
3.6. Variables
3.6.1. Independent Variable3.6.2. Dependent Variable
3.7. Sample3.7.1. Criteria for Selecting Sample:
3.7.1.1. Inclusion Criteria:
According to the problem selected for the study and objective to be accomplished, in this study the effectiveness of information among hypertension patients is assessed by the researcher. Hence Quantitative evaluative research method was measured as an appropriate research method for this study
Pre - experimental Research- One group pre test post test design was adopted in this study.
The independent variables in this study refer to the intervention strategies, which include health education on management of hypertension treatment.
In the present study Knowledge was the dependent variables.
A sample is a unit of a target population ,which is to be worked upon by researchers during the study. The sample is the subset of the population chosen to take part in the research project.The samples of the present study were patients with pre hypertension and stage –I hypertension who is fulfilling the inclusion and exclusion criteria.
The samples for this study was selected on the following criteria
It includes the characters that each sample must possess
-
1. Hypertensive patients between 20 and above years residing in rural area
-
2. The patients who are previously diagnosed as hypertensive.
-
3.7.2. Exclusion Criteria
-
1. Secondary hypertension patients are excluded.
-
2. The hypertensive patients who are critically ill and mentally ill
-
3. Hypertensive patients with other chronic illness
-
4. Hypertensive patients who are not willing for the study
-
3.7.3. Research Tool and Technique
-
• Tool I- Demographic Data
-
• Tool II- Structure interviewed Schedule on Knowledge Regarding Management of Hypertension The demographic data of hypertension patients who took part in the study are shown in Table 1. The study based on “The aim of the study is to assess the Knowledge regarding Hypertension among hypertensive patient”.
Table 1
Demographic Variables
|
Demographic variables |
The number of hypertensive patients is on the rise |
% |
|
|
Age |
20-30 years |
6 |
17.14% |
|
31-40 years |
5 |
14.29% |
|
|
41-50 years |
11 |
31.42% |
|
|
51-60 years |
8 |
22.86% |
|
|
>60 years |
5 |
14.29% |
|
|
Sex |
Male |
21 |
60.00% |
|
Female |
14 |
40.00% |
|
|
Educational status |
Illiterate |
5 |
14.29% |
|
Primary education |
5 |
14.29% |
|
|
Secondary education |
6 |
17.14% |
|
|
Higher secondary education |
11 |
31.43% |
|
|
Degree and above |
8 |
22.86% |
|
|
Occupational status |
Government employee |
3 |
8.57% |
|
Private employee |
12 |
34.29% |
|
|
Self employed |
3 |
8.57% |
|
|
Daily wages |
3 |
8.57% |
|
|
Unemployed |
14 |
40.00% |
|
|
Demographic variables |
The number of hypertensive patients is on the rise |
% |
|
|
Marital status |
Married |
26 |
74.29% |
|
Single |
4 |
11.43% |
|
|
Divorced/ separated |
0 |
0.00% |
|
|
Widow/ widower |
5 |
14.29% |
|
|
Socio economic status |
Below Rs.5000 |
7 |
20.00% |
|
Rs.5000 – Rs10000 |
8 |
22.86% |
|
|
Rs.10000 – Rs15000 |
12 |
34.29% |
|
|
Above Rs.15000 |
8 |
22.86% |
|
|
Religion |
Hindu |
28 |
80.00% |
|
Christian |
5 |
14.29% |
|
|
Muslim |
2 |
5.71% |
|
|
Family Types |
Nuclear Family |
23 |
65.71% |
|
Joint Family |
10 |
28.57% |
|
|
Large Family |
2 |
5.71% |
|
|
Duration of Illness |
1-5 years |
10 |
28.57% |
|
6-10 years |
11 |
31.43% |
|
|
10-15 years |
7 |
20.00% |
|
|
> 15 years |
7 |
20.00% |
|
The percentage of pre-test knowledge level score among hypertension patients is shown in Table 2. In general, 74.29 percent of hypertensive patients have a inadequate level of knowledge, 25.71 percent have a moderate level of knowledge, and 0 percent have a high level of knowledge.
Table 3
Post test Level of Knowledge Score
|
Level of knowledge score |
No. of Patients |
% |
|
Inadequate |
0 |
0.00% |
|
Moderate |
12 |
34.28% |
|
Adequate |
23 |
65.72% |
|
Total |
35 |
100.00% |
Table 4
Level of Knowledge Score on Comparison of Pre test and Post test
|
Level of score |
Pretest |
Posttest |
McNemar’s test was extended. |
||
|
n |
% |
n |
% |
||
|
Inadequate |
26 |
74.29% |
0 |
0.00% |
χ2=29.73 P=0.001***(S) |
|
Moderate |
9 |
25.71% |
12 |
34.28% |
|
|
Adequate |
0 |
0.00% |
23 |
65.72% |
|
|
Total |
35 |
100.00% |
35 |
100.00% |
|
***P0.001 indicates a very high level of significance
The total comparison knowledge scores before and after the administration of health education is shown in Table 5.
Table 5
Pre test and Post test Mean Knowledge Score Comparison
|
No. of Patients |
Pre test |
Post test |
Mean Difference |
A paired t-test was used by the student. |
||
|
Mean |
SD |
Mean |
SD |
|||
|
35 |
6.14 |
1.82 |
11.00 |
1.69 |
4.86 |
t=10.85 P=0.001 *** DF= 34 , Significant |
The above Figure 1 shoes Comparison between the pre-test and post-test level of knowledge score using a simple bar plot with two standard error bars.
Table 2
Score for the Pre test Level of Knowledge
|
Level of expertise Score Percentage of patients |
No. of patients |
% |
|
Inadequate |
26 |
74.29% |
|
Moderate |
9 |
25.71% |
|
Adequate |
0 |
0.00% |
The percentage level of post-test knowledge score among hypertension patients is shown in Table 3. In general, none of the patients had an inadequate level of knowledge, with 34.28 percent having a moderate level of knowledge and 65.72 percent having an adequate level of knowledge.
The comparison of pre test and post-test level of knowledge score among hypertension patients is shown in Table 4.
500 | Cardiometry | Issue 22. May 2022
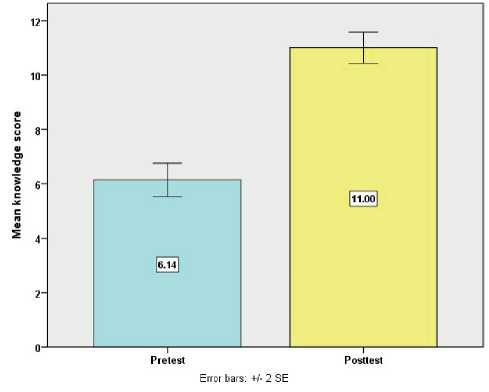
Figure 1. Compares the Pre-Test and Post-Test Level of Knowledge Score using a Simple Bar Plot with two Standard Error Bars
The relationship between post-test level of knowledge score and demographic characteristics of hypertension patients is shown in Table 6. Patients with a higher level of education and duration of illness had a higher knowledge score than those with a lower level of education and a shorter duration of illness.
Figure 2 depicts the relationship between hypertension patients’ demographic factors and their post-
Table 6
Demographic Variables and Post test Level of Knowledge Score and its Association
|
Demographic variables |
Post test level of knowledge |
n |
Chi square test/yates corrected chi square test |
||||
|
Moderate |
Adequate |
||||||
|
n |
% |
n |
% |
||||
|
Age |
20-50 years |
8 |
36.36% |
14 |
63.64% |
22 |
χ2=0.11 P=0.74(NS) |
|
>50 years |
4 |
30.77% |
9 |
69.23% |
13 |
||
|
Sex |
Male |
8 |
38.10% |
13 |
61.90% |
21 |
χ2=0.34 P=0.56(NS) |
|
Female |
4 |
28.57% |
10 |
71.43% |
14 |
||
|
Educational status |
< Primary |
6 |
60.00% |
4 |
40.00% |
10 |
X 2=4.11 P=0.05*(S) |
|
>Primary |
6 |
24.00% |
19 |
76.00% |
25 |
||
|
Occupational status |
Employed |
7 |
33.33% |
14 |
66.67% |
21 |
χ2=0.02 P=0.88(NS) |
|
Unemployed/housewife |
5 |
35.71% |
9 |
64.29% |
14 |
||
|
Marital status |
Married |
9 |
34.62% |
17 |
65.38% |
26 |
χ2=0.01 P=0.94(NS) |
|
Widow/widower/single |
3 |
33.33% |
6 |
66.67% |
9 |
||
|
Socio economic status |
Below Rs.10000 |
7 |
42.86% |
8 |
57.14% |
15 |
χ2=1.79 P=0.18(NS) |
|
Above Rs.10000 |
5 |
50.00% |
15 |
50.00% |
20 |
||
|
Religion |
Hindu |
9 |
32.14% |
19 |
67.86% |
28 |
χ2=1.57 P=0.45(NS) |
|
Christian/muslim |
3 |
42.87% |
4 |
57.13% |
7 |
||
|
Type of family |
Nuclear Family |
9 |
39.13% |
14 |
60.87% |
23 |
χ2=0.69 P=0.40(NS) |
|
Joint /extended Family |
3 |
20.00% |
9 |
80.00% |
12 |
||
|
Duration of illness |
1-10 years |
10 |
47.62% |
11 |
52.38% |
21 |
x 2=4.14P=0.05*(S) |
|
>10 years |
2 |
14.29% |
12 |
85.71% |
14 |
||
ASSOCIATION BETWEEN POSTTEST LEVEL OF KNOWLEDGE SCORE AND EDUCATION OF PATIENTS
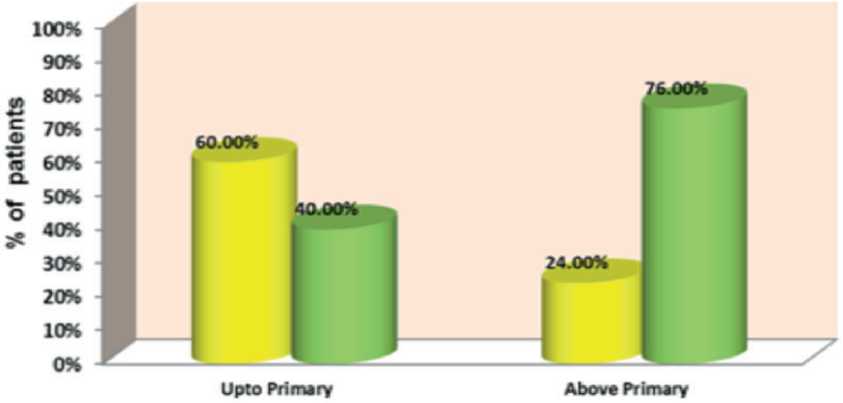
Figure 2. Association between Post test Level of Knowledge Score and Education of Patients
Moderate
Adequate
test level of knowledge score. That primary has sufficient expertise in that are
4 Discussion 4.1. Based on Age distribution: 17.14%were 20-30yrs of age group, 14.29% of theHypertensive patients were 31-40 yrs of age group, 31.42 % of the Hypertensivepatients were in the age group of 41-50 yrs and 22.86% of the Hypertensive patients are in the age group of 51-60 yrs and 14.29% of the Hypertensive patients are above 60 years. 4.2. Based on Gender: 60.00% of the Hypertensive patients were male, 40.00% of theHypertensivepa-tients werefemales. 4.3. Based on Educational status: 14.29 % were illiterate, 14.29% having primary education, 17.14% having secondary education, and 31.43% are having higher secondary education, and 22.86% were having the education of degree. 4.4. Based on Occupation: 8.57% were working as a govt. employee, 34.29% were working as a private employee, 8.57% were self employed, 8.57% working for daily wages and 40.00% were unemployed. 4.5. Based on the Marital Status: 74.29% were mar-ried,11.43% were single, 0% were divorced and 14.29% were either widow or widower 4.6. Based on Monthly income of the Family: 20.00% were having income less than Rs.5000, 22.86% were having income in between Rs.5001-10000, 34.29% were having income between Rs. 10001-15000, 22.86 % were having income more than Rs.15000 4.7. Based on religion: 80% were belongs to Hindu, 14.29% were belong to Christian, 5.71% were belongs to Muslim religion 4.8. Based on Type of Family: 65.71% of the Hypertensive patients were from nuclear family. 28.57% of the Hypertensive patients were from joint family,5.71% were from extended family 4.9. Based on Duration of illness: 28.57% of them were suffering from Hypertension since less than 5 years, 28.57% of them were suffering from Hypertension since 6-10 years, 31.43% of them were suffering from Hypertension since 10-15 years, and 20.00% of them were suffering from Hypertension since more than 15years.
Regarding the relationship between post-test knowledge levels and demographic variables of patients the educational status of hypertension patient are having significant association with knowledge score at 5%level ( χ2=4.11P=0.05*(S) ) and the dura- 502 | Cardiometry | Issue 22. May 2022
tion of illness among hypertension patient is having significant association with knowledge score at 5%lev-el ( χ2=4.14P=0.05*(S) )
5 Conclusion
Hypertension is defined as persistently elevated blood pressure for longer than six month. This happens when the blood pressure induced by the heart’s pumping rises significantly above normal levels. People with high blood pressure frequently do not feel sick. In fact it iscalledas“SilentKiller”andit is also the leading cause of death in the world today.Hyper-tension is a serious public health problem that raises the risk of stroke and heart disease. Beforethe health education , 74.29 percent of hypertension patients had an inadequate level of knowledge, 25.71 percent had a moderate level of knowledge, and none had an adequate level of knowledge. Following the health education, the post-test revealed that none of the patients had an inadequate level of knowledge, 34.28 percent had a moderate level of knowledge, and 65.72 percent had an appropriate level of knowledge.
On an average, in post test after having health education, hypertensive patientswere gained 32.40% knowledge score than pre test score. This pilot study concludes by proving the effectiveness of health education on Knowledge of hypertension among rural adult hypertensive patients.
Statement on ethical issues
Research involving people and/or animals is in full compliance with current national and international ethical standards.
Conflict of interest
None declared.
Author contributions
The authors read the ICMJE criteria for authorship and approved the final manuscript.
References Effectiveness of health education on knowledge of hypertension among hypertensive patient - a pilot analysis
- Kerley CP. A Review of Plant-based Diets to Prevent and Treat Heart Failure. Card Fail Rev. 2018 May; Vol. 4, Issue, 1 pp 54-61.
- Ozemek C, Laddu DR, Arena R, Lavie CJ. The role of diet for prevention and management of hypertension. Curr. Opin. Cardiol. 2018 Jul; Vol.33, , Issue 4,pp. 388-393.
- Dos Reis Padilha G, Sanches Machado d’Almeida K, RonchiSpillere S, Corrêa Souza G. Dietary Patterns in Secondary Prevention of Heart Failure: A Systematic Review. Nutrients. 2018 Jun 26;Vol. 10, Issue 7.
- Eckel RH, Jakicic JM, Ard JD, et al. 2013 AHA/ ACC guideline on lifestyle management to reduce cardiovascular risk: a report of the American College of Cardiology/American Heart Association Task Force on Practice Guidelines. J Am CollCardiol. 2014;63(25 Pt B):2960-2984. PMID: 24239922
- Heimburger DC. Nutrition’s interface with health and disease. In: Goldman L, Schafer AI, eds. Goldman- Cecil Medicine. 25th ed. Philadelphia, PA: Elsevier Saunders; 2016:chap 213.
- Mozaffarian D. Nutrition and cardiovascular and metabolic diseases. In: Zipes DP, Libby P,Bonow RO, Mann DL, Tomaselli GF, Braunwald E, eds. Braunwald’s Heart Disease: A Textbook of Cardiovascular Medicine. 11th ed. Philadelphia, PA: Elsevier; 2019:chap 49.
- BlackM.J.“Medical–Surgical Nursing Clinical Management for Positive Outcomes“, Saunders Publishers, 2001,6thedition,Vol.2, pp.1379–1386
- InabHajjar.“Hypertension, Trends in prevalence, incidence and control”, Annual review of public health,2006, Vol.27, pp.468-490
- Reddi S.S. et.al, “Prevalence and risk factors of hypertension in adults in an urban slum,Tirupati, A.P“, Indian journal of community medicine,2005,July- Sept.,Vol.30, pp.84-89.
- Sukanta Mandal et.al, “Prevalence of Ischemic Heart Disease among Urban Population of Siliguri “ Indian journal of community medicine, 2009, January, Vol. 34, pp.19-31.
- Mohanan et.al, “Risk factors of coronary heart disease in a selected community “Indian journal of community medicine,2005,Oct.-Dec.,Volume30, pp.132-133.
- Park.K.“ Preventive and Social Medicine “ – Jabalpur, Banarsidas bhanot Publishers ,2007,19th edition,pp.311
- Prakash et.al, “Epidemiological study of hypertension”, Indian J Medicine, 1997, Vol. 10,P.P.No.679-681.
- Guang-HuiDong, Zhao-QingSun, Xin-Zhong,et. al.”Prevalence, awareness, treatment& control of hypertension in rural Liaoning province China.”,Indian J Med Res,2008, Aug,Vol.138, pp.122-127.
- Patrica M Kearney. “Global burden of hypertension analysis”, Journal of hypertension, 2002,pp. 450-468.
- ValoryPavlik. “Circulation, Cardiovascular quality, outcomes”, American journal ofhypertension,2002, Vol.34, pp.220-230.
