Effectiveness of health education on knowledge on diabetic care among rural adult diabetic patients - a pilot analysis

Author: Hemavathy V., Jegatha C.
Journal: Cardiometry @cardiometry
Section: Original research
Article in issue: 22, 2022.
Free access
Diabetic populations are anticipated to increase from 171 million to 366 million in 2030, with the greatest rates in India, China, and the United States. Diabetes is a metabolic disorder that generates high glucose levels in the blood. The World Health Organization (WHO) estimates that India has over 70 million diabetics and is on its way to become the world’s diabetes capital. Patients had a 7.20 knowledge score on the pretest and an 11.78 knowledge score on the posttest, resulting in a mean difference of 4.58 knowledge score, this is a considerable and statistically significant increase in knowledge. The relationship between the patient’s demographic characteristics and their post-test knowledge score..Patients with a high education level and longer disease duration got a higher knowledge score than those with a lower level of education and a shorter duration of illness. The chi square test and Yates corrected chi square test were used to corroborate it.
Diabetic, rural, patient, knowledge, insulin
Short address: https://sciup.org/148324640
IDR: 148324640 | DOI: 10.18137/cardiometry.2022.22.527533
Text of the scientific article Effectiveness of health education on knowledge on diabetic care among rural adult diabetic patients - a pilot analysis
Diabetes can have a wide range of severity. Individuals with the disease get it under control in around half of the cases, and in the other half, it leads to various health concerns over period [1]. Diabetes’ typical clinical characteristics, micro and macrovascular consequences, and increased risk of cardiovascular disease are caused by insulin’s ineffective action on target tissues and hyperglycemia, which cause anomalies in carbohydrate, lipid, and protein metabolism [2]. Blood sugar levels, on the other hand, begin to rise when it can no longer keep up [3]. A lack of insulin action on target tissues and hyperglycemia cause abnormalities in carbohydrate, lipid, and protein metabolism, resulting in diabetes’ typical clinical features, micro and macrovascular disorders, and an increased risk of cardiovascular disease [4]. The 10-year prospective DCCT (Diabetes Control and Problems Trial) trial provided the solution, demonstrating that ‘intensive’ hyperglycemia-lowering treatment will unambiguously stop the onset and/or decrease the progression of micro vascular problems [5]. The total number of diabetics is expected to rise from 171 million to 366 million in 2030, with India, China, and the United States accounting for the top three diabetic countries [6]. Multiple lines of evidence back up the idea that genetic factors play a significant role in T2D pathogenesis [7]. Diabetes is a chronic disease characterized by a lack of insulin production in the pancreas, which can be hereditary or acquired [8]. Diabetes thought to constitute a diverse set of diseases [9]. Diabetes is becoming more common in emerging countries as a result of increased industrialization and socioeconomic development. Diabetes is a broad term for a variety of diseases [10]. Despite the assumption that diabetes is “a disease of the well-to-do,” the trend will continue in low- and middle-income countries” [13]. In the twenty-first century, emerging countries are expected to carry 77 percent of the global burden of the DM epidemic [14]. As a result of population growth, consumption of unhealthy diets, obesity, and sedentary lifestyles [15].
Literature review
Lise Juul, Gill Rowlands, Helle Terkildsen Maindal (2015) In peer-led support groups for persons with type 2 diabetes, the relationships between health literacy, motivation, food, and physical activity were studied. The researchers intended to see if there were any associations among health literacy (HL), diet and exercise, as well as stimulus and diet and exercise, among Danish people with diabetes. Between January and December 2015 used quantitative approach to study people with diabetes by the Danish Diabetes Association. At the first meeting, the participants filled out a questionnaire that included the Summary of Diabetes Self-Care Activities (SDSCA) measure, the Treatment Self-Regulation Questionnaire (TSRQ) (Self-Determination Theory) measuring motivation type, and two HL scales: the HLS-EU-Q16 and the Diabetes Health Literacy scale (Ishikawa, H). When analyzing the data, age, sex, educational level, duration of illness, inspiration, and HL were all taken into account. The adjusted (95 percent confidence interval) results showed that following the prescribed diet was linked to autonomous motivation, with functional HL autonomous motivation being 0.43. (0.06; 0.80) and functional HL was 0.52 (0.06; 0.80). (0.02; 1.00). Following physical activity guidelines was linked to autonomous motivation; (95 percent CI) 0.56. (0.16; 0.96). According to this study, functional HL and autonomous motivation may be primary drives for type 2 diabetes patients to follow eating prescription, and independent stimulus could be the essential part for diabetes patients to follow physical activity guidelines.As a result, these principles may be extremely important to address in type 2 diabetes therapies. Various interventions were proposed. [12]
Mohsina Hyder, Vishak varma et al (2021) The effect of prediabetes teaching programme on knowledge, attitude, and practise among South Indian prediabetics was investigated. After assessing their knowledge, attitude, and practise with a constructed survey, this project is an attempt to undertake an education programme among prediabetic patients. Diabetes screening camps held in Kerala and Tamil Nādu, total of 308 prediabetic volunteers were recruited. The KAP-PAQ Questionnaire, which was recently designed and val-idated..The impact of the diabetes teaching Program evaluated with administering a questionnaire before and after the PEP at a 30-day interval. Based on a baseline examination of knowledge among prediabetics, 90% had poor knowledge, but following the PEP treatment, 43% had standard knowledge and 44% had strong knowledge. At the outset, 30%of people had a negative attitude, but after counselling, 68 percent had a positive attitude. Prior to PEP, 35% had very least practice and 52% had least practice; however, following PEP.71 percent had better practice and 15% had better practice. The baseline KAP survey reveals the need for health literacy among newly diagnosed prediabetics. KAP-PAQ has been found to be a useful tool for conducting surveys among newly diagnosed prediabetics in south India, and it has the potential to enhance knowledge, attitude, and behaviour signifi-cantly.[11]
MATERIALS AND METHOD
Pilot research was done among 40 diabetic patients in the same manner as the original study in a selected rural community to test the study’s relevance and feasibility. The data was analyzed to see if the statistics were appropriate.
AIM OF THE STUDY
To determine knowledge on diabetic care among diabetic patient.
THE STUDY’S OBJECTIVES
ARE AS FOLLOWS
-
1. assess the existing knowledge score on diabetic care among diabetic patients.
-
2. assess knowledge score after the influence of the health education regarding diabetic care
-
3. To assess association between the knowledge and selected demographic variables
RESEARCH DESIGN
One group Pretest Posttest design was adopted in this study.
VARIABLES
Independent Variable
The intervention strategies, which include health education on diabetic care, are the independent variables in this study.
Dependent Variable
In this study Knowledge was the dependent variables.
SAMPLE
A sample is composed of some fraction or part of the total number of elements or units in a defined population sampling. Therefore, is a method of selecting some fraction of a population Sample consists of the subset of the population selected to participate in the research study. The samples of the present study were patients with type2 diabetic who is fulfilling the inclusion and exclusion criteria
INSERTION CRITERIA:
-
1. Adults between the age of >20 years residing in rural area
-
2. Adults who have previously diagnosed as diabetes mellitus
EXCLUSION CRITERIA
-
1. Women who are pregnant and have gestational diabetes.
-
2. Those who refuse to participate
-
3. Diabetic patients who are critically unwell and suffer from mental illness
-
4. Diabetic individuals who also suffer from other chronic illnesses
-
5. Diabetic patients with significant cognitive impairment
RESEARCH TOOL AND TECHNIQUE
-
1. Tool I- Demographic Data
-
2. Tool II- Structured Interview Schedule for Diabetic Care Knowledge
Table 1 provides the demographic details of diabetic patients who have agreed to participate in the study
Table 1
DEMOGRAPHIC VARIABLES
|
Demographic variables |
Number of Diabetic patients |
% |
|
|
Age |
21-30 yrs |
3 |
7.50% |
|
31 -40 yrs |
10 |
25% |
|
|
41 -50 yrs |
14 |
35% |
|
|
>50 yrs |
13 |
32.50% |
|
|
Sex |
Male |
22 |
55% |
|
Female |
18 |
45.00% |
|
|
Education |
Illiterate |
6 |
15% |
|
Primary school education |
7 |
17.50% |
|
|
Middle school education |
9 |
22.50% |
|
|
High &Higher secondary education |
10 |
25% |
|
|
Graduate |
8 |
20% |
|
|
Occupation |
Government employee |
2 |
5% |
|
Private employee |
7 |
17.50% |
|
|
Self employed |
7 |
17.50% |
|
|
Daily wages |
10 |
25% |
|
|
Unemployed/housewife |
14 |
35% |
|
|
Marital status |
Married |
35 |
87.50% |
|
Single |
2 |
5.00% |
|
|
Divorced/separated |
1 |
2.50% |
|
|
Widow/widower |
2 |
5% |
|
|
Socio Economic Status |
high class |
6 |
15% |
|
High middle class |
8 |
20% |
|
|
Middle class |
12 |
30% |
|
|
Lower Middle class |
10 |
25% |
|
|
Lower class |
4 |
10% |
|
|
Religion |
Hindu |
29 |
72.50% |
|
Christian |
8 |
20% |
|
|
Muslim |
3 |
7.50% |
|
|
Family type |
small family |
28 |
70% |
|
combined family |
10 |
25% |
|
|
Large extended family |
2 |
5% |
|
|
Demographic variables |
Number of Diabetic patients |
% |
|
|
Duration of illness |
1 year- 5 years |
4 |
10% |
|
6 years – 10 years |
12 |
30% |
|
|
10 years -15 years |
15 |
37.50% |
|
|
More than 15 years |
9 |
22.50% |
|
“To determine diabetic patient knowledge about diabetes management.”
The percentage level of pre-test knowledge score among patients is shown in Table 2. In general, 72.50 percent of patients have a low degree of knowledge, 27.50 percent have a modest level of knowledge, and no one had a high knowledge.
Table 2
SCORE FOR THE PRETEST LEVEL OF KNOWLEDGE
|
Rating |
patients |
% |
|
insufficient |
29 |
72.50% |
|
modest |
11 |
27.50% |
|
sufficient |
0 |
0% |
|
Total |
40 |
100% |
Interpretation
The minimum and maximum values are 0 and 1, respectively. There are 15 questions in all. Maximum score: 15
Table 4
PRETEST AND POSTTEST KNOWLEDGE COMPARISON
|
Level of score |
Pretest |
Posttest |
Extended McNemar’s test |
||
|
N |
% |
n |
% |
||
|
insufficient |
29 |
72.50% |
0 |
0 |
χ2=30.14) |
|
modest |
11 |
27.50% |
14 |
35 |
|
|
sufficient |
0 |
0.00% |
26 |
65 |
|
|
Total |
40 |
100.00% |
40 |
100 |
|
Patients had a 7.20 knowledge score on the pretest and an 11.78 knowledge score on the posttest, resulting in a mean difference of 4.58 knowledge score, which is big and statistically significant knowledge gain score. Patients raised their knowledge score from 7.20 to 11.78 on average after receiving health education. Or, to put it another way, before intervention, they could only answer 7 out of 15 questions correctly; after intervention, they can answer 12 out of 15 questions correctly, implying that intervention improved their ability to answer 5 questions properly.
The percentage level of post-test knowledge score among patients is shown in Table 3. In general, no one had an insufficient knowledge, with 35% had a modest knowledge and 65.00 percent had an appropriate knowledge.
Table 3 i POSTTEST LEVEL OF KNOWLEDGE SCORE
|
Score |
Patients |
% |
|
Inadequate |
0 |
0 |
|
Moderate |
14 |
35 |
|
Adequate |
26 |
65 |
|
Total |
40 |
100 |
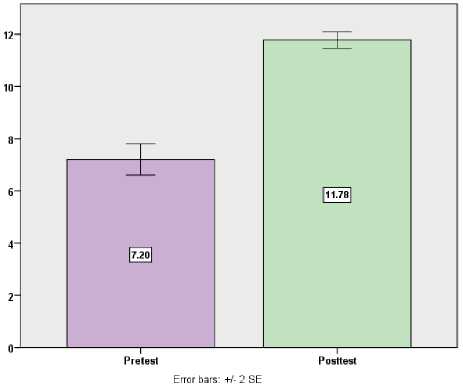
Fig. 1: A simple bar diagram with two standard error bars contrasts the knowledge score on the pretest and posttest.
Prior to receiving health education, 72.50 percent of patients had an insufficient level of knowledge, 27.50 percent had a modest knowledge, and no one of them had an acceptable knowledge. After receiving health education, no one had an inadequate knowl- 530 | Cardiometry | Issue 22. May 2022
The influence of health education on knowledge is shown in Table 6.
Table 5
COMPARISON OF PRETEST AND POSTTEST MEAN
KNOWLEDGE SCORE
|
Patients |
Pretest |
Posttest |
Mean Difference |
Student’s paired t-test |
||
|
Mean |
SD |
Mean |
SD |
|||
|
40 |
7.20 |
1.90 |
11.78 |
1.00 |
4.58 |
t=12.62 DF= 39 , Significant |
Patients gained 30.47 percent more knowledge in the posttest after receiving health education than in the pretest. The differences and generalisation of knowledge score gain score between the pretest and posttest were determined using the mean difference with 95 percent confidence intervals and the proportion with 95 percent confidence intervals.
7th Table The relationship between post-test knowledge level and score and patient demographic characteristics is shown in the table above. Patients with a senior level of education and a longer length of disease had a higher knowledge score than those with a lower level of education and a shorter duration of illness. The chi square test and Yates corrected chi square test were used to corroborate it.
Figure 3 depicts the link between post-test level of knowledge and patient demographic factors. Patients who are more educated have a higher knowledge score than those who are less educated. The chi square test and Yates corrected chi square test were used to corroborate it.
Table 6
GENERALIZATION OF KNOWLEDGE GAIN SCORE AND EFFECTIVENESS OF HEALTH EDUCATION
|
Max score |
Mean score |
% of Knowledge |
Mean Difference of Knowledge gain score with 95% Confidence interval |
Percentage of Knowledge gain with 95% Confidence interval |
|
|
Pretest |
15 |
7.20 |
48.00% |
4.57(3.84 – 5.31) |
30.47%(25.60% – 35.40%) |
|
Posttest |
15 |
11.78 |
78.53% |
Table 7
DEMOGRAPHIC VARIABLES AND POSTTEST LEVEL OF KNOWLEDGE SCORE ASSOCIATION
|
Demographic variables |
Posttest level of knowledge |
n |
yates corrected chi square test |
||||
|
modest |
sufficient |
||||||
|
n |
% |
n |
% |
||||
|
Age |
20-50 years |
12 |
36.36% |
15 |
63.64% |
27 |
χ2=3.25 P=0.07(NS) |
|
>50 years |
2 |
14.29% |
11 |
42.31% |
13 |
||
|
Sex |
Male |
8 |
38.10% |
13 |
61.90% |
21 |
χ2=0.33 P=0.56(NS) |
|
Female |
4 |
28.57% |
10 |
71.43% |
14 |
||
|
Educational status |
|
8 |
61.53% |
5 |
38.47% |
13 |
χ2=5.99 P=0.01**(S) |
|
>Primary |
6 |
22.22% |
21 |
77.78% |
27 |
||
|
Occupational status |
Employed |
8 |
30.77% |
18 |
69.23% |
26 |
χ2=0.58 P=0.44(NS) |
|
Unemployed/house-wife |
6 |
42.86% |
8 |
30.77% |
14 |
||
|
Marital status |
Married |
13 |
37.14% |
22 |
66.86% |
35 |
χ2=0.56 P=0.45(NS) |
|
Widow/widower/single |
1 |
20.00% |
4 |
80.00% |
5 |
||
|
Socio economic status |
Upper & Upper middle |
4 |
42.86% |
10 |
57.14% |
14 |
χ2=0.39 P=0.53NS) |
|
Middle & lower |
10 |
50.00% |
16 |
50.00% |
26 |
||
|
Religion |
Hindu |
9 |
31.03% |
20 |
68.97% |
29 |
χ2=0.72 P=0.39 |
|
Christian/Muslim |
5 |
45.45% |
6 |
54.55% |
11 |
||
|
Type of family |
Nuclear family |
11 |
39.29% |
17 |
60.71% |
28 |
χ2=0.10 P=0.75(NS) |
|
Joint /extended family |
3 |
35.00% |
9 |
75.00% |
12 |
||
|
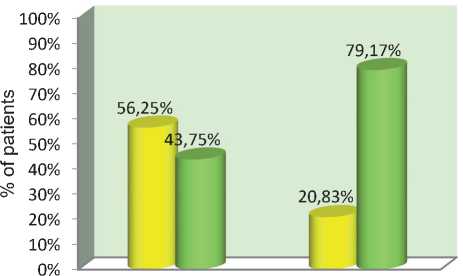
Duration of illness |
1-10 years |
9 |
56.25% |
7 |
43.75% |
16 |
χ2=5.29 P=0.05*(S) |
|
>10 years |
5 |
20.83% |
19 |
79.17% |
24 |
||
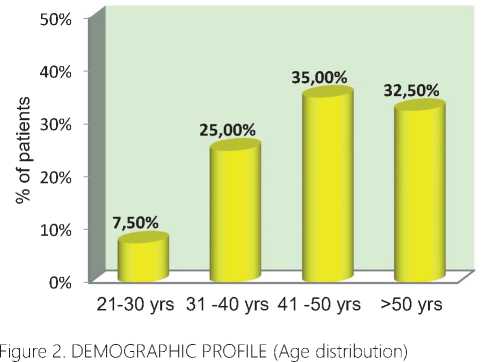
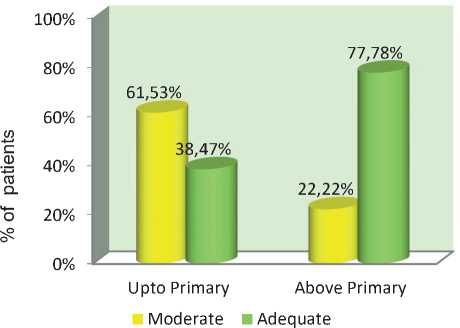
Figure 3: ASSOCIATION BETWEEN THE PATIENTS’ EDUCATION
AND THEIR POSTTEST KNOWLEDGE
1-10 years >10 years
Moderate Adequate
Figure 4: RELATIONSHIP BETWEEN THE POSTTEST KNOWL
EDGE AND THE DURATION OF PATIENT ILLNESS
Figure 4 depicts the link between post-test level of knowledge and patient demographic factors. Patients who have been sick for more than ten years have a higher knowledge score than others. major findings: • At the time of the pretest, 72.50 percent of the patients had an inadequate level of knowledge, 27.50 percent had a modest knowledge, and no one had an appropriate knowledge.
-
• At the posttest, no one of the patients had an insufficient knowledge, with 35 percent had a modest knowledge and 65 percent had an appropriate level of knowledge.
-
• Patients had a 7.20 knowledge score on the pretest and an 11.78 knowledge score on the posttest, resulting in a mean difference of 4.58 knowledge score, which is big and statistically significant knowledge gain score.
-
• The relationship between the patient’s demographic factors and their post-test level of knowledge score. Patients with a senior education and a longer length of disease had a higher knowledge score than those with a lower level of education and a shorter duration of illness. The chi square test and Yates corrected chi square test were used to corroborate it.
Conclusion
Diabetes is a metabolic disorder that generates high glucose levels in the blood. Diabetes is becoming more common in emerging countries as a result of increased industrialization and socioeconomic development. Diabetes is a broad term for a variety of diseases. This pilot study finishes by demonstrating the usefulness of health education in improving diabetes patient understanding. Patients had a 7.20 knowledge score on the pretest and an 11.78 knowledge score on the posttest, resulting in a mean difference of 4.58 knowledge score, which is big and statistically significant knowledge gain score. Statistical significance was evaluated using the student’s paired’t’test.The relationship between the patient’s demographic factors and their post-test level of knowledge score. Patients with a higher level of education and a longer length of disease had a higher knowledge score than those with a lower level of education and a shorter duration of illness. The chi square test and Yates corrected chi square test were used to corroborate it.
Statement on ethical issues
Research involving people and/or animals is in full compliance with current national and international ethical standards.
Conflict of interest
None declared.
Author contributions
The authors read the ICMJE criteria for authorship and approved the final manuscript.
References Effectiveness of health education on knowledge on diabetic care among rural adult diabetic patients - a pilot analysis
- Bundesärztekammer (BÄK), Kassenärztliche Bundesvereinigung (KBV), Arbeitsgemeinschaft der Wissenschaftlichen Medizinischen Fachgesellschaften (AWMF). National Versorgungsleitlinie: Therapie des Typ-2-Diabetes (S3). AWMF-Registernr.: nvl-001g. December 2014.
- Malecki MT, Klupa T. Type 2 diabetes mellitus: from genes to disease. Pharmacological Reports 2005; 57: 20-32
- Klein BE, Klein R, Moss SE, Cruickshanks KJ, Parental history of diabetes in a population-based study. Diabetes care. 1996 Aug [PubMed PMID: 8842599].
- Malecki MT, Klupa T. Type 2 diabetes mellitus: from genes to disease. Pharmacological Reports 2005; 57: 20-32.
- The DCCT Research Group. The effects of intensive treatment of diabetes in the development and progression of long-term complications in insulin-dependent diabetes mellitus. N Eng J Med 1993; 329: 977–86.
- Wild S, Roglic G, Green A, Sicree R, King H. Global prevalence of diabetes: estimates for the year 2000 and projections for 2030. Diabetes Care 2004; 27: 1047–53.
- Golwalla, Bernardini, et.al. (2004). Medicine for students. (16th edition). India Printinghouse.
- Veerabhadrappa “The short text book of community health nursing”, firstedition,Jaypee brothers medical publisher, page no 304.
- Park.K.“ Preventive and Social Medicine “ – Jabalpur, Banarsidas bhanot Publishers ,2007,19th edition, P.P.No.362.
- Simrat kaur N J SINGH “Community Health Nursing” first edition, lotus publication, page no 543.
- K Mohsina Hyder, et al Impact of prediabetes education program on Knowledge, attitude and practice among prediabetic population of south India.2021 May 10;23:101395.: 10.1016/j.pmedr.2021.101395.eCollection 2021 Sep.
- Lise Juul, Gill Rowlands, Helle Terkildsen Maindal (2015) Relationships between health literacy, motivation and diet and physical activity in people with type 2 diabetes participating in peer-led support groups. / Juul, Lise; Rowlands, Gill; Maindal, Helle Terkildsen.I: Primary Care Diabetes, Bind 12, Nr. 4, 08.2018, s. 331-337.
- Black,J.MandJacobs,E.M.(1997).Medicalsurgicalnursing.(5thedition).Philadelphia; WB. Saunders Company.
- Burns N, Grove SK. (1999).Understandingnursingresearch.(2ndedition).Philadelphia; WB. Saunders Company.
- F. Aguiree, et al., IDF Diabetes Atlas, International Diabetes Federation, Basel, Switzerland, 2013.
