Effects of E-commerce on Export Trade: Spatial Panel Data Models for Regions of China

Author: Efimova E.G., Shi Yu., Skripnuk D.F.
Journal: Economic and Social Changes: Facts, Trends, Forecast @volnc-esc-en
Section: Global experience
Article in issue: 2 т.18, 2025.
Free access
The primary goals of the paper are to examine the impact of e-commerce on export trade and to determine whether the level of e-commerce development has spatial spillover, siphoning, and threshold effects on export trade. The goals predetermined the choice of research methodology. This paper constructs the spatial lag model and threshold model based on the panel data of 31 China’s regions (provinces and other districts) from 2009 to 2022. The empirical results show a strong spatial autocorrelation and a robust spatial lag effect on the export trade in China. The improvement of the regional e-commerce level can directly promote the development of local export trade and has a significant positive spatial spillover effect, i.e., the improvement of the local e-commerce level can lead to the development of export trade in neighboring regions; there is no siphoning effect between provinces. According to the result of the threshold effect, there is a single-threshold effect of e-commerce on the impact of export trade, and the positive effect of different levels of e-commerce development on export trade is on an upward trend. The value of the research is a specific application of spatial regression modeling in empirical studies, and the findings provide insights for promoting the synergistic development of e-commerce and export trade
Export trade, e-commerce, spatial regression model, spatial spillover effect, threshold effect, siphon effect
Short address: https://sciup.org/147251358
IDR: 147251358 | UDC: 339.564.2 | DOI: 10.15838/esc.2025.2.98.12
Text of the scientific article Effects of E-commerce on Export Trade: Spatial Panel Data Models for Regions of China
E-commerce is essential in promoting consumption, guaranteeing employment, facilitating foreign trade, and developing the digital economy. As a new trade model, e-commerce breaks through the geographical limitations of the traditional market and connects into a unified market on a global scale with the information network as a link; establishing an e-commerce platform reduces transaction costs and broadens sales channels. The iterative innovation of the e-commerce model and the in-depth integration with the real economy have reconstructed the industrial chain and value chain, promoting the transformation and upgrading of traditional industries.
According to the China E-Commerce Report (2022), China’s e-commerce development has been remarkable. The e-commerce transaction volume reached RMB 43.83 trillion in 2022, a growth of 3.5% year-on-year after 19.6% growth in 2021. Cross-border e-commerce imports and exports have been climbing yearly, with transactions reaching RMB 15.7 trillion in 2022 and imports and exports exceeding 2 trillion Yuan for the first time. The development of e-commerce has dramatically optimized the structure of China’s foreign trade and promoted the international competitiveness of foreign trade enterprises.
As the economic and trade links between regions become closer and closer, and the new economic geography theory continues to be improved, it has become an important topic to research the dynamic spatial evolution of trade, people, and capital flows by taking them fully into account in the spatial correlation. The tasks of the paper are to examine the impact of e-commerce on export trade and to determine whether the level of e-commerce development has spatial spillover, siphoning, and threshold effects on export trade.
Based on the background of developing e-commerce and facilitating foreign trade, combined with the theory of new economic geography, we put forward the following thoughts and questions: How does e-commerce promote the rapid development of regional export growth? Does the level of e-commerce development in one region affect the export trade of neighboring areas? Is there a spatial spillover effect of the development of e-commerce on export trade? Is it positive or negative? Do different levels of e-commerce development have different impacts on export trade? As the development of e-commerce is an essential step in the transformation of the digital economy in China and the expansion of its opening up to the outside world, clarifying its impact on export trade will help regions in the future to promote consumption, stabilize foreign trade, develop digital economy and stimulate economic activity.
Literature review
The impact of e-commerce on export trade
With the advancement of globalization and the rapid development of information technology, e-commerce has gradually become an integral part of international trade. Mainly during COVID-19, e-commerce played a key role. Researchers generally agree that the rise of e-commerce provides new opportunities for business development. The study (Onjewu et al., 2022) based on World Bank Enterprise Survey data on 249 small manufacturing enterprises in Italy, found that e-commerce positively impacted direct exports while significantly increasing firm resilience, thus accelerating the recovery of direct exports. (Kastratovic, Bjelic, 2022) utilized panel data for 32 European countries spanning the period from 2009 to 2022 and found that the development of e-commerce positively impacted exports, especially in the services and manufacturing sectors. This finding suggests that the development of e-commerce can be used as a policy tool to promote exports. Researchers have conducted in-depth studies on the impact of e-commerce on international trade. (Peng, 2021) analyzed the development status of crossborder e-commerce in China, used the Vector Auto regression model to conduct empirical research, and found that cross-border e-commerce significantly positively impacts international trade.
To assess the influence of e-commerce on international trade more accurately, researchers have used various empirical research methods. (Hayakawa et al., 2021) estimated the gravitational equations of bilateral trade between 2019 and January-August 2020 for 34 reporting countries and their 145 partner countries and found that the development of e-commerce can help mitigate the negative influence of COVID-19 on international trade. (Shanmugalingam et al., 2023) used a set of estimation procedures such as descriptive statistics, correlation matrix, Static Tests (Levine-Lin-Chu test, Breitung test, Augmented Dickey-Fuller test, Harris-Tzavalis and Im-Pesaran-Shin test), Kao cointegration test, autocorrelation test and heteroscedasticity test. The dynamic panel data were analyzed using a two-step generalized method of moments (GMM) estimation. The results of the empirical research indicate that e-commerce has a significant influence on the international trade of Asian countries. Asian governments should adopt policies related to telecommunication technology to improve e-commerce and obtain potential benefits from international trade.
Spatial regression models
Since its emergence in the 1970s, inter-spatial econometrics has developed for over 40 years, received extensive research attention and application, and achieved fruitful results. The first law of geography was proposed by an American geographer (Tobler, 1970) who elaborated the spatial correlation, which holds that anything is correlated with anything else and that things closer together are more correlated than things farther away, thus laying the foundation of spatial quantitative analysis. (Cliff, Ord, 1973) introduced spatial correlation into the economics analysis and avoided the biased conclusions of traditional econometric analysis caused by ignoring correlation. It was not until the publication of Spatial Econometrics (Klaassen, Hendrik, 1979) that the birth of spatial econometrics was formally marked. (Anselin, 2010) pointed out that data have spatial correlation and dependence, the spatial structure of economic variables should be considered, and spatial factors should be incorporated into the setting of econometric models. According to (Goodchild, 1992) spatial econometrics based on spatial data correlation is mainly used to analyze spatial dependence and spatial heterogeneity between regions. Subsequently, many researchers have joined in the field (Cressie, 1993), (LeSage, Pace, 2009), (Elhorst, 2014), (Kozhevnikov, Voroshilov, 2024), (Uskova et al., 2024).
The choice of spatial regression model has also become a concern for researchers. The LM-Error for spatial error model (SEM) was proposed to discriminate the selection problem of non-spatial and spatial error models. (Yandell, Anselin, 1990) proposed that the LM-lag discriminates between non-spatial and spatial lag model selection problems. The Lagrange multiplier (LM) test is one of the methods commonly used to discriminate spatial regression models by estimating the model without spatial effects by OLS. The residuals of the OLS regression are subjected to the LM test to obtain the LM statistic (including the LM-Error statistic and the LM-Lag statistic) and its Robust-LM statistic (including the R-LM -Error statistic and R-LM-Lag statistic), further test the significance of these statistics as the basis for spatial econometric model selection. Specifically, if neither the LM-Error statistic nor the LM-Lag statistic is significant, the OLS model with non-spatial effects is chosen; if only one of the above two statistics is significant, the spatial error model (SEM) is chosen if the LM-Error statistic is significant, and the spatial lag model (SLM) is chosen if the LM-Lag statistic is significant; if both statistics are significant, the Robust-LM-Lag model is used, then using the Robust-LM statistic discrimination, the spatial error model is chosen if the R-LM-Error statistic is significant, and the SLM is chosen if the R-LM-Lag statistic is significant; In particular, (Anselin, 1990) combined the SEM and the SLM into a spatial Durbin model (SDM) so that it not only takes into account the spatial effects of the explanatory variables but also the spatial effects of the explanatory variables if the LM test indicates that spatial effects should be included in traditional econometric models, the SDM can be used directly according to (Elhorst, 2012).
A review of the literature in the last five years reveals a wide range of studies on applying the spatial regression model in e-commerce and export trade. The study by (Amidi, Fagheh Majidi, 2020) found that the impact of spatial spillovers or spatial dependence is one of the significant determinants of economic growth and those spillovers of geographic location and trading partners have a significant impact on economic growth. The study by (Wang et al., 2020) focused on the spatial effects of foreign trade and foreign direct investment (FDI) on the upgrading of the regional industrial structure in China. They found that foreign trade and FDI are essential drivers of industrial structure upgrading in China, and foreign trade has significant spatial spillover effects. This finding provides a valuable reference for understanding the spatial effect of trade facilitation on the export of manufactured goods. (Yamaka et al., 2023) analyzed the spatial spillover effect of Internet development on foreign trade based on panel data from 31 provinces in China from 2003 to 2016. It was found that Internet development has a positive correlation between regions, and SDM verifies its spatial effect. Internet development promotes local foreign trade and has positive spatial spillover effects on neighboring provinces. Therefore, strengthening Internet infrastructure and expanding penetration, especially in the tertiary sector, is crucial to enhancing China’s advantages in international trade.
By summarizing the relevant literature, it is found that although there are differences in the selection of each subdivided influencing factor and research methods, researchers generally argue that the development of e-commerce has a significant positive effect on export trade. However, only some studies use the spatial regression model to analyze the spatial effect between e-commerce and export trade, which needs further exploration. This paper analyzes the spatial correlation between the level of e-commerce development and export trade in 31 provinces in China (except Hong Kong, Macao, and Taiwan).
Research hypothesis
E-commerce breaks down geographical constraints, enabling exporters to reach potential customers worldwide and greatly expanding the scope of export markets. Through e-commerce platforms, exporters can reduce many of the intermediate links in traditional trade, such as agents and distributors, thereby lowering trade costs. In addition, e-commerce reduces the cost of inventory, logistics, and marketing, improving enterprises’ competitiveness. More transparent information on e-commerce platforms enables exporters to satisfy each other’s demand and supply better. This helps to reduce information asymmetry and transaction risks and improve trade security. E-commerce facilitates the flow and sharing of information; e-commerce platforms provide a wealth of market information that can help enterprises better understand the market demand and competitive situation and promote the flow and sharing of information between regions. Through e-commerce, enterprises can more accurately grasp market trends and develop more reasonable export strategies. For example, e-commerce platforms provide real-time transaction information and order processing functions, making the transaction process faster and more convenient. This helps to speed up exporters’ capital turnover and improve transaction efficiency. E-commerce simplifies trade through Electronic Data Interchange (EDI) and electronic payment.
Moreover, through the e-commerce platform, exporters can more easily understand the trade policies and regulations of the trading countries and adopt corresponding strategies to deal with trade barriers. E-commerce provides exporters more business opportunities and competitive advantages by breaking geographical restrictions, reducing transaction costs, improving transaction efficiency, enhancing information transparency, expanding marketing channels, simplifying trade processes, and coping with trade barriers. Therefore, hypothesis H1 proposes that:
H1: E-commerce contributes to the development of regional export trade.
With the increasing economic and trade links between regions, as well as the continuous improvement of the new economic geography theory, trade, people, capital, and other factors flow within a particular spatial range, e-commerce not only has an impact on the export trade in the region but also has an impact on the development of export trade in neighboring regions. Suppose too much industrial agglomeration in the region leads to too much competitive pressure on resources. In that case, it will lead to inter-regional flow, migration, and dissemination of resources such as technology, human resources, and capital, which will ultimately be conducive to achieving the development of neighboring regions (Wei et al., 2022).
The development of e-commerce will promote the upgrading of the local industrial structure. It will have a radiation-driven effect on the surrounding areas through cross-regional cooperation and exchanges, including transportation infrastructure, market demand, technology and experience, and other resources to the neighboring areas of the diffusion and transfer of such positive spatial spillover effects to help promote the development of export trade in the neighboring areas, the formation of inter-regional benign interaction and synergistic development (Lu, Hu, 2024). However, e-commerce is more aggregated in a region, which may also produce the “siphon effect”, i.e., a region, through the development of e-commerce, improve inter-regional economic competitiveness, based on its own natural advantages and attractiveness may, in turn, attract all kinds of high-quality resources, factors of production, as well as a capital investment in neighboring regions inflow, which is detrimental to the economic development of neighboring regions (Sun, 2023). Under the siphoning effect, a region’s e-commerce may have a negative spillover effect on the export trade of neighboring regions. Therefore, the hypothesis is proposed:
H2: There are spatial spillovers in the impact of e-commerce on export trade.
H2a: E-commerce has positive spillover effects on export trade in neighboring regions.
H2b: E-commerce has adverse spillover effects on export trade in neighboring regions.
According to the marginal theory of the law of diminishing marginal utility (Ormazabal, 1995) when the development of e-commerce is at a particular stage, the impact on the export trade will show a marginal diminishing effect, so the two variables may not be in a single linear relationship. According to the factor crowding effect (Broersma, van Dijk, 2007), when trade, capital, and personnel aggregation over a certain degree will produce a “congestion effect”, it will cause excess resources, consumer demand decline, the effective utilization of funds to reduce labor force and other costs of production, resulting in diminishing marginal utility, output efficiency decline, the emergence of diseconomies of scale, which are not conducive to the development of e-commerce, the impact on export trade will show a diminishing marginal effect. Diseconomies of scale are not conducive to the high-quality development of export trade. Excessive agglomeration of e-commerce will lead to all kinds of resources of blind and disorderly competition, leading to “formalism” in blind innovation, resulting in a waste of resources, which is not conducive to the high-quality development of export trade (Shen, Pan, 2023). Several factors also constrain the spatial spillover effect of e-commerce on regional export trade; in the e-commerce environment, both sides of the trade through the e-commerce platform for transactions, the lack of information interoperability and mutual understanding, resulting in a certain degree of risk in trade. The e-commerce platforms of some developed regions have substantial financial and technological advantages; they can suppress the e-commerce platforms of other regions by lowering prices and providing better after-sales services, resulting in unfair competition. This makes it difficult for some small and medium enterprises (SMEs) to survive in the export trade market, further aggravating the inequality of international trade. Logistics plays a crucial role in e-commerce, but fluctuations in logistics costs and unstable logistics service levels may hurt export trade. Excessively high logistics costs will increase the operating costs of e-commerce and reduce its competitiveness.
In contrast, poor logistics service levels may lead to problems such as damage to goods and delays in delivery, affecting customer satisfaction and trust. The cross-border transaction characteristics of e-commerce make tax and regulatory issues more complex. Differences in tax policies and regulatory standards in different regions may lead to trade frictions and disputes. The promotion benefit does not simply increase linearly with the growth of the e-commerce development level; only when the agglomeration degree is maintained within a specific range can it be influential in promoting export trade. Therefore, hypothesis H3 is proposed:
H3: There is a threshold effect on the impact of e-commerce on export trade; that is, different levels of e-commerce development will have different impacts on export trade.
Variable depictions
Dependent variable: Export trade. It is measured using the trade volume of goods exported from each China province from 2009 to 2022, taking the natural logarithm with the symbol ln Exportit . The data source is the China Statistical Yearbook and General Administration of Customs.
Core independent variable: e-commerce development level. This study adopts the e-commerce development index from 2009 to 2022 to estimate the level of e-commerce development in the region, symbolized as Ecommerceit. The E-commerce development index by province is based on the massive data of the Alibaba platform of Ali Research Institute, covering both online business index and online shopping index, which comprehensively and intuitively reflects the level of e-commerce development in each province. It is calculated by the entropy value method; indicators for calculating the e-commerce development index are shown in Table 1.
Control variables: This paper aims to investigate the influence of e-commerce on export trade and needs to control the impact of other factors on export trade. The level of economic development, degree of openness to the outside world, level of tax burden, level of innovation, transport accessibility, and industrial structure will also affect the development of export trade, so we included the above six factors as control variables to account for effects of e-commerce on export trade, the specific measurements are as follows:
-
1) Level of economic development measured by the average GDP per capita (in current prices) and take the natural logarithm of the symbol InperGDPit ;
-
2) Degree of openness to the outside world = total import and export of goods / GDP (in current prices), the symbol is Openit ;
-
3) Level of tax burden is measured by the proportion of tax revenue of the government of each province in the GDP, the symbol is InTaxit , government guides enterprises to optimize the structure of exports by adjusting export tax policy to improve quality and value-added of exported commodities, and promotes sustainable development of export trade; this variable can measure the degree of government’s intervention in economy, or measure the degree of institutional environment of each province;
-
4) Transportation accessibility is measured by interaction term the number of highway mileagexcargo volume of each province, and take the natural logarithm, the symbol is Intransportit ;
-
5) Level of innovation is measured by the number of applications for acceptance of national patent in each province, the symbol is Innovationit , the stronger the level of science technology and innovation, the more products with independent intellectual property rights and core technology can be produced, thus improving quality and added value of export trade;
-
6) The ratio of the value added of the secondary industry to the value added of the tertiary industry reflects the industrial structure of each province as well as its ability to supply export commodities, symbolized by Industryit .
Table 1. Indicators for calculating e-commerce development index in Chinese provinces
First-level indicators
Second-level indicators
Calculation method
Internet business index (0.5)
Internet business density index (0.3)
B2B e-merchant density = number of B2B e-merchants/population, retail e-merchant density = number of retail e-merchants/population
Index of transaction level of online merchants (0.2)
Percentage of total transaction value of online merchants above scale = number of retailers with annual turnover over 240,000/number of retail online merchants
Online shopping index (0.5)
Online shopping density index (0.3)
Online shopping density = number of online consumers/population
Online shopping consumption level index (0.2)
Percentage of online shoppers above scale = number of consumers who purchased more than $10,000 online in a year/number of online shoppers
Source: Provincial e-commerce index data (idata. work). Accessed: 07.05.2024.
Model construction
To better reveal the impact of e-commerce on regional export trade and differences in spatial spillover effects, this paper constructs three spatial regression models as follows:
SEM: lnExportit = a0 + a 1 Ecommerceit + + ^Control it + AWs tt + p it ;
SLM: lnit Export = a0 + pWEcommerceit +
+ a1Ecommerceit + /3 1 Controlit + AWsit + pit; (2)
SDM: lnExportit = a0 + pW lnExportit +
+ a1Ecommerceit + a2 WEcommerceit +
+ f> 1 Controlit + l32Controlit + AWsit + pit
Spatial weighting matrix
In this paper, the adjacency matrix is chosen to reflect the spatial relationship between provinces; if provinces are adjacent, there is a proximity relationship, and the weight is 1; otherwise, the weight is 0. The formula constructs spatial weights:
w
1, if i and j are not neighborly relations 0, if i and j are not neighborly relations .
Spatial autocorrelation test
Spatial autocorrelation is defined by one size measurement and one spatial contiguity measurement, while spatial cross-correlation can be defined by two size measurements and one spatial contiguity measurement (Cliff, Ord, 1973). The value of Moran’s I generally lie between [-1, 1]. If the value is greater than 0, then the variables are spatially positively correlated. In the case of export trade, high values are adjacent to high values, and low values are adjacent to low values. If the value of Moran’s I is close to 0, the variables are randomly distributed, and there is no spatial correlation.
Does the impact of e-commerce on export trade have a spatial spillover effect, i.e., is the export trade of a province affected by the level of e-commerce development of neighboring districts? This paper uses Global Moran’s I to measure the spatial correlation of export trade under the construction of an adjacency matrix, as shown in Table 2 . The results verify that Global Moran’s I of export trade during 2009–2022 is greater than 0 and is significant at a 1% level, indicating a significant spatial correlation in the export trade of each province.
Table 2. Moran’s I for export trade, 2009–2022
|
Year |
I |
E(I) |
sd(I) |
z |
p-value* |
|
2009 |
0.369 |
-0.033 |
0.119 |
3.391 |
0.001 |
|
2010 |
0.386 |
-0.033 |
0.119 |
3.535 |
0.000 |
|
2011 |
0.365 |
-0.033 |
0.119 |
3.360 |
0.001 |
|
2012 |
0.359 |
-0.033 |
0.119 |
3.301 |
0.001 |
|
2013 |
0.351 |
-0.033 |
0.118 |
3.246 |
0.001 |
|
2014 |
0.351 |
-0.033 |
0.118 |
3.257 |
0.001 |
|
2015 |
0.413 |
-0.033 |
0.118 |
3.779 |
0.000 |
|
2016 |
0.396 |
-0.033 |
0.118 |
3.629 |
0.000 |
|
2017 |
0.386 |
-0.033 |
0.118 |
3.565 |
0.000 |
|
2018 |
0.380 |
-0.033 |
0.118 |
3.508 |
0.000 |
|
2019 |
0.371 |
-0.033 |
0.117 |
3.439 |
0.001 |
|
2020 |
0.386 |
-0.033 |
0.117 |
3.575 |
0.000 |
|
2021 |
0.384 |
-0.033 |
0.118 |
3.549 |
0.000 |
|
2022 |
0.387 |
-0.033 |
0.117 |
3.590 |
0.000 |
|
Source: own calculat |
ions. |
Spatial regression analysis is conducted to respond to the above question.
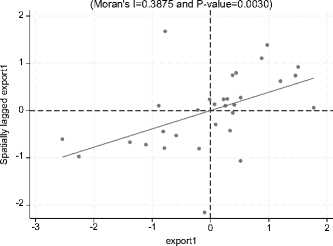
Moran scatter plot is used to study local spatial features by describing the correlation between variable Z and its spatial lag. The horizontal axis of the scatter plot corresponds to the described variable, and the vertical axis corresponds to the spatial lag vector. It can be divided into four quadrants, corresponding to the four types of local spatial linkage between regional units and their neighbors (high-high, low-high, low-low, and high-low clusters). To further study the spatial correlation of export trade, the Moran scatter plot is made with relevant data of spatial weight matrix W1 of the neighboring indicators, as shown in Figure 1 (Due to the large number of years, the relevant computed values are more similar, so the representative years are selected for demonstration).
As can be seen in Figure 1, most regions are in the first and third quadrants. Overall, China’s export trade shows a positive spatial correlation. Moran’s I reveal an upward trend, indicating a spatial clustering effect in China’s regional export trade from 2009 to 2022.
Regarding the selection of the spatial regression model, this paper uses an autocorrelation test to determine which one of SLM, SEM, and SDM is best suited. Firstly, the LM test is used for the model selection, and the results are presented in Table 3. The results verify that the LM-Error and Robust LM-Error obtained under LM-test respectively failed the significance test, and the LM-Lag and Robust LM-Lag are significant at 1% level, so SLM is more suitable for the study in this paper.
If the LM test shows that spatial effects were included in the traditional econometrics model, the
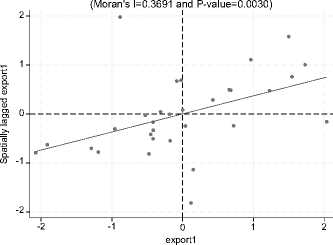
Figure 1. Moran’s scatterplot for export trade in selected years
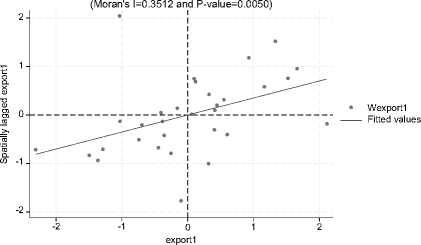
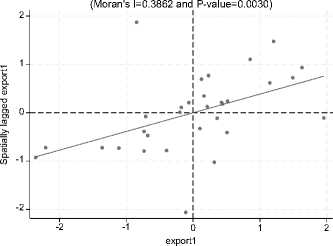
Wexport1
Fitted values
Source: own calculations.
more generalized SDM can be utilized directly for estimation. However, the results of the LM test in our study show that the spatial error model does not include spatial effects, so the SLM is chosen for its robustness and accuracy of regression results.
The results of the Hausman test in Table 4 show Prob > chi2 = 0.0000, which rejects the original hypothesis, so the fixed-effect model is chosen for regression analysis. The results of the LR test show that the spatial-temporal fixed-effect ( two-way fixed effects) model is more suitable for our study. This study selects the spatial lag model (SLM) with two-way fixed effects. The estimation of the LM test, Hausman test, and LR test are listed in Table 3 and Table 4.
Robustness test
The omission of variables is a problem in most research. To test the robustness of the model, a control variable that may have an impact on export trade is added – the level of human capital, which is measured by the proportion of the number of students enrolled in universities in each province in the total population, with the symbol InHCit, The higher the level of human capital, the higher the level of science and technology and the ability to innovate, the more capable export trade can produce more self-owned intellectual property rights and core technology products, and improve the quality and added value of export trade. Through establishing the spatial regression model, some scholars collected data for empirical testing and found that improving human capital structure and stock can promote export trade development (Dai et al., 2021). The regression results of Model 1 are presented in Table 6. After adding control variables, the e-commerce regression coefficient on export trade and the spatial effect coefficients are still significantly positive, that adopted the robustness test.
Replacement of spatial weight matrix
We perform the robustness test by transforming the spatial weight matrix and the adjacency matrix into the economic distance space weight matrix, with the formulas, respectively:
^
< pergdpfj i^j
, i = j
where pergdp ij is the difference in GDP per capita between regions i and j . To minimize the error, the inverse square form is used as the spatial weight, and the weight of the diagonal of the matrix is zero.
Table 3. Results of the LM test
|
Test |
Statistic |
df |
p-value |
|
Spatial error |
|||
|
Lagrange multiplier |
0.879 |
1.000 |
0.349 |
|
Robust Lagrange multiplier |
1.722 |
1.000 |
0.189 |
|
Spatial lag |
|||
|
Lagrange multiplier |
13.893 |
1.000 |
0.000 |
|
Robust Lagrange multiplier |
14.736 |
1.000 |
0.000 |
|
Source: own calculations. |
|||
Table 4. Results of Hausman, LR test
|
chi2(7) |
Prob > chi2 |
|
|
Hausman |
73.60 |
0.0000 |
|
LR test both ind |
38.62 |
0.0000 |
|
LR test both time |
932.41 |
0.0000 |
|
Source: own calculations. |
||
The distance spatial weight matrix depends on the geographic distance between regions based on latitude and longitude. Commonly used methods are the inverse of distance and the inverse of distance squared, which decay slower as the spatial effect increases with distance. Therefore, this paper uses the inverse of the square of the distance to set the distance spatial weight matrix. The formula is as follows:
^ = fir'*7 ,
I 0 i = )
where d i j is the geographic distance based on latitude and longitude between areas i and j .
According to the results of Model 2 and Model 3 in Table 6, the significance levels of the explanatory variable coefficients and rho coefficients are the same after replacing the spatial weight matrices, so the empirical results are robust.
Replacement variable measurement
The interaction term between the number of highway miles and freight volume in each province is introduced into the SLM because of the possible positive synergistic effect when measuring the degree of transportation accessibility. To test the robustness of the model, the interaction term is replaced with two separate variables for regression, and according to the results of Model 4, the sign of the coefficients of the variables does not change
Table 5. Results of the robustness test
|
Variable |
(1) |
(2) |
(3) |
(4) |
|
Eccommrceit |
0.182*** |
0.176*** |
0.170*** |
0.118*** |
|
(0.0364) |
(0.0358) |
(0.0355) |
(0.0368) |
|
|
InperGDPit |
1.290*** |
1.474*** |
1.326*** |
1.391*** |
|
(0.123) |
(0.122) |
(0.130) |
(0.126) |
|
|
Openit |
1.896*** |
2.404*** |
2.320*** |
2.262*** |
|
(0.172) |
(0.158) |
(0.158) |
(0.159) |
|
|
Intransportit |
-0.0887** |
-0.0947** |
-0.117*** |
|
|
(0.0359) |
(0.0373) |
(0.0370) |
||
|
Inhighway |
-0.585*** |
|||
|
(0.169) |
||||
|
Industryit |
0.229*** |
0.157** |
0.207*** |
-0.0693* |
|
(0.0627) |
(0.0663) |
(0.0643) |
(0.0382) |
|
|
Ininnovationit |
-0.0867*** |
-0.109*** |
-0.116*** |
0.245*** |
|
(0.0297) |
(0.0305) |
(0.0300) |
(0.0636) |
|
|
InTaxit |
2.886** |
2.329* |
2.227* |
-0.0978*** |
|
(1.300) |
(1.335) |
(1.321) |
(0.0299) |
|
|
InHCit |
35.60*** |
|||
|
(8.102) |
||||
|
Incargo |
1.994 |
|||
|
(1.298) |
||||
|
rho |
0.261*** |
-0.127*** |
0.306*** |
0.273*** |
|
(0.0569) |
(0.0407) |
(0.0760) |
(0.0570) |
|
|
sigma2_e |
0.0388*** |
0.0422*** |
0.0412*** |
0.0397*** |
|
(0.00265) |
(0.00287) |
(0.00282) |
(0.00271) |
|
|
Log-likelihood |
85.9949 |
70.1272 |
72.5357 |
80.6896 |
|
Observations |
434 |
434 |
434 |
434 |
|
R-squared |
0.334 |
0.318 |
0.314 |
0.219 |
|
Number of code |
31 |
31 |
31 |
31 |
|
Source: own calculations. |
||||
after replacing the variable measures, and the significance levels are the same, so the empirical results are robust.
Analysis of spatial effects
Table 6 reports the results of SLM regression with the two-way fixed effects. The four models’ fitting results show that e-commerce development positively correlates with export trade. In the spatial lag model, except for the level of tax burden, the estimated coefficients of the other variables pass the test of significance at the 1% level, which suggests that the development of e-commerce is conducive to the promotion of the growth of export trade without considering the condition of regional heterogeneity. So, the rise of the digital economy, e-commerce, intelligent services, and other industries has led to the transformation and upgrading of traditional trade, promoting the advancement of factors of production, the change of trade structure, and the improvement of product quality and export trade volume. Based on this, we can conclude that Hypothesis 1 is valid. Coefficients of spatial autocorrelation in SLM is significant, indicating that the export trade has a significant spatial autocorrelation, which is the same as the aforementioned spatial autocorrelation test results, so the use of the SLM has a certain degree of rationality. From the perspective of additional control variables, economic development, and export trade show a significant positive correlation. This is consistent with the reality of China’s regional economic development; the improvement of economic quality includes the level of domestic demand, the level of the manufacturing industry, and the optimization of industrial structure, which can create large-scale domestic demand, and the products exported gradually shift from traditional labor-intensive products to high-technology, high-value-added products, which improves the quality and efficiency of export trade.
Table 6. The regression results of SLM with the two-way fixed effects
|
Variable |
Main |
Direct |
Indirect |
Total |
|
Ecommerceit |
0.144*** |
0.147*** |
0.0513*** |
0.198*** |
|
(0.0360) |
(0.0366) |
(0.0174) |
(0.0489) |
|
|
InperGDPit |
1.328*** |
1.342*** |
0.473*** |
1.815*** |
|
(0.125) |
(0.105) |
(0.115) |
(0.150) |
|
|
Openit |
2.214*** |
2.266*** |
0.802*** |
3.068*** |
|
(0.160) |
(0.178) |
(0.207) |
(0.285) |
|
|
Intransportit |
-0.105*** |
-0.104** |
-0.0372** |
-0.141** |
|
(0.0365) |
(0.0403) |
(0.0189) |
(0.0569) |
|
|
Industryit |
0.230*** |
0.223*** |
0.0806** |
0.304*** |
|
(0.0640) |
(0.0738) |
(0.0365) |
(0.106) |
|
|
Ininnovationit |
-0.113*** |
-0.115*** |
-0.0407*** |
-0.156*** |
|
(0.0297) |
(0.0291) |
(0.0143) |
(0.0400) |
|
|
InTaxit |
2.005 |
1.952 |
0.679 |
2.632 |
|
(1.310) |
(1.331) |
(0.496) |
(1.790) |
|
|
rho |
0.283*** |
|||
|
(0.0570) |
||||
|
sigma2_e |
0.0404*** |
|||
|
(0.00277) |
||||
|
Log-likelihood |
76.4663 |
|||
|
Observations |
434 |
434 |
434 |
434 |
|
R-squared |
0.298 |
0.298 |
0.298 |
0.298 |
|
Number of code |
31 |
31 |
31 |
31 |
|
Source: own calculations. |
||||
Openness and export trade show a significant positive correlation; with the increase in the level of openness, local enterprises and foreign enterprises trade more and more frequently, bringing more advanced management experience at the same time, but also conducive to undertaking international industrial transfer, promote the development of export trade in the region.
The estimation for transportation accessibility is negative and passes the significance test at the 1% level. Transportation accessibility significantly impacts export trade, which may be explained by the following reasons: constructing and maintaining transportation infrastructure requires significant capital investments. In a situation of limited resources, high infrastructure costs may crowd out funding for other essential economic activities; the construction of transportation projects, especially large-scale projects such as roads, railways, and airports, may cause environmental damage, such as land erosion, pollution of water resources and reduction of biodiversity. These problems affect local ecosystems and may negatively influence international reputation and export markets. In addition, carbon emissions and energy consumption will grow with increased traffic, adversely affecting global climate change, which may increase the environmental burden and costs for high-carbon-emitting enterprises; transport connectivity may lead to a concentration of resources, talent, and capital in certain regions, exacerbating imbalances in regional development; and traffic congestion may worsen with increased traffic. This will not only increase the cost of transportation and time but may also reduce transportation efficiency and hurt export trade.
There is a significant positive correlation between industrial structure and export trade; the upgrading of industrial structure positively promotes export trade by optimizing the structure of export products, improving the competitiveness of export enterprises, promoting the specialized division of labor and industrial chain integration, enhancing international competitiveness, promoting trade facilitation, and providing diversified market opportunities.
The level of innovation shows a significant negative correlation. Technological risks and uncertainties often accompany innovation, and new technologies or products may face problems such as low market acceptance and insufficient technological maturity, which may lead to difficulties in product promotion and affect export trade; innovation requires a large amount of capital investment, especially in the research and development (R&D) stage. High R&D costs may increase the financial pressure on enterprises and reduce their profitability, which concerns their export capacity. Intellectual property protection issues affect the stability and sustainability of export trade; in the international market, some countries may erect technical trade barriers to restrict imports of high-technology products from other countries. These barriers may include procedural standards, certification requirements, and patent protection, making it difficult to export innovative products.
The estimation of the tax burden in the SLM does not pass the significance test, although it is significantly correlated with export trade. In this regard, this paper argues that under the influence of the siphoning effect of existing big cities. At the same time, the government guides enterprises to optimize the export structure by adjusting the export tax policy; it will also hurt the export trade; for example, a higher level of tax burden will directly lead to an increase in the cost of exported products, which will reduce the competitiveness. Considering the spatial effect of exports, it is difficult to evaluate whether the level of tax burden can positively affect the development of the region’s overall export trade.
The estimation of the spatial auto-correlation coefficient is positive. It passes the significance test at the 1% level, which suggests that there exists apparent agglomeration in the process of China’s export trade and that the export trade of a province is affected by the level of e-commerce development of the neighboring regions. The spatial spillover effect mainly manifests in the following aspects.
-
1) Industrial agglomeration and diffusion: regions with well-developed e-commerce tend to attract more export enterprises, creating an industrial agglomeration effect. Such agglomeration promotes the improvement of local e-commerce infrastructure and logistics and strengthens market expansion. When e-commerce develops to a particular stage, the need to spread outward may arise due to resource constraints and rising costs. At this point, neighboring regions tend to become the preferred diffusion areas, thus being positively affected by the development of e-commerce.
-
2) Information and technology spillovers: regions with developed e-commerce have more advanced technologies and richer market information. These technologies and information may overflow to neighboring regions through personnel mobility and enterprise cooperation. Enterprises in neighboring regions can take the opportunity to learn to improve their e-commerce level and thus enhance their export competitiveness.
-
3) Market expansion and complementarity: e-commerce development of e-commerce helps enterprises explore new markets and expand the scale of exports. When the level of e-commerce in neighboring regions is improved, local enterprises can leverage their market influence to expand the international market further. At the same time, the market demand of neighboring regions may also become a new growth point for indigenous enterprises, forming a complementary effect.
-
4) Policy interaction and synergy: the interaction and synergy of e-commerce development policies of neighboring regions can contribute to forming a regional e-commerce scale advantage. This advantage is conducive to the development of local export trade and enhances the whole region’s international competitiveness.
To further measure the spatial characteristics of the impact of e-commerce on export trade, In this paper, the spatial effect is divided into the following three parts: direct effect consists of two aspects; one refers to the impact of the level of e-commerce development on the export trade of the province, and the other refers to the impact of the level of e-commerce development on the export trade of the neighboring provinces, which in turn feeds the development of the export trade of the province. The indirect effect refers to the spatial spillover effect, i.e., the impact of the e-commerce development level of neighboring provinces on the export trade of the province. Total effect refers to the average degree of influence of a province’s e-commerce progress on China’s export trade. The regression results for each effect are listed in Table 6. The direct effect of e-commerce development is significantly positive, indicating that e-commerce in a province promotes the export trade of that province, further confirming that hypothesis 1 holds. Among the direct effects of other control variables, economic development, openness to the outside world, and industrial structure significantly contribute to the development of export trade in that province, transport and innovation have a negative effect, and tax burden does not contribute significantly to the development of export trade in that province.
Regarding indirect effects, e-commerce passed the 1% significance test and had a positive spillover effect on export trade of neighboring provinces; hypothesis 2 holds. Regarding the total effect, e-commerce generally promotes the development of China’s export trade, and the regression results are significant. In addition, the regression coefficient rho is significantly positive, indicating that the export trade of the province will be positively influenced by the export trade of the neighboring provinces, i.e., there is no “siphoning effect” of the export trade among the provinces.
Threshold effect test
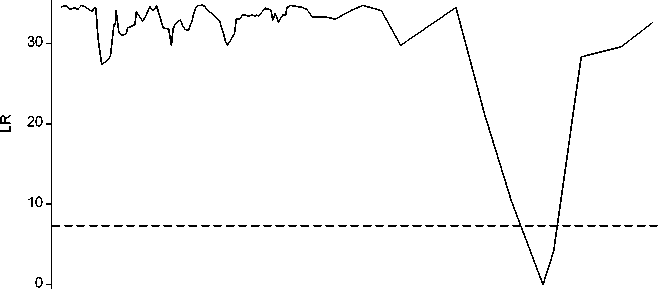
The regression of baseline and spatial effect analyses show that e-commerce development promotes export trade, but does this effect have nonlinear characteristics? In this paper, the core explanatory variables are used as threshold variables to measure the nonlinear impact of e-commerce on export trade. It is necessary to determine whether there is a threshold effect. If a threshold effect exists, it is also necessary to determine the number of thresholds that exist further. As shown in Table 7, the single-threshold effect passed the significance test at the 5% level, and the double-threshold effect and the triple-threshold effect did not pass the significance test. The threshold value is 12.3446, and the confidence interval is [12.0192, 12.6271] at the 95%. The influence coefficient is 0.05 when it is lower than the threshold and 0.11 when it is higher than the threshold, indicating that the positive effect of different levels of e-commerce development on export trade shows an upward trend; therefore, hypothesis H3 is valid.
Discussion
The authors do not claim to build a fundamentally new approach to the study of impacting e-commerce on export trade. The article consistently uses proven methods to determine the importance of e-commerce for the development of 31 Chinese regions. Nevertheless, the authors did not aim to study the patterns of territorial industrial organization. The issues of enterprises’ location, availability of resources, forms of industrial organi-
Table 7. Results of the threshold effect test
|
Threshold variables |
Threshold |
F-value |
P-value |
10% |
5% |
1% |
|
Level of e-commerce development |
single threshold |
49.77 |
0.0140 |
31.4987 |
36.3850 |
54.1600 |
|
dual threshold |
11.22 |
0.5480 |
24.7579 |
31.3395 |
44.2781 |
|
|
three thresholds |
8.18 |
0.6020 |
19.0847 |
24.0540 |
33.0369 |
|
|
Source: own calculations. |
||||||
Figure 2. Threshold effect LR chart
-|------------------------------------------1------------------------------------------1------------------------------------------1------------------------------------------1------------------------------------------1—
4 6 8 10 12 14
Threshold effect
Source: own calculations.
zation, the structure of regional economies, and the principles of regional policy, that are the elements of mesoeconomics, put in a “black box”. In case of China’s regions, if great number of variables and extra large data volume complicated significantly the research, they will definitely be considered in the following modifications of the approach.
The versatility of the tools used suggests that the approach can be applied to other national casestudy as well. The country under research can be a unitary (like China) or a federal state. An important prerequisite is the availability of administrative territories with published statistical reports. Yet, national peculiarities can affect the architecture of the model. In some cases, the spillover effect will be detected, in other cases, the siphoning effect will be found. A serial study of national economies will certainly help to understand the importance of e-commerce in different business environments and identify the factors influencing its application. But this is a separate topic for future research.
Conclusions
In this article, the authors investigate in methodological and practical issues of the impact of e-commerce on regional export trade. Based on the panel data of China’s 31 provinces from 2009 to 2022 we proved the impact of e-commerce on export trade through the spatial regression model and threshold effect model. From the space perspective, this paper empirically examines the spatial correlation between the level of e-commerce development and export trade using a spatial regression model. The results demonstrate that the development of e-commerce has a significant positive spatial spillover effect on export trade. Economic growth, openness to the outside world, industrial structure, and innovation significantly promote export trade. At the same time, case-study revealed that the government tax burden does not contribute much to export trade. At the same time, transportation accessibility has negative impacts under certain restricted circumstances. Therefore, when promoting the construction of transportation infrastructure, it is necessary to fully consider its probable cost and environmental, social, and political impacts and to take adequate measures to reduce these negative impacts. E-commerce encourages the development of China’s export trade, and there is no “siphon effect” between provinces. According to the analysis of the threshold effect, there is a single-threshold effect of e-commerce on the impact of export trade, and the positive effect of different levels of e-commerce development on export trade is on an upward trend.
