Empirical and theoretical validation of a use case diagram complexity metric

Author: Sangeeta Sabharwal, Preeti Kaur, Ritu Sibal
Journal: International Journal of Information Technology and Computer Science @ijitcs
Article in issue: 11 Vol. 9, 2017.
Free access
A key artifact produced during object oriented requirements analysis is Use Case Diagram. Functional requirements of the system under development and relationship of the system and the external world are displayed with the help of Use Case Diagram. Therefore, the quality aspect of the artifact Use Case Diagram must be assured in order to build good quality software. Use Case Diagram quality is assessed by metrics that have been proposed in the past by researchers, based on Use Case Diagram countable features such as the number of actors, number of scenarios per Use Case etc., but they have not considered Use Case dependency relations for metric calculation. In our previous paper, we had proposed a complexity metric. This metric was defined considering association relationships and dependency prevailing in the Use Case Diagram. The key objective in this paper is to validate this complexity metric theoretically by using Briand’s Framework and empirically by performing a Controlled experiment. The results show that we are able to perform the theoretical and empirical validation successfully.
Use Case Diagram, Complexity metric, Empirical validation
Short address: https://sciup.org/15016207
IDR: 15016207 | DOI: 10.5815/ijitcs.2017.11.04
Text of the scientific article Empirical and theoretical validation of a use case diagram complexity metric
Published Online November 2017 in MECS
The degree of conformance to the stakeholder’s requirements defines the software quality. One of the major objectives in software development process is software quality improvement. Software quality measurement tries to quantify to what extent a software possesses desirable features [13].
Researchers widely accept that during requirement analysis phase of software development, the models that are created have significant influence on the overall quality of the software product that is realized in the end [8, 43].
It has been observed that faults existing in the artifacts of initial analysis phase of software development may proliferate to the artifacts developed in later phases. A lot more effort and resources would be required to correct those faults occurring in the later phases of software development [43]. Therefore artifact quality is an important area of research.
Artifacts/models need to support complex and changing requirements, therefore artifact/model quality becomes a progressive area of requirements engineering research [28]. Early and objective assessment of artifact quality attributes may help in redesigning for better resource allocation [17]. There is need to objectively assess the artifact quality in order to improve maintainability, understandability and similar quality factors of the software.
Quantitatively the quality of software is measured through Metrics. Metrics are known to be good indicator of the software quality [4]. Different quality attributes that define software product, processes and projects are quantitatively measured through metrics. One such quality attribute is the structural properties of conceptual models/artifacts [8]. Structural complexity of various analysis models/artifacts such as E-R diagram, class diagrams, use case diagram, created during the initial phases of software development have been used as indicators of system quality. Investigation is required to show how structural complexity of an artifact determines the quality of artifact and also forms the basis for software quality measurement research [9].
Metrics for measuring complexity focus on structural complexity of different elements and their relationships. Researchers have proposed a number of metrics for measuring complexity [9, 10, 15, 17, 19, 20, 21, 26 and 28]. These metrics have been substantially validated empirically to establish their practical utility.
Complexity of the system is one of the most important attributes that forms the basis of metrics evaluation as it gives information regarding the effort needed to understand and implement the requirements [12]. Complexity measurement of a system also helps us in prediction of software effort, maintenance and evaluation of design components.
Complexity metrics have been used as indicative parameter of the understandability of the diagrams. The artifact must be thoroughly understandable before assessing other properties such as maintainability. To understand the artifact, its properties such as design format, comprehensibility and expression must be unambiguous and self-evident.
Use Case Diagrams are artifacts created during early phases of software development that are significant for formulating, corroborating and documenting the system behavior [6]. Functional requirements of the system under consideration are depicted with the help of Use Case Diagram and may be considered as a contract among the developer and the customer [6, 3]. Good understandability of the Use Case Diagram is necessary so as to have effective contribution of the artifact in process of software development. The quality of conceptual models or artifacts such as Use Case Diagrams plays an important role in effective and right implementation and execution of the system requirements. Therefore it is crucial to ensure Use Case Diagram quality and work should be done to achieve this.
Metrics derived from Use Case Diagram can act as an effective means for assessing system complexity at the time of early phase of software development. Other important predictions about effort and cost required for the software under consideration can also be done by using the complexity metrics. Most of the Use Case Diagram based metrics found in literature are computed by counting different elements that constitute the Use Case Diagram namely number of actors, number of use cases, and number of scenarios per Use Case etc. Several Use Case Diagram based metrics are present in the literature [16, 21, and 27]. These metrics are computed on the basis of features that could be counted from the Use Case diagram, such as number of actors, number of Use Cases and number of scenarios per Use Case etc. Use Case dependency relation and its impact is not considered while formulating those metrics.
A system is described and identified by its elements and relationships among them [7]. Therefore, relationships in the artifact also contribute towards the system complexity. Complexity may be prevailing because of the relation amongst the Use Cases and also association amongst each actor and Use Case. The relationships shown in the Use Case Diagram are not incorporated in the metrics proposed by different authors in literature. We have proposed a complexity metric computed taking into consideration the structural properties of Use Case Diagram in our earlier work [33]. This metric is defined by considering the concept of relationships that exist among the Use Cases, and also Use Case and actor association in the Use Case Diagram [33]. We used Kaner’s framework [23] to perform basic theoretical validation and it was observed that some association between the metric and understandability of Use Case Diagram exists.
We present the extension of our earlier work in this paper. The key objectives of this work are (1) to present the empirical validation of the metric given in [33] and investigate the relation of complexity metric and understandability of Use Case Diagram and (2) To validate the metric against the construct validity criteria given by Briand [7]. Theoretical and empirical validation done in this work shows that the investigated metric qualifies as a complexity metric and is closely related with one of the quality attributes i.e. understandability.
The organization of the paper is as follows. Discussion about the related work is mentioned in Section II. We explain the basic concepts of Use Case Diagram in Section III. The approach used to calculate the proposed Use Case Metric [33] is explained in section IV. Validation of the proposed metric against the construct validity criteria given by Briand framework [7] is shown in section number V. Empirical validation and results are shown in section VI. Validity evaluation details are given in section VII. Finally, the paper is concluded along with the future work in the last section.
-
II. Related Work
Cyclomatic Complexity metric proposed by McCabe [28] measures the logical complexity of the program. Quality of class was measured by Chidamber and Kemerer [15] in metric suite proposed by them for object oriented software. Halstead [20] proposed a metric to determine effort by considering program source code. Henry and Kafura [22] proposed an Information Flow Metrics to quantify information flow level and coupling among different program modules. Function Point Analysis metric was proposed by Albrecht [3] to measure functionality using function points. A set of metrics based on coupling was proposed by Yin and Winchester [36]. Object oriented design metrics proposed by Lorenz and Kidd [26], selected features like class size, and inheritance for complexity evaluation. Inheritance metrics based on polymorphism and information hiding were proposed by Brito and Carapuça [11].
Entropy distance was also used to define structure complexity measure for class diagram and was proposed by Yuming et al. [37]. The complexity of the class diagram was measured by Kang et al. [24] by using weighted class dependency graph and entropy distance. Relational complexities between classes were defined as the basis for structural software metrics by Khanahmadliravi et al. [25]. Maintenance cost estimation for a program was done through spatial metrics proposed by Chhabra et al. [14]. Structural complexity model was proposed by Zhou et al. [38] that used entropy distance to quantify complexity. An event based approach to compute the complexity was also proposed by Singh et al. [32].
Complexity metrics available in literature based on Use Case Diagram are very few. Complexity metrics proposed by Marchesi [27], Henderson-Sellers et al. [21], Douglass [16], evaluate the system complexity by considering Use Case Diagram. They used only the countable features of the use case diagram like no. of actors, no. of activities per use case, no. of scenarios etc. Use case quality metrics proposed by Cherfi et al. [13] use entropy and cohesion among use cases as complexity measure and apply these metrics for use case refinement.
Yavari et al. [35] proposed use case complexity metrics to find use case weight on the basis of use case type, priority, goals, scenarios, related entity database and business rules. Sellami et al. [41] have proposed a measurement technique by using set of scenarios and take into account the relationships among the use cases to some extent. A metric called use case point given by Karner [46] classified the use cases into groups based on subjectively determined size or complexity and then used for other kind of estimations. Use case metrics proposed by Aljohani and Qureshi [47] based on counting modified use cases and classes were used to assess, manage and mitigate risks occurring due to changing requirements.
To the best of our knowledge, Use Case Diagram dependency relations are not precisely and accurately incorporated in computing complexity metrics that are already present in literature. In this paper we validate the complexity metrics proposed by us in [33] which is based on the dependency relations existing in Use Case Diagram.
-
III. Use Case Diagram
Functional requirements of the system under consideration are depicted through Use Case Diagram which constitutes actors, Use Cases and their relationships as shown through fig1.
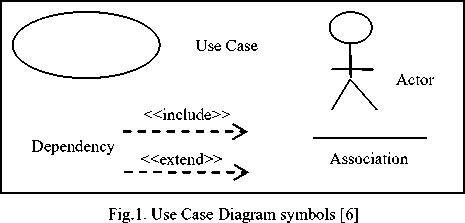
Use Case: Illustrates the functional requirements given by all stakeholders.
Actor: User of the system is called actor and it can be a person, device or other system.
Dependency: Two Use Cases may be semantically related and implementation of Use Cases may be interdependent. Broadly two kinds of dependencies are there in the Use Case Diagram called include dependency and extend dependency [6].
Include dependency is between two Use Cases in which the behavior of dependent Use Case is explicitly included inside the base Use Case [6].
Extend dependency is between any two Use Cases in which dependent Use Case behavior is implicitly incorporated in the base Use Case and dependent Use Case cannot stand alone [6].
Association Relationship: An actor and Use Case is connected using straight connecting line called association between the two [6].
Generalization: is a relationship in which different actors or Use Cases are generalized as one actor or Use Cases respectively. The concept of inheritance is shown through generalization in Use Case Diagram [6].
-
IV. Proposed Metric
In our earlier work [33], we had proposed a complexity metric taking into consideration the dependency relationships and associations that are part of the Use Case Diagram. In this section, approach about computing this metric is explained.
-
A. Template Used
Use Case template describes Use Cases and Actor template describes Actor.
Template for Use Case the components in the Use Case Template are as follows:
Use Case ID: It is a distinctive number associated with every Use Case.
Use Case Name: It is the title or name to recognize a particular Use Case.
Use Case Description: It is a short narrative to describe the requirement a particular Use Case is representing and is written in simple natural language.
Type: There are two types of Use Cases i.e. Main and Dependent. Use Case that is linked to the actor by association relationship is known as Main Use Case. The Dependent Use Case depends on the Main Use Case and through include or extend dependency main Use Case calls dependent Use Case.
NScenario: this shows number of Scenarios and alternate scenarios of a particular Use Case.
Initiator Vector: This is a set containing actors and Use Cases that can call a particular Use Case by means of association or dependency relationships.
Trigger Vector: This is a set containing Use Cases that can be called by particular Use Case by means of include/extend dependencies.
Template for Actor the components in Actor Template are as follows:
Actor Identification: Each actor is assigned an alphanumeric identification which is unique.
Actor Name: It is the title or name of the actor that is interacting with the system.
Actor Description: This is a short written narrative describing the actions an actor can perform.
Trigger Vector: An actor can call Use Cases through association relation. The set of such Use Cases is called trigger vector.
-
B. Definitions
Definitions which are used for computing Use Case Diagram metric are introduced in this section.
Initiator Use Case Matrix (Minit): Minit matrix identifies actors or Use Cases that initiate a particular Use Case. The matrix entry at position aij in Minit indicates that jth Use Case or actor is the initiator of ith Use Case. The integer value at the position aij is the dependency/association strength between i and j. Minit matrix has n×m dimensions that represents n Use Cases; m actors and main Use Cases.
Trigger Use Case Matrix (Mtrig): The entry at position aij in the matrix Mtrig shows that a particular Use Case or actor i, triggers j Use Case. The integer value at the position aij is the dependency/association strength between i and j. Mtrig matrix has n×m dimensions that represents n Use Cases and actors; m main and dependent Use Cases.
The value assigned at the position a ij shown in Initiator/ Trigger matrices is 1, 2 or 3. This value depends on the relationship that exists between an actor and main Use Case or the dependency relation existing between various Use Cases, and is described below:
-
• If association is present between an Actor and a Use Case then value given at position a ij is 3, as this Use Case will always be called by the actor.
-
• If there is include dependency between the Use Cases then value given at position ai j is 2, as in this case main Use Case will always call the dependant Use Case.
-
• If there is extend dependency between the Use Cases then value given at position a ij is 1, as in this case main Use Case may or may not call the dependant Use Case.
Initiator Effect (IE): The summation of all dependencies on an ith Use Case because of its initiator Use Cases/actors is called Initiator Effect.
Trigger Effect (TE): The summation of all Use Case dependencies on the i th Use Case because of Use Cases triggered by it is called as Trigger Effect.
Combined Initiator Effect (CIE): The summation of IE in the matrix M init is called Combined Initiator Effect
Combined Trigger Effect (CTE): The summation of TE in the matrix M trig is called Combined Trigger Effect.
-
C. Procedure
In this section we explain the approach for calculating the Use Case metric. It consists of following steps.
-
(1) Make Use Case Diagrams for software to be developed.
-
(2) Document Use Cases with the help of Use Case Template and Actors with the help of Actor Template.
-
(3) Develop the matrix M init i.e. Initiator Use Case Matrix.
-
(4) Develop the matrix M tirg i.e. Trigger Use Case Matrix.
-
(5) (a) Compute Combined Initiator Effect (CIE) from Initiator Matrix (M init )
IE (i) is the initiator effect for the ith Use Case and is given by
IE(i) = ∑ (( ( , ) ( ) ℎ ℎ 3) ×
()) +
∑ ( ( , ) ( ) ℎ 2ℎ) +
( ․ ( , ) ( ) ℎ 1ℎ)
(b) Combined Initiator effect (CIE) for the Use Case Diagram is
Z n
IE ( i )
where i is the use case/actor (2)
Compute Combined Trigger Effect (CTE) from Trigger Matrix (Mtrig).
TE (i) is the trigger effect due to a Use Case /actor and is given by
TE(i) = ∑ (( ( , ) ( ) ℎ ℎ 3) ×
()) +
∑ ( ( , ) ( ) ℎ 2ℎ) +
( ․ ( , ) ( ) ℎ 1ℎ)
Combined Trigger Effect (CTE) for the Use Case Diagram is
CTE = ^ n TE ( i )
where i is the use case/actor (4)
-
(6) Calculate the Use Case Diagram complexity by summing up CTE with CIE
= +
-
(7) Add the complexity of all Use Case Diagrams created for the system under consideration, to get the system complexity from the viewpoint of Use Case Diagram.
E n
[ C usecasediagram ( k )]
-
D. Case Study
We now illustrate the proposed approach for Library management system given in Fig. 2. The diagram has three actors i.e. Librarian L1, Student S1, and Supplier S2. The Main Use Cases having multiple scenarios are 1,2,3,4,5,6,7,8,9 given in Table 3. and dependent Use Cases are 10,11,12,13,14,15. For simplicity we have assumed that for dependent Use Cases number of scenarios will be one.
Table 1. Use Case template for “search book” use case.
Use Case ID: (1)
Use Case Name: Search book
Use Case Description: The functional requirement of searching a list of books in library management system is shown by the search book use case.
Type: Main use case
Nscenarios: 1
Initiator Vector: {L1, S1}
Trigger Vector: {nil}
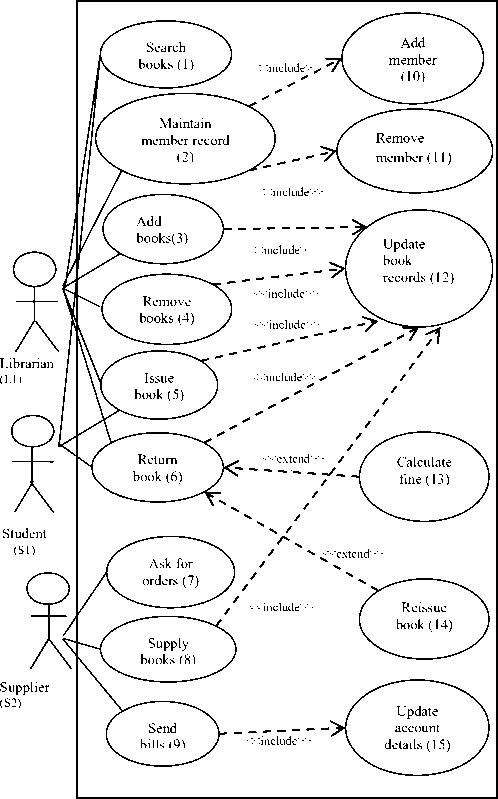
Fig.2. Use Case Diagram of Library Management System
We demonstrate the Use Case and Actor template used to document the actors and use cases with the help of one example only due to space constraints. In Library management system, search book Use Case represented in the Use Case template form is shown in table 1.
In Library management system, actor Librarian is represented in the Actor template form as follows.
Table 2. Actor template for actor “Librarian”.
Actor ID: (L1)
Actor Name: Librarian
Actor Description: Librarian is an actor which interacts with the system. It maintains the member and book records. It also issues and returns book.
Trigger Vector: Use Case {1,2,3,4,5,6}
Use Case Diagram dependencies are shown in matrices Minit an d Mtrig.
Initiator Use Case Matrix (Minit) is shown in Fig 3. Use Case 1 is initiated by actors L1 and S1 through association relationship so, row indicating Use Case 1 has entry 3 for both the columns corresponding to actors L1 and S1. Similarly Use Case 10 is initiated by Use Case 2 through include dependency so, row indicating Use Case
-
10 has entry 2 for column corresponding to Use Case 2. Use Case 13 is initiated by Use Case 6 through extend dependency so, row indicating Use Case 13 has entry 1 for column corresponding to Use Case 6. In the same way all the other entries are completed in matrix Minit.. Rows meant for actors are omitted in the matrix Minit for cases where actors do not initiate other actors. Columns meant for dependent Use Cases are omitted in M init matrix as dependent Use Cases are not initiators of other Use Cases.
Trigger Use Case Matrix (Mtrig) is shown in Fig 4. Actor L1 triggers the Use Cases 1, 2, 3, 4, 5, 6 through association relationship so, row indicating actor L1 has entry 3 for the columns corresponding to Use Cases 1, 2, 3, 4, 5, and 6 respectively. Use Case 2 is triggering Use Cases 10 and 11 through include dependency so, row indicating Use Case 2 has entry 2 for both the columns corresponding to the Use Cases 10 and 11. Use Case 6 is triggering Use Cases 13 and 14 through extend dependency and Use Case 12 through include dependency so, row indicating Use Case 6 has entry 1 for the columns corresponding to the Use Cases 13, 14 and 2 for column corresponding to Use Case 12. In the same way the matrix Mtrig is completed. Columns meant for actors are omitted in the matrix Mtrig because actors are unable to trigger other actors. Rows meant for dependent Use Cases are also omitted in the matrix Mtrig as the dependent Use Cases cannot trigger other Use Cases.
Use Case diagram TE and IE values are calculated using the formula given in section IV part C and are shown in Table 4. Complexity of the Use Case Diagram of the case study considered in this work i.e. Library management system is now the summation of CTE and CIE which is equal to 156. Since the selected case study shows requirements through single Use Case Diagram only, so the system complexity is also 156. In some other case, if a system has more than one Use Case Diagram, similar procedure may be carried out for calculating the complexity metric for each Use Case Diagram. Individual metric values thereafter may be summed to obtain the overall system complexity from the Use Case Diagram perspective.
Table 4. TE, IE for the Library management system
|
Use Case id/Actor id |
TE |
IE |
Use Case id/Actor id |
TE |
IE |
|
L1 |
30 |
0 |
8 |
2 |
3 |
|
S1 |
18 |
0 |
9 |
2 |
6 |
|
S2 |
12 |
0 |
10 |
0 |
2 |
|
1 |
0 |
6 |
11 |
0 |
2 |
|
2 |
4 |
6 |
12 |
0 |
10 |
|
3 |
2 |
3 |
13 |
0 |
1 |
|
4 |
2 |
3 |
14 |
0 |
1 |
|
5 |
2 |
12 |
15 |
0 |
2 |
|
6 |
3 |
18 |
--- |
--- |
--- |
|
7 |
0 |
3 |
--- |
--- |
--- |
|
CTE=78 |
CIE=78 |
||||
|
Actors |
Main Use Cases |
IE |
||||||||||||
|
L1 |
S1 |
S2 |
1 |
2 |
3 |
4 |
5 |
6 |
7 |
8 |
9 |
|||
|
Use Cases |
1 |
3 |
3 |
0 |
0 |
0 |
0 |
0 |
0 |
0 |
0 |
0 |
0 |
6 |
|
2 |
3 |
0 |
0 |
0 |
0 |
0 |
0 |
0 |
0 |
0 |
0 |
0 |
6 |
|
|
3 |
3 |
0 |
0 |
0 |
0 |
0 |
0 |
0 |
0 |
0 |
0 |
0 |
3 |
|
|
4 |
3 |
0 |
0 |
0 |
0 |
0 |
0 |
0 |
0 |
0 |
0 |
0 |
3 |
|
|
5 |
3 |
3 |
0 |
0 |
0 |
0 |
0 |
0 |
0 |
0 |
0 |
0 |
12 |
|
|
6 |
3 |
3 |
0 |
0 |
0 |
0 |
0 |
0 |
0 |
0 |
0 |
0 |
18 |
|
|
7 |
0 |
0 |
3 |
0 |
0 |
0 |
0 |
0 |
0 |
0 |
0 |
0 |
3 |
|
|
8 |
0 |
0 |
3 |
0 |
0 |
0 |
0 |
0 |
0 |
0 |
0 |
0 |
3 |
|
|
9 |
0 |
0 |
3 |
0 |
0 |
0 |
0 |
0 |
0 |
0 |
0 |
0 |
6 |
|
|
10 |
0 |
0 |
0 |
0 |
2 |
0 |
0 |
0 |
0 |
0 |
0 |
0 |
2 |
|
|
11 |
0 |
0 |
0 |
0 |
2 |
0 |
0 |
0 |
0 |
0 |
0 |
0 |
2 |
|
|
12 |
0 |
0 |
0 |
0 |
0 |
2 |
2 |
2 |
2 |
0 |
2 |
0 |
10 |
|
|
13 |
0 |
0 |
0 |
0 |
0 |
0 |
0 |
0 |
1 |
0 |
0 |
0 |
1 |
|
|
14 |
0 |
0 |
0 |
0 |
0 |
0 |
0 |
0 |
1 |
0 |
0 |
0 |
1 |
|
|
15 |
0 |
0 |
0 |
0 |
0 |
0 |
0 |
0 |
0 |
0 |
0 |
2 |
2 |
|
|
CIE=78 |
||||||||||||||
Fig.3. Matrix Minit for Use Case Diagram of Fig. 2
Table 3. Scenarios per Use Case for the Library management system
|
Main Use Case No. |
No. of Scenarios( assumed) |
|
1 |
1 |
|
2 |
2 |
|
3 |
1 |
|
4 |
1 |
|
5 |
2 |
|
6 |
3 |
|
7 |
1 |
|
8 |
1 |
|
9 |
2 |
|
Main Use Cases |
Dependent Use Cases |
TE |
|||||||||||||||
|
1 |
2 |
3 |
4 |
5 |
6 |
7 |
8 |
9 |
10 |
11 |
12 |
13 |
14 |
15 |
|||
|
Actors |
L1 |
3 |
3 |
3 |
3 |
3 |
3 |
0 |
0 |
0 |
0 |
0 |
0 |
0 |
0 |
0 |
30 |
|
S1 |
3 |
0 |
0 |
0 |
3 |
3 |
0 |
0 |
0 |
0 |
0 |
0 |
0 |
0 |
0 |
18 |
|
|
S2 |
0 |
0 |
0 |
0 |
0 |
0 |
3 |
3 |
3 |
0 |
0 |
0 |
0 |
0 |
0 |
12 |
|
|
Use Cases |
1 |
0 |
0 |
0 |
0 |
0 |
0 |
0 |
0 |
0 |
0 |
0 |
0 |
0 |
0 |
0 |
0 |
|
2 |
0 |
0 |
0 |
0 |
0 |
0 |
0 |
0 |
0 |
2 |
2 |
0 |
0 |
0 |
0 |
4 |
|
|
3 |
0 |
0 |
0 |
0 |
0 |
0 |
0 |
0 |
0 |
0 |
0 |
2 |
0 |
0 |
0 |
2 |
|
|
4 |
0 |
0 |
0 |
0 |
0 |
0 |
0 |
0 |
0 |
0 |
0 |
2 |
0 |
0 |
0 |
2 |
|
|
5 |
0 |
0 |
0 |
0 |
0 |
0 |
0 |
0 |
0 |
0 |
0 |
2 |
0 |
0 |
0 |
2 |
|
|
6 |
0 |
0 |
0 |
0 |
0 |
0 |
0 |
0 |
0 |
0 |
0 |
2 |
1 |
1 |
0 |
4 |
|
|
7 |
0 |
0 |
0 |
0 |
0 |
0 |
0 |
0 |
0 |
0 |
0 |
0 |
0 |
0 |
0 |
0 |
|
|
8 |
0 |
0 |
0 |
0 |
0 |
0 |
0 |
0 |
0 |
0 |
0 |
2 |
0 |
2 |
0 |
2 |
|
|
9 |
0 |
0 |
0 |
0 |
0 |
0 |
0 |
0 |
0 |
0 |
0 |
0 |
0 |
0 |
2 |
2 |
|
|
CTE=78 |
|||||||||||||||||
Fig.4. Matrix Mtrig for Use Case Diagram of Fig.2
-
V. Theoretical Validation Of Metric
The usefulness of the complexity metric discussed in this work is acceptable only when it is validated. Several approaches for validation of complexity metrics by Briand [7], Weyuker [34], Yin [36], Zhou [38] are present in the literature. In this section we will describe theoretical validation of our proposed Use Case Diagram metric [33] using Briand’s framework properties of which are shown in Table 5.
Table 5. Briand’s Framework properties [7]
|
Property No. |
Property Description |
|
#1 |
Non Negativity |
|
#2 |
Null Value |
|
#3 |
Symmetry |
|
#4 |
Module Monotonicity |
|
#5 |
Disjoint Module Additivity |
Briand’s Framework [7] provides theoretical basis for software measurement and has the following concepts:
System and Modules:
A system ‘S’ is defined as a pair
Considering system S as
Elements of the ‘system’ are Actors and Use Cases described by the attributes existing in these ‘elements’.
Relations are present between actors and Use Cases, also among Use Cases.
The proposed Use Case Diagram complexity metric described in section IV is theoretically validated for Briand’s framework of five properties shown in Table 5 and is discussed as follows:
Property #1 Non Negativity: For the system S=
The complexity of the system i.e. Use Case diagram in the proposed work is calculated by assigning weights to the association and dependency relationships which are always positive, therefore the complexity cannot be negative and is always positive.
Property #2 Null Value:
For the system, S=
The complexity in the proposed work is calculated by assigning weights to the association and dependency relationships. If no relationships exist in the Use Case diagram then R is null so, complexity of the system called S will also be nil.
Property #3 Symmetry:
For the system, S=
Complexity (S) = Complexity (S-1)
The complexity measure in the proposed work is not sensitive to relationship direction. It is not dependent on the convention used to depict the relationships. Therefore the complexity measure will continue to remain unchanged regardless of the convention followed.
Property #4 Module Monotonicity:
The complexity of the system S=
Complexity (S) ≥ [Complexity (S 1 ) + Complexity (S 2 )]
To illustrate this property we consider a Room reservation system shown in Fig. 5 having two subsystems User U1 and its Use Cases, and Manager M1 and its Use Cases. Complexity of U1 and M1 is 32 each. Sum of the complexity of these two sub systems is 64 which is equal to the complexity of Room reservation system. Therefore, the proposed work fulfills condition for property #4.
Property #5 Disjoint Module Additivity:
For the system S=
Complexity(S) = [Complexity (S 1 ) + Complexity (S 2 )]
Use Case metric does satisfy property #5. This can be explained through example of the Room reservation system shown in Fig. 5. Complexity of both the subsystems U1 and M1 is 32. Sum of the complexity of these two sub systems is 64. This is equal to the complexity of Room reservation system which is 64. Hence, the complexity of Room reservation system is sum of its two sub systems.
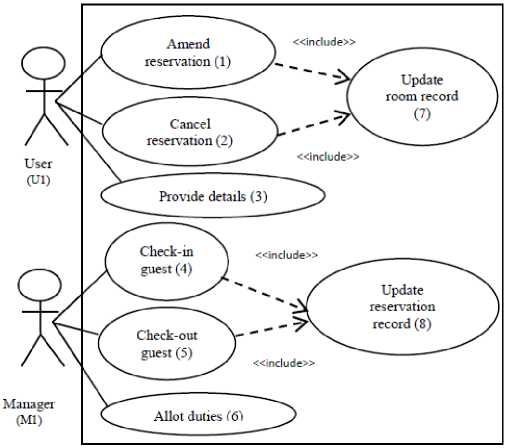
Fig.5. Use Case Diagram for Room Reservation System
Table 6. No. of Scenarios for each Use Case for Room Reservation System
|
Main Use Case |
Number of Scenarios ( assumed) |
|
1 |
2 |
|
2 |
1 |
|
3 |
1 |
|
4 |
1 |
|
5 |
1 |
|
6 |
2 |
From above discussion it is concluded that the Use Case Diagram metric satisfies all the properties recommended by Briand [7]. Therefore we can also conclude that the proposed complexity metric is theoretically sound and also satisfies construct validity criteria.
-
VI. Empirical Validation
We have investigated the relationship between Use Case Diagram complexity metric and Use Case Diagram understandability. A controlled experiment was performed to show the empirical validity of the proposed metric and is discussed in this section. Following steps were taken to perform the experiment:
-
(1) The goal of the experiment is built from the GQM template [44].
-
(2) Controlled Experiment is performed starting with hypothesis formulation.
-
(3) Variable selection i.e. dependent variable and
independent variables are selected.
-
(4) Data collection is done that includes selection of subjects and selection of objects.
-
(5) Data analysis technique is described along with the experiment results.
-
A. Controlled Experiment Description
In this section, empirical validation of the proposed metric carried out through controlled experiments, is presented. Controlled experiments help us to formulate hypothesis and provide insight into the relationships among different variables and also help us to measure the relationship among the variables [35]. Controlled experiment involves hypothesis construction, variable identification and categorization, data collection, implementing analysis technique and finally the results.
Table 7. Goal of the controlled experiment
|
Analyze |
Use Case Diagram Structural Complexity |
|
For the purpose of |
Evaluation |
|
With respect to |
How effectively the Metric can be used as Understandability indicator of Use Case Diagram |
|
From the point of view |
Information Systems designer |
|
In the context of |
M.Tech, B.Tech students of Information Systems and Information Technology Department, NSIT, Delhi University |
Controlled experiment was performed by following suggestions provided by Briand et al. [11, 12]. GQM template given in [44] was also followed for the goal definition of this controlled experiment shown in table 7.
-
B. Construct Hypothesis
Identification and definition of hypothesis is important for any empirical study. It specifies what aspects of the research problem need to be investigated. Hypothesis constructed for the proposed work is as follows:
Hypothesis: Significant correlation is there between the Use Case Diagram Complexity Metric and Understandability of Use Case Diagram
Null Hypothesis: No correlation exists between the Use Case Diagram Complexity Metric and Understandability of Use Case Diagram
-
C. Variables
Variables are the focus of any study or experiment. Variables used in the proposed work are independent and dependent variables.
Independent Variable
Independent Variable or predictor variable is not changed by other variables and causes change in other/dependent variables. The independent variable in the proposed work is the Use Case Diagram Complexity metric defined in section IV.
Dependent Variable
Dependent variables depend on independent variables. In this study Understandability is the dependent variable. Empirical validation is done to examine how the independent and dependent variables are related in this study. Therefore, in this work the main aim is to study and explain the relationship between Use Case Diagram Metric with the subject’s ratings given for Understandability. High understandability of the Use Case Diagram facilitates all stakeholders to easily understand the requirements of the software to be developed and give meaningful feedback. Also, it may result in better understanding of domain requirements and finally implementation of better quality software based on these requirements.
In literature, it is found that understandability is calculated subjectively and objectively through experiments. The experiments based on subjective evaluation is done by rating understandability on a scale whereas objective evaluation is done by subjects, who performed one or more exercises on models. In our experiment, dependent variable was rated on an ordinal scale i.e. Likert Scale with range 1 to 3. Subjective rating of understandability of Use Case Diagram is given by the subjects according to their thinking and viewpoint. Therefore dependent variable is the perceived Use Case Diagram understandability.
-
D. Data collection
Data collection is an important part of controlled experiment performed to find relation between the dependent and independent variable.
Objects
Twenty-six Use Case Diagrams from easy to understand domains were collected and controlled experiment was conducted. Use Case Diagrams were having variations in the metric value as they were from different domains from student projects done in the Computer Engineering Department and Information Technology Department of NSIT.
Subjects
The subjects in our work were the students of under graduate and post graduate course. It is observed in literature that in many empirical studies, the experiments were conducted using Students as subjects [35]. As actual industrial studies require a lot of time, resources and experts of the field, pilot studies are carried out by researchers with students as subjects in Universities.
Table 8. Scale used
|
Simple and easily understandable |
Moderately understandable |
Difficult to understand |
|
1 |
2 |
3 |
-
E. Data Analysis Technique and Experimental Results
Data collected and summarized for each Use Case Diagram is shown in table 9. Metric value for all Use Case Diagrams is given along with the Understandability. This section describes the analysis done on data and methodologies used to study the correlation with reference to the independent and dependent variables of this experiment. For testing the hypothesis proposed in section VI Statistical Correlation and Regression techniques were used with the help of SPSS statistical tool. These techniques are suitable and are found useful to investigate the relationship between dependent variable i.e. understandability and independent variable i.e. Use Case Diagram Metric, in this work.
Correlation Technique and Results
Correlation technique measures the relationship between dependent and independent variable in the study. To evaluate the correlation between variables, the significance of the correlation needs to be calculated. The significance value calculated for each correlation is indicator of accuracy of the correlation. Correlation coefficient measures association between two variables, and has ranges from –1 and 1. We have measured three types of correlations in this study: Pearson correlation, Kendall’s Tau and Spearman Rho. The data set considered for the study was small, therefore in this study, parametric as well as non-parametric tests were done to avoid assumptions about the data normality.
Table 9. Collected Data
|
Use Case Diagram no. |
Use Case Metric value |
Understandability rating |
Use Case Diagram no. |
Use Case Metric value |
Understandability rating |
|
1 |
156.00 |
2 |
14 |
106.00 |
2 |
|
2 |
109.00 |
2 |
15 |
126.00 |
3 |
|
3 |
100.00 |
2 |
16 |
174.00 |
3 |
|
4 |
132.00 |
3 |
17 |
123.00 |
2 |
|
5 |
131.00 |
3 |
18 |
92.00 |
1 |
|
6 |
64.00 |
1 |
19 |
114.00 |
2 |
|
7 |
100.00 |
2 |
20 |
70.00 |
1 |
|
8 |
59.00 |
1 |
21 |
90.00 |
2 |
|
9 |
98.00 |
2 |
22 |
100.00 |
2 |
|
10 |
80.00 |
2 |
23 |
59.00 |
1 |
|
11 |
66.00 |
1 |
24 |
98.00 |
2 |
|
12 |
76.00 |
2 |
25 |
80.00 |
2 |
|
13 |
121.00 |
2 |
26 |
66.00 |
1 |
Table 10 gives the results showing the implementation of correlation analysis on the data i.e. Use Case Metric and Understandability of the Use Case Diagram. Parametric correlation is based on Pearson correlation and non-parametric correlation is performed by means of Kendall’s Tau and Spearman Rho. The coefficient values are given in table 10.
Table 10. Correlation with Understandability
|
Understandability |
Kendall’s Tau |
Spearman’s Rho |
Pearson Correlation |
|
Use Case Metric |
0.723 |
0.832 |
0.798 |
The Use Case Diagram Complexity Metric has positive correlation with understandability at the significance level of <0.05 as shown in the table. The correlation value ranges between 0.723 and .832 which is between +1 and -1. Therefore, we accept the hypothesis stated in section VI part B and discard the null hypothesis.
Ordinal Regression Technique and Results
Regression is a statistical measure or technique to determine strength of relationship between dependent and independent variables. For predicting an ordinal variable, a type of regression analysis called Ordinal regression is used. Ordinal regression is implemented to predict an ordinal dependent variable when one or more independent variables are known.
In this work the dependent variable i.e. understandability was rated on a scale as ordinal categorical variable. Ordinal regression was used in this study as the dependent variable was not continuous but categorical as well as ordinal. Therefore, Ordinal regression technique was selected to investigate the relationship among the independent variable Use Case Diagram Metric and dependent variable
Understandability in this study. To evaluate the predictive model performance accuracy is used. Accuracy is the measure of the percentage of correct predictions. Accuracy is defined as:
Accuracy= (correct prediction/total number of Use Case Diagrams to be predicted)* 100
Popularly used significance level of 0.05 is chosen for hypothesis testing in our work.
Ordinal regression based Model fitting information is shown in table 11. Chi square statistic at the significance level of <0.05 indicates that the final model provides evident rise over the baseline intercept-only model. Therefore, improved predictions are provided by the model when it is combined with predictor Use Case Diagram metric.
Table 11. Model fitting information
|
Model |
-2 Log Likelihood |
Chi-Square |
df |
Sig. |
|
Intercept Only Final |
49.846 23.975 |
25.872 |
1 |
.000 |
Link Function: Logit
Table 12. Parameter estimates
|
Estimate |
Std. Error |
Sig. |
|
|
Threshold [VAR1 = 1.00] |
9.262 |
3.152 |
0.003 |
|
[VAR1 = 2.00] |
15.888 |
4.895 |
0.001 |
|
Location |
0.120 |
0.039 |
0.002 |
In table 12 the parameter estimates are shown. Positive values of Use Case Diagram metric coefficient estimate show that large value of the metric increases the probability of higher rating for understandability and accept the hypothesis stated in section VI part B and discard the null hypothesis. This is indicated by the significance level=0.00 which is less than 0.05.
The Classification results are shown in table 13. The accuracy of the regression model is about 88% and this value significantly supports the investigation that the Use Case Diagram metric is capable of predicting understandability of Use Case Diagram.
Table 13. Classification results
|
Predicted response category |
||||
|
Expected Understandability |
1 |
2 |
3 |
|
|
1 |
6 |
0 |
0 |
|
|
2 |
1 |
14 |
1 |
|
|
3 |
0 |
1 |
3 |
|
Significant correlation exists between complexity metric derived on the basis of Use Case Diagram and the subject’s/participant’s rating of the understandability of the diagram. Understandability can be taken as objective indicator for the quality attribute. Therefore we accept the proposed hypothesis and reject the null hypothesis.
-
VII. Validity Evaluation
In this section we discuss factors that act as threats to the validity of the empirical study that was performed and presented in this paper. Different measures taken to reduce their effects are also mentioned in this section.
Construct validity- Construct validity denotes the degree to which a test measures, what it claims to be measuring. Also, it shows whether the variables selected here actually measure the concepts they intend to quantify. In this study, Use Case Diagram metric was taken as the independent variable whose construct validity was shown by means of theoretical validation done using Briand’s framework [7]. Subjective assessment for the dependent variable was conducted through the use of Likert’s Scale. Subjective assessment in this work is based on subject’s intellect and perspective, and may act as a risk to construct validity of the dependent variable. For deeper understanding we need to perform more experiments in future.
Internal validity- Lack of Knowledge of the domain may act as a threat to the internal validity in controlled experiments. The Use Case Diagrams selected for this work were from different domains and were simple and general. Therefore, selected Use Case Diagrams were easily understood by the subjects. We selected Use Case Diagrams with sufficient variation in the metric values of different diagrams. The subjects were given a brief explanation about the domain also. Therefore, the domain knowledge does not act as a threat to the internal validity in this work.
To eliminate learning effects, tests were given in no particular order to the student subjects. To reduce possibility of fatigue effect, the subjects were given sufficient time to perform the tests. The subjects were the students of UG and PG courses who had prior knowledge of software engineering, data modeling and data base courses, but performed this kind of experiment for the first time. So, another threat to internal validity called persistence effect was also avoided. There was voluntary participation of the students in this research. The subjects were asked to perform this exercise individually without discussing among them.
External validity- To transform an approach to real software engineering practice, greater external validity is required. In this study a collection of Use Case Diagrams which are prototype models of the real problems were used to perform the experiments. But more elaborate empirical studies are required on the real problems to establish this approach as a software engineering practice. Also, experiments with professionals and practitioners with larger real life problems must be done in order to make this approach widely acceptable. However, as this was a simple experiment which did not require great expertise, students performing this experiment were found sufficient.
Conclusion validity- Conclusion validity may be established by replicating this study and experiments with professionals and practitioners with larger real life problems.
-
VIII. Conclusions and Future Work
Validation of the proposed Use Case Diagram complexity metric [33] is performed empirically through controlled experiments in this paper. Data analysis is done through statistical correlation and ordinal regression techniques. Results show that the metric is strongly related and associated to the understandability of the Use Case Diagram. Ordinal regression based model accuracy is 88%, which is considerably high. Therefore, we are able to conclude that the Use Case Metric is objective indicator for the quality attribute understandability.
The theoretical validation of the proposed Use Case Diagram metric [33] is done using Briand’s framework in order to prove theoretical soundness of the metric, and to be categorized as complexity metric. All the properties of the Briand’s framework are satisfied by the proposed metric. Therefore we can conclude that the proposed Use Case Diagram metric [33] is empirically and theoretically validated.
We understand that this kind of experiment is giving us preliminary results. Replicating this study and experiments with professionals and practitioners with larger real life problems in a more controlled environment is required in future to further support the empirical evaluation and conclusions.
In future, work will also be done to enhance the Use Case Diagram metric by incorporating more attributes. We would also like to investigate in more depth the work presented here by validating the metric for Distance Framework given by Poels and Dedene. We also propose to extend this approach for the estimation of maintenance and testing effort.
References Empirical and theoretical validation of a use case diagram complexity metric
- B. Anda, D. Sjoberg, M. Jorgensen. 2001 Quality and Understandability of Use Case Models. In Proceedings of ECOOP 2001 European Conference, Springer-Verlag, London, 402-428. DOI: 10.1007/3-540-45337-7_21
- B. Anda, H. Dreiem, D. Sjoberg, M. Jorgensen. 2001. Estimating Software development Effort based on Use Cases-Experiences from Industry. The Unified Modeling Language. Modeling Languages, Concepts, and Tools. Lecture Notes in Computer Science Vol. 2185, 487-502. DOI: 10.1007/3-540-45441-1_35
- A. Albrecht. Measuring Application Development Productivity. 1979. In Proceedings of Proceedings of IBM Application Development Symposium.
- V.R. Basili, L. Briand, W. Melo. 1996. Validation of Object-Oriented Design Metrics as Quality Indicators.IEEE Transactions on Software Engineering, Vol. 22, No. 10, 751-761. DOI: 10.1109/32.544352
- V.R. Basili.2007. Role of Controlled Experiments in Software Engineering Research. Empirical Software Engineering Issues, LNCS 4336, Springer-Verlag, Berlin, 33-37. DOI: 10.1007/978-3-540-71301-2_10
- G. Booch, I. Jacobson, J.Rumbaugh. 2001. The Unified Modeling Language User Guide. Addison Wesley. ISBN:978-0321267979
- L. Briand, S. Morasca, V. Basili. 1996. Property Based Software Engineering Measurement. IEEE Transactions on Software Engineering. Vol. 22, issue 1, 68-86. DOI: 10.1109/32.481535
- L. Briand, S. Morasca, V. Basili. 1997. Response to: Property Based Software Engineering Measurement: Refining additive Properties. IEEE Transactions on Software Engineering. Vol. 23, issue 3,196-197. DOI: 10.1109/TSE.1997.585509
- L. Briand, J. Wust, S. IkoNomovski, H. Lounis. 1999. Investigating Quality Factors in Object-Oriented Designs: an Industrial Case Study. In Proceedings of 21st International Conference on Software Engineering, CA, 345-354. DOI: 10.1145/302405.302654
- L. Briand, J. Wust. 2002. Empirical Studies of Quality Models in Object-Oriented Systems. Advances in Computers, Vol. 59, Academic Press, 97-166. DOI: 10.1016/S0065-2458(02)80005-5
- R. Brito, F. Carapuça. 1994. Object-Oriented Software Engineering: Measuring and controlling the development process. In Proceedings 4th Interntional Conference on Software Quality, US, 1-8.
- D. N. Card, W. W. Agresti. 1988. Measuring Software Design Complexity. The Journal of Systems and Software. Elsevier Science Inc, 185-197.
- S. Cherfi, J. Akoka, I. Wattiau. 2006. Use Case Modeling and Refinement: A Quality-Based Approach. In Proceedings 25th International Conference on Conceptual Modeling, 84-97. DOI: 10.1007/11901181_8
- J.K Chhabra, K. K. Aggrawal, Y. Singh.2003 Code and Data Spatial Complexity: Two Important Software. Information and Software Technology, Elsevier Science, Vol. 45, 539-546. DOI: 10.1016/S0950-5849(03)00033-8
- S. Chidamber, C.Kemerer. 1994. A Metric Suite for Object Oriented Design. IEEE Transactions on Software Engineering, Vol. 20, No. 6, 476-493. DOI: 10.1109/32.295895
- B. Douglass.2004 Computing Model Complexity. Borland: White Paper, I-Logix.
- N. Fenton, M. Neil. 2000. Software Metrics: Roadmap. In Proceedings of International Conference on Software Engineering. Ireland, 357-370. DOI: 10.1145/336512.336588
- M. Georgiades, S. Andreou.2012. Formalizing and Automating Use Case Model Development. The Open Software Engineering Journal, Vol. 6, 21-40. DOI: 10.2174/1874107X01206010021
- M. Genero, G. Poels, M. Piattini. 2007. Defining and Validating Metrics for Assessing the Understandability of Entity-Relationship Diagrams. Data and Knowledge Engineering Elsevier Journal, Vol. 64, 534-557. DOI 10.1016/j.datak.2007.09.011
- M. Halstead.1977. Elements of Software Science. Elsevier- Science Inc. New York, USA. ISBN:0444002057
- B. Henderson-Sellers, D. Zowghi, T. Klemola, S. Parasuram. 2002 Sizing Use Cases: How to Create a Standard Metrical Approach. In Proceedings of 8th International Conference on Object-Oriented. Information Systems. 409-421. DOI: 10.1007/3-540-46102-7_43
- S. Henry, D. Kafura. 1981. Software Structure Metrics Based on Information Flow. IEEE Transactions. Software Engineering, Vol. 7, 510-518. DOI: 10.1109/TSE.1981.231113
- C. Kaner and W. Bond. 2004. Software Engineering Metrics: What Do They Measure and How Do We Know? In Proceedings of 10th International Software Metrics Symposium, METRICS, 1-12.
- D. Kang, B. Xu, J. Lu, W. Chu. 2004. Complexity Measure for Ontology Based on UML. In Proceedings of IEEE, Workshop on Future Trends of Distributed Computing, 222-228. DOI: 10.1109/FTDCS.2004.1316620
- N. Khanahmadliravi, H. R. Khataee. 2012. Estimating Quality of an Object Oriented Software System Using Graph Algorithm. International Journal of Computer and Electrical Engineering, Vol. 4, No. 4, 467-470.
- M. Lorenz, J. Kidd. 1994. Object-Oriented Software Metrics: A Practical Guide. Englewood Cliffs, New Jersey - USA. 1994. ISBN-13: 978-0131792920
- M. Marchesi. 1998. OOA Metrics for the Unified Modeling Language. In Proceedings of Euromicro Conference on Software Maintenance and Reengineering, 67-73. DOI: 10.1109/CSMR.1998.665739
- T. J. McCabe. 1976. A Complexity Measure. IEEE Transactions on Software Engineering, Vol. 2, 308-320. DOI :10.1109/TSE.1976.233837
- C. L. McClure. 1978. A Model for Program Complexity Analysis. In Proceedings of 3rd international conference on Software Engineering, 149-157.
- H. Nelson, G. Poels, M. Genero. 2012. A Conceptual Modeling Quality Framework. Software Quality Journal, Vol. 20, 201-228. DOI: 10.1007/s11219-011-9136-9
- S. Singh, S. Sabharwal, J. Gupta.2009. Events-An Alternative to Use Case as starting point in Object- Oriented Analysis. In Proceedings of 2nd International Conference on Emerging Trends in Engineering & Technology, USA, 1004-1010. DOI: 10.1109/ICETET.2009.94
- S. Singh, S. Sabharwal, J. Gupta. 2011. Deriving System Complexity Metric from Events and its Validation. International Journal of Software Engineering and Knowledge Engineering, Vol. 21, No. 8, 1097-1121. DOI: 10.1142/S021819401100561X
- S. Sabharwal, R. Sibal, P. Kaur P.2014. Deriving Complexity Metric Based on Use Case Diagram and its Validation. In Proceedings of IEEE ISSPIT. DOI: 10.1109/ISSPIT.2014.7300571
- E. J. Weyuker.1998. Evaluating Software Complexity Measures. IEEE Transactions on Software Engineering, Vol. 14, No. 9. 1357 – 1365. DOI: 10.1109/32.6178
- Y. Yavari, M. Afsharchi, M. Karami. 2011. Software Complexity Level Determination Using Software Effort Estimation Use Case Points Metrics. In Proceedings of 5th Malaysian Conference in Software Engineering, 257-262. DOI: 10.1109/MySEC.2011.6140680
- B. H Yin, J. W. Winchester. 1978. The Establishment and Use of Measures to Evaluate the Quality of Software Designs. In Proceedings of Software Quality Assurance Workshop on Functional and Performance, New York – USA. 45-52. DOI: 10.1145/800283.811099
- Z. Yuming, X. Baowen. 2003. Measuring Structural Complexity of UML Class Diagrams. Journal of Electronics. Vol. 20. No.3, 227-231. DOI: 10.1007/BF02687710
- Y. Zhou, B. Xu. 2005. Measuring Structural Complexity for Class Diagram: An Information Theory Approach. In Proceedings of 5th ACM Symposium on Applied Computing, USA, 1679-1683. 10.1145/1066677.1067057
- R. Hurlbut. 1997. A Survey of Approaches for Describing and Formalizing Use Cases. Technical Report: XPT-TR-97-03, Expertech Ltd.
- B. Anda, D. Sjoberg, M. Jorgensen. 2002. Towards an Inspection Technique for Use Case Models. In Proceedings of SEKE 2002, 127-134. 10.1145/568760.568785
- A. Sellami. and H. Ben-Abdallah. 2009. Functional Size of Use Case Diagrams: A Fine –Grain Measurement. In Proceedings of 4th International Conference on Software Engineering Advances, 282-28, 2009. DOI: 10.1109/ICSEA.2009.96
- M. Genero. 2001. Using Metrics to Predict OO Information Systems Maintainability. Lecture Notes in Computer Science vol. 2068, 388-401. ISBN:3-540-42215-3
- G. Krishna, R. Mall. 2010. Model- Based Software Reliability Prediction. Information Systems, Technology and Management Communications in Computer and Information Science, Vol. 54, 145-155. DOI: 10.1007/978-3-642-12035-0_15
- V. R. Basili and H. D. Rombach. 1988. The TAME Project: Towards Improvement-Oriented Software Environments. IEEE Transactions on Software Engineering, Vol. 14, No. 6, 758-773, DOI: 10.1109/32.6156
- J. Chhabra, V. Gupta. 2009. Evaluation of Code and Data Spatial Complexity Measures. In Proceedings of Contemporary Computing. IC3 2009. Communications in Computer and Information Science, Springer, Berlin, Heidelberg Vol. 40. 604-614. DOI: 10.1007/978-3-642-03547-0_57
- G. Karner. 1993. Metrics for Objectory. Diploma Thesis, University of Linkoping, Sweden.
- Mohammad D. Aljohani, M. Rizwan J. Qureshi. 2016. Management of Changes in Software Requirements during Development Phases. International Journal of Education and Management Engineering(IJEME), Vol.6, No.6, pp.12-26, 2016.DOI: 10.5815/ijeme.2016.06.02
- S. Koussoube, A. Ayimdji, L.P. Fotso. An Ontology-Based Approach for Multi-Agent Systems Engineering.2013. International Journal of Education and Computer Science, Vol. 1, 42-55 DOI: 10.5815/ijmecs.2013.01.06
- A. Abran. 2003. COSMIC Measurement Manual-Version 3.0. The COSMIC Implementation Guide for ISO/IEC 19761. Retrieved from www.cosmicon.com/portal/public/mm4.pdf
- Lauretta O. Osho, Muhammad B. Abdullahi, Oluwafemi Osho. 2016. Framework for an E-Voting System Applicable in Developing Economies. International Journal of Information Engineering and Electronic Business (IJIEEB), Vol.8, No.6, pp.9-21, 2016. DOI: 10.5815/ijieeb.2016.06.02
- B. W. Boehm, J. R. Brown, and M. Lipow. 1976. Quantitative Evaluation of Software Quality. In Proceedings of 2n International Conference on Software Engineering, San Francisco, California, United States. 592–605.
