Energy Detection Performance of Spectrum Sensing in Cognitive Radio

Author: Md. Shamim Hossain, Md. Ibrahim Abdullah, Mohammad Alamgir Hossain
Journal: International Journal of Information Technology and Computer Science(IJITCS) @ijitcs
Article in issue: 11 Vol. 4, 2012.
Free access
Spectrum sensing is a challenging task for cognitive radio. Energy detection is one of the popular spectrum sensing technique for cognitive radio. In this paper we analyze the performance of energy detection technique to detect primary user (PU). Simulation results show that the probability of detection increases significantly when signal to noise ratio increases. It is also observed that the detection probability decreases when the bandwidth factor increases.
Cognitive Radio, Spectrum Sensing, Energy Detection
Short address: https://sciup.org/15011777
IDR: 15011777
Text of the scientific article Energy Detection Performance of Spectrum Sensing in Cognitive Radio
Published Online October 2012 in MECS
Cognitive radio (CR) technology is a new way to compensate the spectrum shortage problem of wireless environment. It enables much higher spectrum efficiency by dynamic spectrum access [1]. It allows unlicensed users to utilize the free portions of licensed spectrum while ensuring no interference to primary users’ transmissions. Cognitive radio arises to be tempting solution to the spectral congestion problem by introducing opportunistic usage of the frequency bands that are not heavily occupied by licensed users [2], [3]. FCC define cognitive radio [4] as, "A radio or system that senses its operational electromagnetic environment and can dynamically and autonomously adjust its radio operating parameters to modify system operation, such as maximize throughput, mitigate interference, facilitate interoperability, access secondary markets''. Hence, one main aspects of cognitive radio is related to autonomously exploiting locally unused spectrum to provide new paths to spectrum access. In cognitive radio terminology, PU can be defined as the user who has license to use a specific part of the spectrum. On the other hand, secondary users (SU) or CR users do have license to use the spectrum but can use the spectrum when PU is absent. When PU is present CR user shift its transmission to another frequency or changes other modulation parameters and never causes interference to primary users. Therefore, SUs need to have cognitive radio capabilities, such as sensing the spectrum reliably to check whether it is being used by a PU and to change the radio parameters to exploit the unused part of the spectrum. Spectrum sensing [5] is the most important task among others for the establishment of CRs because they need to sense the spectrum band for a spectrum hole [5-9], decide to use the spectrum band or not. A number of different techniques have been proposed for identifying the presence of the PU signal transmission. The existing spectrum sensing techniques can be broadly divided into three categories [6]: energy detection, matched filter detection, and cyclostationary detection. Matched filter [6][7], energy detection [11][12] and cyclostationary detection [8] are widely used techniques as detection techniques. Among them, energy detection has been widely applied since it does not require any a priori knowledge of the primary signals and has much lower complexity than the other two schemes. In addition, it does not need any prior information about the PUs' signals. Therefore, it has been thoroughly studied both in local spectrum sensing [8-12]. In this paper we studied energy detection technique to view its performance in sensing.
This paper is organized as follows: Section 2 explains the system model. Section 3 describes simulation result and discussion. And finally conclusion is drawn in section 4.
-
II. System Model
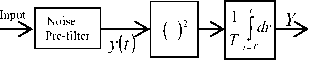
Throughout this letter, we assume that energy detection [11] is applied at each CR user (fig.1). The energy detector consists of a square law device followed by a finite time integrator. The output of the integrator at any time is the energy of the input to the squaring device over the interval T. The noise prefilter serves to limit the noise bandwidth; the noise at the input to the squaring device has a band-limited, flat spectral density.
where
. / x sin (nx)sin c (x ) = —-—- п and
One can easily check that n i ~ N ( 0, N 01 W ) , for all i.
Using the fact that [14]
Squaring
Device Integrator
t
Fig. 1: Energy Detection
co j sin c(2Wt - i)sin c(2Wt - k)dt = 1/2W, i = k
-o
= 0, i ^ k (4)
We may write
The detection [11] is a test of the following two hypotheses
H 0 : The input y ( t ) is noise alone:
a) У (t ) = n (t) b) E [n(t )] = 0 c) noise spectral density = N02, (two-sided) d) noise bandwidth = W cycles per second.
H 1 : The input y ( t ) is signal plus noise :
-
a) У(t ) = n(t) + 5 (t)
-
b) E [ n ( t )+ 5 ( t )] = 5 ( t )
o 1 № f n2 (t) dt = yn2
1 W 2W^ i
Over the time interval ( 0, T ) , n ( t ) the noise energy can be approximated by a finite sum of 2 TW terms as
2 TW
n(t) = ^ n sin c(2Wt - i), 0 < t < T i=1
Similarly, the energy in a sample of duration approximated by 2 TW terms of the right-hand side:
T 2 u
j n " (t) dt = ^E ni
0 2 W i = 1
T is
The received signal r ( t ) takes the form r ( t ) = h 5 ( t ) + n ( t )
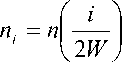
where u = TW . We assume that T and W are chosen to restrict u to integer values. If we define
'
ni
ni
where h =0 or 1 under hypotheses 0 or H 1 , respectively. The received signal is first pre-filtered by an ideal bandpass filter with transfer function [12] [13]
N01W
2
N where 01 =one-sided noise power spectral density.
then, the test or decision statistic Y can be written as
H (f) = ^

0
I f - fd ^ W, I f - fd > W,
2 u
Y = Z n- i=1
to limit the average noise power and normalize the noise variance. The output of this filter is then squared and integrated over a time interval T to finally produce a measure of the energy of the received waveform. The output of the integrator denoted by Y will act as the test H statistic to test the two hypotheses 0 and H1 . According to the sampling theorem, the noise process [14] can be expressed as
№
n ( t ) = ^ n sin c ( 2Wt - i )
i =-o
Y can be viewed as the sum of the squares of 2 u standard Gaussian variates with zero mean and unit variance. Therefore, Y follows [12] a central chi-square ( x distribution with 2 u degrees of freedom. The same approach is applied when the signal 5 ( t ) is present with the replacement of each n i by n i + 5 i
( i )
5i = 51 I where y 2W '. The decision statistic Y in this case will have a noncentral x2 distribution with 2u degrees
of freedom and a non-centrality parameter
.
Following the short-hand notations mentioned in the
beginning of this section, we can describe the decision statistic as
Y
X 2 u
X-u u2 (2/)
H 0
H 1
I X
Г I u,
2
Pf r(u)
,
Hence,
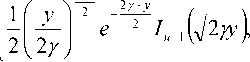
The probability density function (PDF) [11] of Y can then be written as
Pd = Qu (727,77)
.
u-1 e ~2
fY (У ) =
2 u Г ( u )
u - 1
y
H 0
H 1
^
Y =2^„ where n
ratio [20] (SNR), function.
Q u
^ x
2
denotes the signal to noise is the generalized Marcum’s Q
where 1 ( . ) is the gamma function. The probability of detection and false alarm can be generally computed by [14-20]
P d = Pr ( Y > X | H 1 )
P f = Pr ( Y > X | H о )
where λ is the final threshold of the local detector to decide whether there is a primary user present. Using (11) to evaluate (13) yields [16-20]
III. Simulation Result and Discussion
All simulation was done on MATLAB version R2011a under AWGN channel. We use receiver characteristics (ROC) analysis for the signal detection theory to study the performance of the energy detector. ROC has been widely used in the signal detection theory due to the fact that it is an ideal technique to quantify the tradeoff between the probability of detection (Pd) and the probability of false alarm (Pfa).
ROC of Spectrum Sensing for Different SNR under AWGN
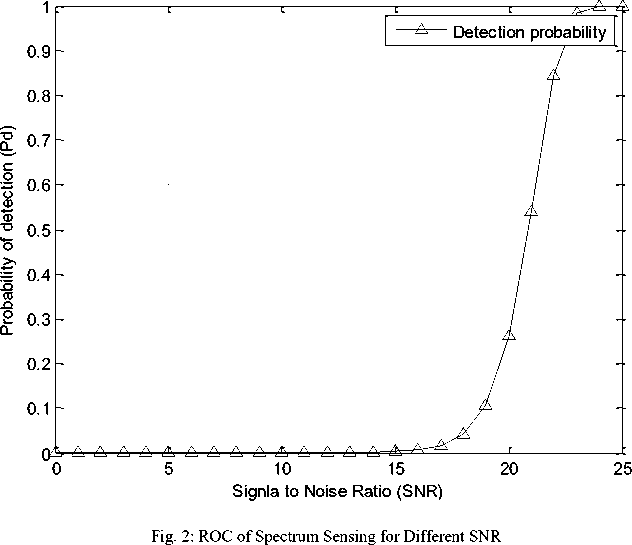
Fig.2 shows that ROC of spectrum sensing for different SNR under AWGN channel. The simulation was carried out for the analysis of detection probability under different number of SNR. Where Pfa=0.01 and time bandwidth factor u=100 were taken for this simulation. SNR was taken 0dB to 25dB and fig. 2 shows that performance of detection varies based on SNR. It also shows that with the increasing of the SNR (from 0dB to 25dB) the detection also increased and detection probability was almost zero before 15dB. The detection probability increased after the 15dB and significantly increased after 20dB and finally we get detection probability 1 when SNR is 25dB.
Table 1: Signal to noise ratio and detection probability
|
SNR |
Pd |
|
7 |
0.0001 |
|
8 |
0.0001 |
|
9 |
0.0002 |
|
10 |
0.0002 |
|
11 |
0.0004 |
|
12 |
0.0006 |
|
13 |
0.0010 |
|
14 |
0.0017 |
|
15 |
0.0033 |
|
16 |
0.0071 |
|
17 |
0.0166 |
|
18 |
0.0416 |
|
19 |
0.1070 |
|
20 |
0.2614 |
|
21 |
0.5408 |
|
22 |
0.8434 |
|
23 |
0.9826 |
|
24 |
0.9997 |
|
25 |
1.0000 |
Table 1 show the measurement of fig.2 based on SNR and detection probability. And it shows that when
SNR from SNR=22dB to 24dB, then probability of detection is approximately good.
Fig.3 shows that ROC of spectrum sensing for different SNR and time bandwidth factor under AWGN channel. Receiver operating characteristic (ROC) curves are drawn for several time-bandwidth products. From fig. 2 we saw that probability of detection is best for the signal to noise ratio from SNR=22dB to 24dB and detection is 1 for 25dB. For this again SNR from 0dB to 25dB is used for fig. 3. Where Pfa=0.01 and time bandwidth factor u is changed to 100, 500, 1000 and 2000. By changing u , it shows that probability of detection is decreases when u increases. The effect of time bandwidth factor is shown in table 2.
Table 2: Detection probability based SNR and u .
|
SNR |
U=100 |
U=500 |
U=1000 |
U=2000 |
|
15 |
0.2153 |
0.0110 |
0.0033 |
0.0012 |
|
16 |
0.4372 |
0.0263 |
0.0071 |
0.0023 |
|
17 |
0.7219 |
0.0660 |
0.0166 |
0.0047 |
|
18 |
0.9289 |
0.1648 |
0.0416 |
0.0106 |
|
19 |
0.9938 |
0.3722 |
0.1070 |
0.0260 |
|
20 |
0.9999 |
0.6782 |
0.2614 |
0.0672 |
|
21 |
1.0000 |
0.9216 |
0.5408 |
0.1727 |
|
22 |
1.0000 |
0.9948 |
0.8434 |
0.3978 |
|
23 |
1.0000 |
1.0000 |
0.9826 |
0.7209 |
|
24 |
1.0000 |
1.0000 |
0.9997 |
0.9477 |
|
25 |
1.0000 |
1.0000 |
1.0000 |
0.9981 |
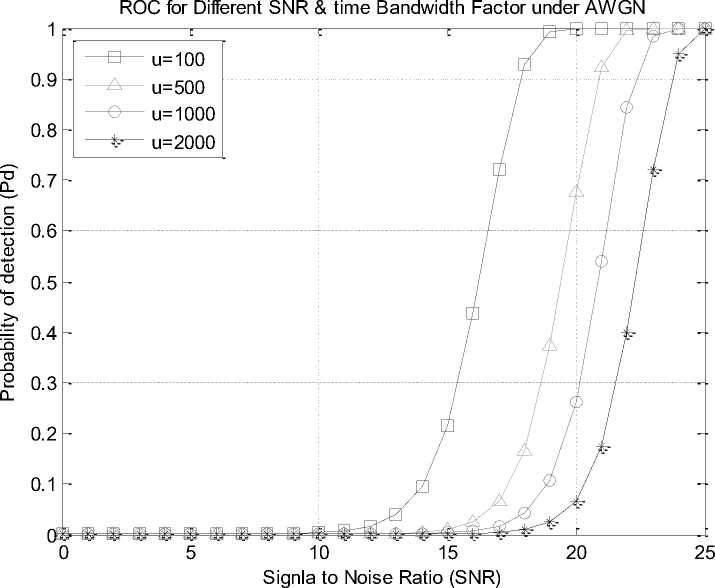
Table 2 shows only SNR from 15dB to 25dB and u =100, 500, 1000 and 2000. It shows that when u =100, SNR from 17dB to 20dB is approximately good. When SNR is 21dB to 25dB, then detection probability is 1. In the case of u =500, then SNR from 20dB to 22dB is approximately good. When SNR is 23dB to 25dB, then detection probability is 1. In the case of u =1000, then
SNR from 21dB to 24dB is approximately good and when SNR is 25dB, then probability of detection is 1. Again in the case of u =2000 and SNR =25dB, the detection probability is almost good. So when the time bandwidth factor is increasing, the probability of detection is decreasing. It also shows that SNR=25dB is approximately good.
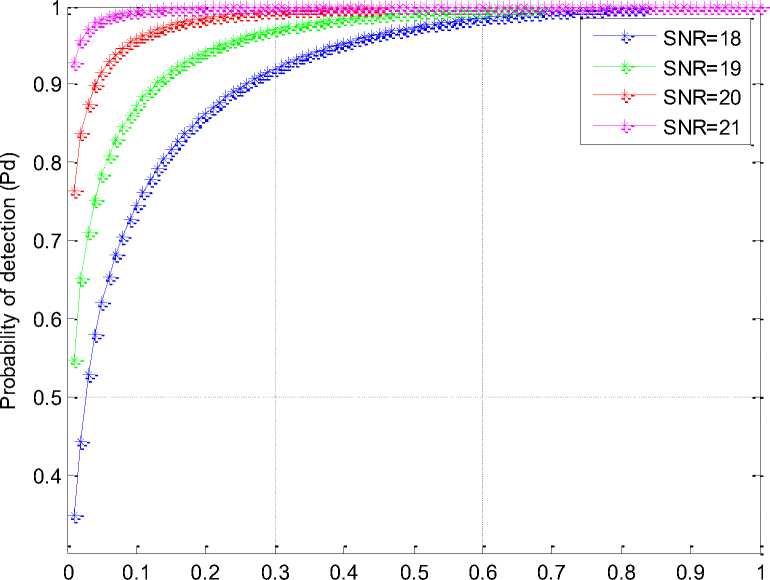
ROC of Spectrum Sensing for Different Pfa under AWGN
Probability of False Alarm (Pfa)
Fig. 4: ROC of Spectrum Sensing for Different Pfa
Fig.4 shows that ROC of spectrum sensing for different number of probability of false alarm under AWGN channel where time bandwidth factor 1000 is used. The probability of detection is measured in fig. 4 based on the probability of false alarm. It shows that probability of detection is also varies based on SNR and SNR 18, 19, 20, and 21 are used for this simulation. Here Pfa is used from 0.01 to 1 by increasing 0.01, where 100 Pfa is used. From the simulation result we saw that when SNR=18 and Pfa is 0.0200, the detection probability is about 0.4412. But after this Pfa and before Pfa=0.9700, the detection probability is approximately good. The detection probability is 1 when Pfa= 0.9800, 0.9900 and 1.0000. In the case of SNR=19 and Pfa is 0.0100, the detection probability is about 0.5473. But after this Pfa and before Pfa=0.9200, the detection probability is approximately good. The detection probability is 1 when Pfa are 0.9300, 0.9400, 0.9500, 0.9600, 0.9700, 0.9800, 0.9900 and 1.0000. In the case of SNR=20, the detection probability is approximately good when Pfa are from 0.0100 to before 0.8200. The detection probability is 1 when Pfa are
0.8300, 0.8400, 0.8500, 0.8600, 0.8700, 0.8800, 0.8900, 0.9000, 0.9100, 0.9200, 0.9300, 0.9400, 0.9500, 0.9600, 0.9700, 0.9800, 0.9900 and 1.0000. In the case of SNR=21, the detection probability is approximately good when Pfa are from 0.0100 to before 0.4300. The detection probability is 1 when Pfa are 0.4400, 0.4500, 0.4600, 0.4700, 0.4800, 0.4900, 0.5000, 0.5100, 0.5200, 0.5300, 0.5400, 0.5500, 0.5600, 0.5700, 0.5800, 0.5900, 0.6000, 0.6100, 0.6200, 0.6300, 0.6400, 0.6500, 0.6600, 0.6700, 0.6800, 0.6900, 0.7000, 0.7100, 0.7200, 0.7300, 0.7400, 0.7500, 0.7600, 0.7700, 0.7800, 0.7900, 0.8000, 0.8100, 0.8200, 0.8300, 0.8400, 0.8500, 0.8600, 0.8700, 0.8800, 0.8900, 0.9000, 0.9100, 0.9200, 0.9300, 0.9400, 0.9500, 0.9600, 0.9700, 0.9800, 0.9900 and 1.0000. So the detection probability is increasing, when Pfa is increasing and it also shows that when SNR=21, the detection probability is approximately good.
Fig.5 shows that ROC of spectrum sensing for different number of probability of false alarm and time bandwidth factor under AWGN channel.
ROC of Spectrum Sensing for Different Pfa under AWGN
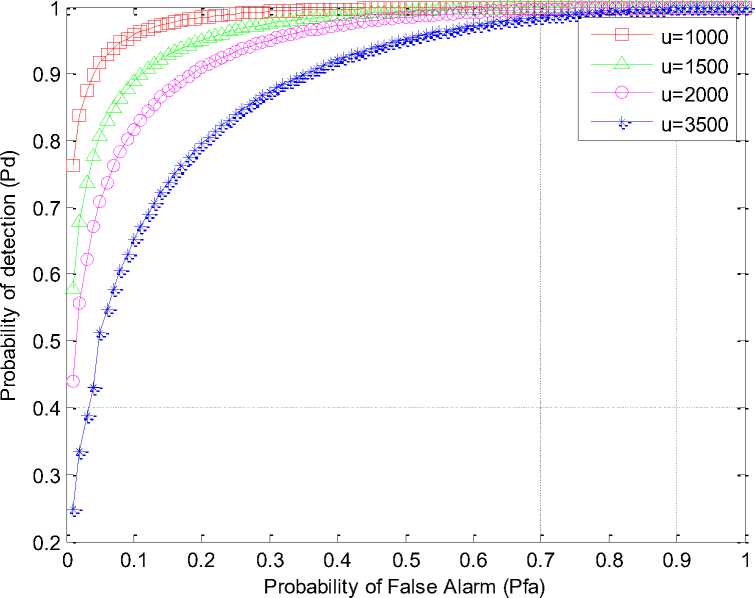
In fig.5, SNR=20dB and Pfa from 0.01 to 1 by increasing 0.01 where 100 times are used. The probability of detection is estimated based on the different probability of false alarm and time bandwidth factors. The detection probability varies based on the probability of false alarm and time bandwidth factor. When u is 1000, then the detection probability is better than other used time bandwidth factor. When u 3500 is used, then the detection probability is worse than the other used bandwidth factor. When u is 2000 then, the detection probability is better than u =3500 and worse than u =1000. It shows that the probability of detection is increased when false alarm probability is increased and probability of detection is decreased when the time bandwidth factor is increased.
-
IV. Conclusion
In this paper, we have discussed spectrum sensing based on energy detection in CR networks. ROC curves are used to plots of the probability of detection vs. the probability of false alarm. The probability of detection varies based on SNR, false alarm probability and various time bandwidth factors. SNR influences on the detection probability. When SNR increases, the detection probability increases and we also get SNR=25dB is better where detection probability 1. Again the detection probability varies depend on time bandwidth factor. If time bandwidth factor increases, the detection probability decreases. The false alarm probability also effects on detection probability. If false alarm increases, the detection probability increases. We also get the suitable SNR for the energy detector. So we almost get the final result of the spectrum sensing for cognitive radio based on Energy Detection as we expected.
References Energy Detection Performance of Spectrum Sensing in Cognitive Radio
- D. Cabric, S. M. Mishra, D. Willkomm, R. W. Brodersen, and A. Wolisz, “A cognitive radio approach for usage of virtual unlicensed spectrum,” in Proc. 14th IST Mobile and Wireless Commun. Summit, June 2005.
- I. Mitol, J. and J. Maguire, G.Q., "Cognitive Radio: Making Software Radios more Personal," IEEE Personal Common. Mag., vol.6, no.4, pp.13-18, Aug.1999.
- Federal Communications Commission, “Notice of Proposed Rule Making and Order: Facilitating Opportunities for Flexible, Efficient, and Reliable Spectrum Use Employing Cognitive Radio Technologies”, ET docket no. 03-108, Feb.2005.
- Federal Communications Commission, "Notice of Proposed Rulemaking: Unlicensed operation in the TV broadcast", ET Docket no. 04-186 (FCC 04-113) May 2004.
- A. Sahai and D. Cabric, "A Tutorial on Spectrum Sensing: Fundamental Limits and Practical Challenges", IEEE DYSPAN, Baltimore, MD, Nov.2005.
- D. Cabric, S.M .Mishra, and R.W. Brodersen, “Implementation Issues in Spectrum Sensing for Cognitive Radios", IEEE Asilomar Conf. Signals, Systems and Computers, vol.1, pp.772-776, Nov.2004.
- H. Tang, "Some Physical Layer Issues of Wide-Band Cognitive Radio Systems", IEEE Int. Conf. Wireless Networks, Commun and Mobile Computing, pp.151-159, Nov.2005.
- By Simon Haykin, Life Fellow IEEE, David J. Thomson, Fellow IEEE, and Jeffrey H. Reed, Fellow IEEE, “Spectrum Sensing for Cognitive Radio” , pp.849-877 , Vol. 97, No. 5, May 2009.
- R. Tundra and A. Sahai, "Fundamental Limits on Detection in Low SNR under Noise Uncertainty," IEEE Int. Conf .Wireless Networks Commun. And Computing, vol.1, pp. 464-469, June 2005.
- Geng Wang, "Performance of Collaborative Spectrum Sensing in a Cognitive Radio Systems", Master Thesis the University of Britch Coumbi 2009.
- H. Urkowitz, “Energy detection of unknown deterministic signals,” Proc. IEEE, vol. 55, pp. 523–531, Apr. 1967.
- F. F. Digham, M. -S. Alouini, and M. K. Simon, “On the energy detection of unknown signals over fading channels,” in Proc. IEEE Int. Conf. on Commun., May 2003, vol. 5, pp. 3575–3579.
- V. I. Kostylev, “Energy detection of a signal with random amplitude,” in Proc. IEEE Int. Conf. on Commun. (ICC’02), New York City, New York, pp. 1606–1610, May 2002.
- C.E. Shannon, “Communication in the presence of noise,” Proc. IRE, vol. 37, pp. 1-21, January 1949.
- J. Ma, G. Zhao, Y. Li, “Soft Combination and Detection for Cooperative Spectrum Sensing in Cognitive Radio Networks”, IEEE Transactions on Wireless Communications, vol.7, no.11, pp.4502-4507, Nov. 2008.
- A. Ghasemi and E. S. Sousa, “Collaborative spectrum sensing for opportunistic access in fading environments”, in Proc. IEEE Int. Symp. on New Frontiers in Dynamic Spectrum Access Networks, Nov. 2005, pp. 131–136.
- S. P. Herath, N. Rajatheva, and C. Tellambura, “Unified Approach for Energy Detection of Unknown Deterministic Signal in Cognitive Radio Over Fading Channels”, In: IEEE International Conference on Communications Workshops, 2009. ICC Workshops 2009. 14-18 June 2009 Page(s):1 – 5.
- S.P. Herath, N. Rajatheva, C. Tellambura, “On the energy detection of unknown deterministic signal over Nakagami channels with selection combining," in Proc. IEEE Canadian Conf. Electrical Comput. Eng., May 2009, pp. 745–749.
- S. Mekki, J. Danger, B. Miscopein, and J. Boutros, “Chi-squared distribution approximation for probabilistic energy equalizer implementation in impulse-radio UWB receiver," in Proc. IEEE Singapore International Conf. Commun. Syst., Nov. 2008, pp. 1539–1544.
- Li Jiajun, Tan Zhenhui, Ai Bo, Yang Shan1, “Weighted Hard Combination for Cooperative Spectrum Sensing in Cognitive Radio Networks”, Research paper, pp. 111-116, March 2011.
