Enhanced Initial Centroids for K-means Algorithm

Author: Aleta C. Fabregas, Bobby D. Gerardo, Bartolome T. Tanguilig III
Journal: International Journal of Information Technology and Computer Science(IJITCS) @ijitcs
Article in issue: 1 Vol. 9, 2017.
Free access
This paper focuses on the enhanced initial centroids for the K-means algorithm. The original k-means is using the random choice of initial seeds which is a major limitation of the original K-means algorithm because it produces less reliable result of clustering the data. The enhanced method of the k-means algorithm includes the computation of the weighted mean to improve the centroids initialization. This paper shows the comparison between K-Means and the enhanced K-Means algorithm, and it proves that the new method of selecting initial seeds is better in terms of mathematical computation and reliability.
K-means algorithm, Euclidian Distance, Centroids, Clustering, Enhanced-K-means algorithm Weighted Average mean
Short address: https://sciup.org/15012608
IDR: 15012608
Text of the scientific article Enhanced Initial Centroids for K-means Algorithm
Published Online January 2017 in MECS
K-Means is a popular clustering technique because of its simplicity, fast mathematical computation and memory efficient. It is the method of grouping a set of objects in such a way that objects in the same group are more similar to each other than to those in other groups K-Means is Partitioning algorithm which takes as input a positive integer number of clusters K and a data set to divide into K non-empty, non-overlapping and nonsubordinated clusters [1].
The main idea of the “Enhanced Initial centroids” is to modify the methods of selecting Initial centroids. Instead of a random selecting of cluster point in K-means, the enhanced approach is using the Weighted Average Mean as the basis for selecting initial configurations or initial conditions. The major purpose of this study is to eliminate the random selection of the initial seeds because it leads to a less reliable result, and to improve the efficiency of clustering. The new method computes the weighted mean of each point for each attribute prior to the selection of the initial centroids.
This study applies the Original K-means and the Enhanced K-means to two simple applications, first is the determination of the performance of the students based on the quizzes and examination and monitoring of the fixed assets-service vehicles based on the age and usage factor. The two (2) applications compare the performance of the original k-means and the enhanced initial centroids in terms of reliability and number of iterations.
-
II. B ACKGROUND
In data mining, k-means clustering is a method of cluster analysis which aims to partition n observations into k clusters in which each observation belongs to the cluster with the nearest mean [2]. The K-Means algorithm is a plain iterative function to distribute a given dataset into a user specified number of groups, k [3]. The traditional method started by selecting k points as the initial k cluster seeds. The procedure for obtaining these initial seeds include random selection from the dataset. Then the algorithm repeats between two steps until reaching the stopping point: 1: Data Assignment. Each data point is assigned to its nearest centroid. This results in a separation of the data. 2: Relocation of means. Each group representative is relocated to the center of all data points assigned to it. The procedure reaches the stopping point when the data assignments no longer modified. To quantify closeness in the assignment step, the squared Euclidean distance formula is used [4]. This formula is used for determining the least sum of squares which is the objective function of the K-means algorithm.
-
A. The Strengths of and Weaknesses of K-means Algorithm
The K-means algorithm is noted for its fast computation and, relatively efficient and produces the best result when dataset are well clustered from each other [3]. And some of the weaknesses are the user has to define the value of K, the number of clusters, although this is really one of the objectives of clustering, and it is not easy for high-dimension data if there are no clues as to what number of clusters might be appropriate. Choosing an inappropriate number of clusters will lead to a meaningless classification. And the K-Means algorithm reaches a local minimum, but cannot guarantee the global minimum of the criterion what results in high sensitivity to initial conditions [1].
The authors proposed to improve the performance of the algorithm by eliminating the random selection of the cluster center. The Partitioning result of the k-mean clustering algorithm lies greatly upon the reliability of the initial seeds which are selected randomly. “In mathematics and physics, the centroid or geometric center of a two-dimensional region (area) is the arithmetic mean ("average") position of all the points in the shape.”[5] The random initial selection is not based on any computation or algorithm, therefore leading to the inappropriate result.
-
III. R ELATED W ORK
The concept of K-means algorithm is one of the most popular clustering method because of the simple implementation, speed of convergence and adaptability to sparse data [9]. From the numerous applications of the k-means algorithm, the weakness became apparent, the random selection of initial centroid that leads to unfruitful result of clustering. Several methods have been proposed to improve both the accuracy and efficiency of the K-means algorithm [6]. This paper reviewed some of the latest proposals of the K-means. In A. Khedr et al [7], the performance tuning of the algorithm focus in determining the degree of closeness between the elements and related clusters. In Aggarwal et al [10] focused on keeping the distance between each point and its nearest center to enhance the k-means clustering technique. M. Yedla et al [11] proposed algorithm with two methods, the first method is finding the better initial centroids and the second method is the efficient way of assigning data points to appropriate clusters.
The authors focused on proposing the simpler enhancement of k-means by concentrating on the initial centroids only. The integration of the weighted mean in the Enhanced initial centroid is a simple step and not mathematically complicated. The new method is combined with the Assignment and Updating steps of the original k-means algorithm, but the result is more reliable and convergence is faster to achieve.
-
IV. T HE K-M EANS A LGORITHM AND I TS E NHANCEMENT
This study will demonstrate the original procedures of K-means algorithm and its enhanced version. It follows a simple and easy way to classify a given dataset based on the common traits. The main purpose is to determine k centers, one for each cluster or subset. The good selection is to place them as much as possible far away from each other. Then, take each point belonging to a given data set and associate it to the nearest center. When no point is pending, the first step is completed. At this point. It is a need to re-compute the k new centroids as the center of the clusters resulting from the previous step. A repetition has been generated. After this loop, notice that the k centers change their location step by step until no more changes are done Finally, this algorithm aims at minimizing an objective function known as squared error function called Euclidean distance. Deriving the Euclidean distance between two data points involves computing the square root of the sum of the squares of the differences between corresponding values [12].
I = ∑ ∑ ‖ X (')- Cj ‖ (1)
‖ X ( i )-c. ‖2
Where I I t j a chosen distance between a data point ( ) and the cluster cj, is an indicator of the distance of the n data points from their respective cluster centers.
The study will use same procedures with different datasets for the original K-means algorithm. In M.H. Shovon et. al [13] Graded Point Average (GPA) is a commonly used indicator of academic performance and they used standard K-means and Decision tree. This study simplify the application. Suppose we have several students (4 students) and each student have two attributes or features as shown in the table below. Our goal is to group these students into K=2, (Passing and Failing students) based on the two features to determine the academic performance of the four students. In this example, the perfect written quiz is 500 and the perfect written examination is 400.
Table 1. The Clustering using the original K-means algorithm
|
Student |
Total Quizzes |
Total Examinations |
|
Student 1 |
100 |
100 |
|
Student 2 |
200 |
100 |
|
Student 3 |
400 |
300 |
|
Student 4 |
500 |
400 |
In the original method of K-means algorithm, with the random selection of the initial centroids, we assumed that the seed 1 is (100, 100) of the student 1 and the seed 2 is (200,100). The sample computations between the seed 1 to each student is shown below using the Euclidean distance formula.
-
a. √(100 - 100) + (100 - 100)
-
b. √(200 -100) + (100 -100)=100
And the sample computations for the seed 2 is shown below.
-
a. √(200 -100) + (100 -100)=100
-
b. √(200 -200) + (100 -100)=0
Table 2. The result using the Euclidian distance based on the First Iteration
Sample computation for Seed 2= (450, 350)
-
a. √(450-100)7 + (350-100)7 = 430.11
-
b. √(200-450)7 + (100 - 350)7 = 353.55
The result of Object Clustering based on the minimum distance is:
Group 1 = student 1 and Group 2 = student 2, 3 and 4. The computed new seed of each group based on the new memberships is:
Group 1 only has one member thus, the centroid remains in seed 1 = (100, 100).
Group 2 now has three members, thus, the centroid is the average coordinate among the three members: seed 2 = (200+400+500)/3, (100+300+400)/3 = (366.67, 266.67). After the second iteration, the result of clustering is: Group 1 = Student 1 and 2.
Group 2 = Student 3 and 4.
Sample computation for Seed 1= (100, 100)
-
a. √(100-100)7 + (100-100)7 =0.0
-
b. √(200-100)2 + (100-100)2 =100
Sample computation for Seed 2= (366.67, 266.67)
-
a. √(100-366.67)2 + (100 - 266.67)2 = 314.47
-
b. √(200-366.67)2 + (100 - 266.67) =
235.70
The following tables are the result of repeating the major steps of the original method of K-means algorithm: 1. Determination of centroids/seeds, 2.
Computation of Objects centroid distance using the Euclidean distance and 3. Objects clustering.
Table 3. The result the Euclidean Distance based on Second Iteration
|
Student |
Distance to Seed 1 |
Distance to Seed 2 |
|
Student 1 |
50.00 |
430.11 |
|
Student 2 |
50.00 |
353.55 |
|
Student 3 |
320.15 |
70.71 |
|
Student 4 |
460.97 |
70.71 |
With new membership, another centroid cluster is computed: seed 1= (100+200)/2, (100+100)/2= (150, 100), seed 2 = (400+500)/2, (300+400)/2 = (450,350).
Sample computation for Seed 1= (150, 100)
a. √(150-100)7 + (100-100)7 = 50.0
Table 4. The final result using the Euclidean Distance based on Third Iteration
|
Student |
Distance to Seed 1 |
Distance to Seed 2 |
|
Student 1 |
0.00 |
100.00 |
|
Student 2 |
100.00 |
0.00 |
|
Student 3 |
360.55 |
282.84 |
|
Student 4 |
500.00 |
424.26 |
The final groupings after the three (3) looping’s is shown below.
Table 5. The final clustering based on the original K-means algorithm
|
Student |
Total Quizzes |
Total Examinations |
Group Result |
|
Student1 |
100 |
100 |
1(Failing) |
|
Student2 |
200 |
100 |
1(Failing) |
|
Student3 |
400 |
300 |
2(Passing) |
|
Student4 |
500 |
400 |
2(Passing) |
The original method of K-means algorithm has resulted to three (3) iterations with the random selection of initial seeds.
-
A. Enhanced Initial Centroids for K-means Algorithm
-
1. Initialization . Given the number K of clusters, initialization means in the Enhanced initial centroids is to obtain the weighted average of the pair of attributes of the object based on the highest point or perfect score given for each set or column. The computed highest and lowest weighted average will be the initial centroids or seeds to create an initial partition. The initial partition divides the objects into K clusters with the computed initial centroids. The Partitioning and Convergence steps are still similar with the standard K-means algorithm.
-
2. Partitioning. It is two-step looping steps for each object:
-
3. The Assignment and Update refinement steps are repeated until convergence is achieved.
o Assignment step, where the distances of the object from the centroids of each of K clusters are computed using the Euclidean distance; if the object is not currently in the cluster with the closest prototype, then it is reassigned to its nearest cluster.
o Update step: if reassignment occurs, both the clusters ( gaining the new object and loosing the object) are updated and their seeds are recalculated using the current clustering;
Fig.1. The Enhanced K-means algorithm
The Enhanced initial centroids for K-means algorithm does not require complicated calculation to obtain better initial centroids but relatively easy mathematical computation. Since the centroid is the average position of all the points in the dataset that indicates equal weight, the weighted average is reflecting the real weight of a point from the given dataset. The recommended integration of the weighted average for initial centroids shows immediately the clear separation of the clustering between points and overlapping between the groups is minimized. The weighted mean that represents corresponding the weight of each point in the given attribute is used to obtain the highest and lowest pair of weighted average, these pairs will be the basis of the initial centroids. The enhancement is presented in figure 1.
The Enhanced K-means algorithm with improved initial centroids applying the weighted mean of the data sets reduced the iteration steps of the algorithm thus, reducing the computational complexity. Obtaining the highest pair of weighted mean and lowest pair of weighted mean from the pair of X and Y coordinate improves the K-means algorithm because it also clearly separates the clustering of the datasets with fewer iterations. With the enhancement, it eliminates not only the random selection of initial centroids but also the Euclidean distance computation for clustering is lessened. Thus, the stability or non-movement of objects is easier to achieve and clustering of objects is more consistent.
Table 6. Results of using computed Weighted mean from X and Y attributes
|
Student |
Total Quizzes |
Total Examinations |
Weighted Mean(X) |
Weighted Mean(Y) |
|
1 |
100 |
100 |
41.67 |
44.44 |
|
2 |
200 |
100 |
83.33 |
44.44 |
|
3 |
400 |
300 |
166.66 |
133.33 |
|
4 |
500 |
400 |
208.33 |
177.78 |
|
1200 |
900 |
-
B. Definition of Weighted Mean
A weighted average is the average of values which are scaled by importance. The weighted average of values is the sum of weights times values divided by the sum of the weights [6].
The following is the formula for the weighted mean
Weighted Mean = ∑wx / ∑w (2)
Therefore, data elements with a high weight contribute more to the weighted mean than do elements with a low weight [6].
The detailed application of the simple steps to find better centroids for the Enhanced K-means algorithm is used in the same datasets applying the original K-means for comparison.The steps of applying the weighted mean of attribute X and attribute Y. First is, determine the highest point or perfect point for the given attributes in the column that will correspond to the weight. For the attribute X (the quizzes, the perfect point is 500), the highest point is 500. Second, is get the weighted average of each point based on the given weight. The weight will be equivalent to the highest or perfect point of the given attribute.
X [1] = 100 * 500 /1200= 41.67
X [2] = 200 * 500 / 1200= 83.33
X [3] = 400 *500 /1200= 166.66
X [4] = 500 *500 /1200= 208.33
Same steps will be applied for the weighted mean of Attribute Y (the perfect points or highest point for the examinations is 400). The highest point which is the weight is 400 for Y attribute.
The weighted average of each point for Y are:
Y [1] = 100 * 400 / 900 = 44.44
Y [2] = 100 * 400 / 900 = 44.44
Y [3] = 300 * 400 / 900 = 133.33
Y [4] = 400 * 400 / 900 = 177.78
The highest weighted mean for the two attributes is the student 4 (X = 208.33and Y = 177.78) and the lowest pair of weighted mean is the student 1(X = 41.67and Y =44.44) and this technique is the basis of obtaining the two (2) centroids, the highest and the lowest pair of computed weighted mean. So the initial centroids will be seed 1 = (100, 100) and the seed 2 = (500, 400). The calculation of the distance between cluster centroid to each object is traditionally achieved by using the formula of the Euclidean distance.
Iteration 1 . The sample computations to know the distance between the seed 1 (100, 100) using Euclidean distance is shown below:
Sample computation for Seed 1= (100, 100)
-
a. √(100- 100)2 + (100 - 100)2 = 00.0
-
b. √(200- 100)2 + (100 - 100)2 = 100.00
The sample computation of the Euclidean Distance of the objects for seed 2 = (500, 400) are shown below:
Sample computation for Seed 2= (500, 400)
-
a. √(500- 100)2 + (400 - 100)2 = 500.00
-
b. √(200- 500)2 + (100 - 400)2 = 424.26
The initial result of the first iteration using Euclidian distance is shown in Table 7.
Table 7. Result of the first iteration using the enhanced k-means algorithm
|
Student |
Distance to Seed 1 |
Distance to Seed 2 |
|
Student 1 |
50.00 |
430.11 |
|
Student 2 |
50.00 |
353.55 |
|
Student 3 |
320.15 |
70.71 |
|
Student 4 |
460.97 |
70.71 |
The distance between seed 1(100, 100) = (0.00, 100.00, 360.55, 500.00). And the distance between seed 2 (500 400) = (500, 424.26, 141.42, 0.00).
Based on the computation, the Objects Clustering is determined by checking the minimum distance of the objects to the two centroids.
Table 8. Assignment based on the result of Object clustering of the Enhanced K-means algorithm
|
Object Clustering |
Group 1 |
Group 2 |
|
1, 2 |
3, 4 |
After the initial computation, the Iteration 1 of the enhanced K-means Group 1 has already 2 members, students 1 and 2, same with Group 2 with students 3 and 4. But in the old method of the K-means algorithm, Group 1 has only one member and Group 2 has 3 members.
In the new method, since Group 1 and group 2 has 2 members each, we have to compute the new centroids for Object partitioning.
(100+100)2 = (150, 100).
The new computed distance of the objects to seed 1 = (50, 50, 320.15.460.97).
Sample computation for Seed 1= (150, 100)
-
a. √(150-100)7 + (100-100)7 = 50.0
-
b. √(200-150)7 + (100-100)7 = 50.0
The new seed 2 will be (400 +500)/, (300 +400)/2 = (450, 350).
The sample computation of the Distance of the objects for seed 2 = (430.11, 353.55, 70.71, 70.71) are shown below:
Sample computation for Seed 2= (450, 350)
-
a. √(450-100)2 + (350 -100)7 = 430.11
-
b. √(200-450)7 + (100 -350)7 = 353.55
Iteration 2 : The newly seed 1 will be (100 + 200)/2
Table 10. Final Clustering of Students using Enhanced K-means algorithm.
Students
Total
Quizzes
Total Examinat ions
Weighted Mean(X)
Weighted Mean(Y)
Final Grouping
1
100
100
41.67
44.44
1(failing)
2
200
100
83.33
44.44
1(failing)
3
400
300
166.66
133.33
2(passing)
4
500
400
208.33
177.78
2(passing)
1200
900
Table 9. Result of the Second iteration using the Enhanced k-means algorithm
|
Student |
Distance Seed 1 |
Distance Seed 2 |
|
1 |
0.00 |
500.00 |
|
2 |
100.00 |
424.26 |
|
3 |
360.55 |
141.42 |
|
4 |
500.00 |
0.00 |
Comparing the grouping of last iteration of the original K-means algorithm and this iteration reveals that the objects do not move group anymore. Thus, the computation of the modified k-mean clustering has reached its stability faster and no more iteration is needed. The number of iterations as compared to the previous application of the old k-means algorithm is reduced. Because of the selection of the highest pair of weighted average and lowest pair of the weighted average of the X and Y coordinates, there is a significant decrease of the complexity of computing the Euclidean distance. Based on the computation of the Enhanced K-means with initial centroids obtained from the highest and lowest weighted average of the pair X and Y, the two groups are shown below in the table.
Using the Scatter chart for effective clustering, the final result of clustering using the enhanced K-means algorithm is shown below.
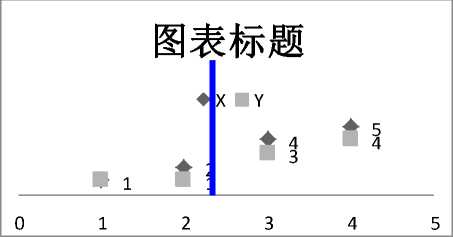
Fig.2. The Scatter Chart showing the Clustering of the objects based on the Enhanced K-means algorithm
-
C. The Application of Enhanced K-Means Algorithm
The enhancement will be applied to a simple Fixed Asset Monitoring. Depreciation means that assets lose their value over time (in other words, they depreciate) , and must be replaced once the end of their useful life is reached [14]. The monitoring includes depreciation concept of the fixed asset considering the Usage factor which is defined as the physical condition of the fixed asset and Age factor is the remaining service life of the equipment. The two factors will be used to assess the condition of the fixed assets. High and Low will be used as status remarks for the clustering of the service vehicles.
The application is simplified to show the application of the Enhanced Initial Centroids for K-means algorithm. The table below will have the Usage factor and Age factor for each service vehicle unit. The results of computing the weighted average are also included in the table. The service vehicles are acquired at the same date so the age factor rate applied as the weight is 5.00, the highest point and for the usage factor is 7.00 as the weight, since this value is the highest point.
The sample computation for the weighted average of age factor is shown below.
Vehicle 1 = 1.00 *5.0 / 22 = 0.23
Vehicle 2 = 1.50 *5.0 / 22 = 0.34
Vehicle 3 = 3.00 *5.0 / 22 = 0.68
The sample computation for the weighted average of usage factor is shown below.
|
Vehicle |
1 = |
1.0 * 7.0 / 28.4 |
= 0.25 |
|
Vehicle |
2 = |
2.0 * 7.0 / 28.4 |
= 0.49 |
|
Vehicle |
3 = |
4.0 * 7.0 / 28.4 |
= 0.99 |
Table 11. The Table of Service Vehicles with their attributes using Enhanced K-means algorithm.
|
Fixed Asset |
Total Age factor |
Total Usage factor |
Weighted Average of Age |
Weighted Average of Usage |
|
Vehicle 1 |
1.0 |
1.0 |
0.23 |
0.25 |
|
Vehicle 2 |
1.5 |
2.0 |
0.34 |
0.49 |
|
Vehicle 3 |
3.0 |
4.0 |
0.68 |
0.99 |
|
Vehicle 4 |
5.0 |
7.0 |
1.14 |
1.73 |
|
Vehicle 5 |
3.5 |
5.0 |
0.80 |
1.23 |
|
Vehicle 6 |
4.5 |
5.0 |
1.02 |
1.23 |
|
Vehicle 7 |
3.5 |
4.4 |
0.80 |
1.09 |
|
22 |
28.4 |
Since the highest point is 5.0 for the Age factor and 7.0 for the Usage factor the lowest computed weighted average pair is the Vehicle 1 = (0.23, 0.25) and the highest computed weighted average pair is the Vehicle 4
= (1.14, 1.73). The two pairs will be the initial centroids or seeds, c1 = (1.0.1.0) and c2 = (5.0, 7.0). Using the Euclidian Distance computation, the result is shown in Table 12.
Sample computation for Seed 1= (1.0, 1.0)
-
a. √(1.0 - 1.0)2 + (1.0-1.0)2=0.0
-
b. √(1.5 - 1.0)2 + (2.0-1.0)2 =1.11
Sample computation for Seed 2= (5.0, 7.0)
-
a. √(5.0 - 1.0)2 + (1.0-7.0)2 =7.21
-
b. √(1.5 - 5.0)2 + (2.0-7.0)2 =6.10
Table 12. Result of the First Iteration using Enhanced K-means algorithm .
|
Fixed Asset |
Distance to C1 |
Distance to C2 |
|
Vehicle 1 |
0.00 |
7.21 |
|
Vehicle 2 |
1.11 |
6.10 |
|
Vehicle 3 |
3.61 |
3.61 |
|
Vehicle 4 |
7.21 |
0.00 |
|
Vehicle 5 |
4.72 |
2.50 |
|
Vehicle 6 |
5.31 |
2.06 |
|
Vehicle 7 |
4.22 |
3.00 |
The clustering based on the first iteration will have the following members:
Group 1 = (1.0, 1.0), (1.5, 2.0).
Group 2 = (3.0, 4.0), (5.0, 7.0), (3.5, 5.0), (4.5, 5.0), and (3.5, 4.4).
Since Vehicle 3 = (3.0, 4.0) has an equal distance to centroid 1 = (1.0, 1.0) and centroid 2 = (5.0, 7.0), let the Vehicle 3 be clustered to the Second group.
The result from computing the new centroids for c1=, (1.0+1.5)/2 and (1.0+2.0)/2 = (1.25, 1.5).
And for c2 = (3.0 + 5.0+3.5+4.5+3.5)/5 and (4.0+ 7.0+5.0+5.0 +4.4)/5 = (3.9, 5.08)
Sample computation for Seed 1= (1.25, 1.5)
-
a. √(1.25 - 1.0)2 + (1.5-1.0)2 =0.55
-
b. √(1.5 - 1.25)2 + (2.0-1.5)2 =0.93
Sample computation for Seed 2= (3.9, 5.08)
-
a. √(3.9 - 1.0)2 + (5.08-1.0)2 =5.00
-
b. √(1.5 - 3.9)2 + (2.0-5.08)2 =3.90
Based on the result of the second iteration, the previous clustering is obtained and there is no more movement of the objects. Convergence is achieved for two (2) iterations.
Table 13. Result of the Second Iteration using Enhanced K-means algorithm.
|
Fixed Asset |
Distance to C1 |
Distance to C2 |
|
Vehicle 1 |
0.55 |
5.00 |
|
Vehicle 2 |
0.93 |
3.90 |
|
Vehicle 3 |
3..05 |
1.40 |
|
Vehicle 4 |
6.66 |
2.21 |
|
Vehicle 5 |
4.16 |
0.40 |
|
Vehicle 6 |
4.77 |
0.37 |
|
Vehicle 7 |
3.67 |
0.62 |
Finally the groupings of the fixed asset based on the two attributes, age factor and usage factor are: Group 1 = Vehicle 1 =(1.0,1.0) and Vehicle 2 =(1.5,2.0), Group 2 are Vehicle 3 to Vehicle 7 with the following attribute values = (3.0, 4.0), (5.0, 7.0), (3.5, 5.0), (4.5, 5.0), and (3.5, 4.4). The groupings of the members into two clusters are Group 1 with low performance fixed assets and Group 2 with high performance fixed assets.
Table 14. Clustering based on the result of the Enhanced K-means algorithm
|
Fixed Asset |
Age factor |
Usage factor |
Groupings |
|
Vehicle 1 |
1.0 |
1.0 |
Low |
|
Vehicle 2 |
1.5 |
2.0 |
Low |
|
Vehicle 3 |
3.0 |
4.0 |
High |
|
Vehicle 4 |
5.0 |
7.0 |
High |
|
Vehicle 5 |
3.5 |
5.0 |
High |
|
Vehicle 6 |
4.5 |
5.0 |
High |
|
Vehicle 7 |
3.5 |
4.4 |
High |
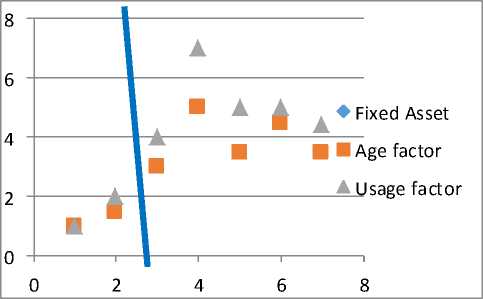
Fig.3. Result of the Enhanced K-means algorithm using Scatter Graph
Based on the two applications of the enhanced K-means algorithm, convergence or stability is easier to achieve, and better clustering is obtained with the only limited number of computations. The integration of the weighted mean in the enhanced algorithm initially reflects the real weights of the each pair of cluster, thus reducing the representation of the object in a deceiving way and reducing the Euclidian distance computation. Random selection may produce “dead” centroids but the initial centroids based on the computed weighted average that used the highest point is eliminated.
Representing the results of the Enhanced K-means algorithm in the Fixed Asset Monitoring with Age and Usage factor’s actual points using the Scatter graph.
-
V. F INDINGS AND C ONCLUSION
The enhanced initial centroids for K-means algorithm applying the weighted average mean of the data sets eliminates the random selection of the initial centroids and reduced the iteration steps of using the Euclidean distance algorithm thus, reducing the computational complexity. The separation of the clustering improves because of the initial centroids which are obtained based on the computed highest pair and the lowest pair of weighted average mean. This is a simple computational method for obtaining the initial centroids. It guarantees a well-separated centroids. Since iteration is decreased, the complexity of the computation is also decreased.
-
VI. R ECOMMENDATIONS
The point of each attribute in the dataset must be properly distributed to get the good result of applying the weighted average. The use of Exclusive Assignment - If there are two highly overlapping points in the dataset, then enhanced initial centroids for k-means will not be able to resolve the distinct separation or final groupings from the given objects. The future study must be focused on how to resolve this limitation.
K-means suffers from drawback on the number of clusters k as an input parameter. This is because of an inappropriate choice of k which might yield spurious results [15]. The pre-determined number of clusters is part of the original concept of K-means algorithm that needs further study to be considered in the modification for producing reliable results.
References Enhanced Initial Centroids for K-means Algorithm
- K-means Clustering RTMath, Available at:rtmath.net/help/html/ Retrieved: May 22, 2016
- J.C.Da Costa, M.D. Ortigueira and A. G. Batista, “ K-means Clustering for Sleep Spindles Classification”, International Journal of Information Technology and Computer Science(IJITCS), ISSN 2091-1610 Volume 10, Issue - 3 ,pp 77 – 85, August 2013
- V. Kathiresan., “An Efficient Clustering Algorithm based on Z score Ranking Method”, International Conference on Computer Communication and Informatics(ICCCI), ISBN:978-1-4577-1583-9/12, 2012, © IEEE DOI: 10.1109/ICCI.2012.6158779
- Kushwah S. P. S. Rawat K, and Gupta P, ”Analysis and Comparison of Efficient Techniques of Clustering Algorithms in Data Mining”, International Journal of Innovative Technology and Exploring Engineering (IJITEE) ISSN: 2278-3075,Volume-1,Issue-3, pp. 109– 113,2012
- A Tutorial on Clustering Algorithms ,Intranet, home.deib.polimi.it/matteucc/Clustering/tutorial_html/kmeans.html, Retrieved: February 15, 2016
- Weighted average. Available at: https://www.mathsisfun.com, Retrieved: February 15, 2016
- A. Khedr, Seddawy, and A. Idrees “Performance Tuning of K-Mean Clustering Algorithm a Step towards Efficient DSS”, International Journal of Innovative Research in Computer Science & Technology (IJIRCST), ISSN: 2347-5552, Volume 2, Issue 6, pp.111-118 November, 2014
- Teknomo, K. PhD, Teknomo, K-Means Clustering Tutorial K-Means Clustering Tutorials. (2013)
- http:\people.revoledu.comkardi tutorialkMean: Retrieved: February 15, 2016
- K-means Clustering algorithm- Data Clustering Algorithms, (sites.google.com/site/dataclusteingalgorithms/k-means clustering-algorithm k-means) Retrieved: February 28, 2016
- N.Aggarwal, K. Aggarwal, and K.Gupta, “Comparative Analysis of K-means and Enhanced K-means clustering algorithm for data mining”, International Journal of Scientific and Engineering Research (IJSER) ISSN 2229 -5518, Volume 3, Issue 3, pp.1-8, August 2012
- M. Yedla ,S.Pathakota, and T. Srinivasa “Enhancing K-means Clustering Algorithm with Improved Initial Center”, International Journal of Computer Science and Information Technologies(IJCSIT), Volume 1 (2), pp. 121-125, 2010
- S.K. Ali, Z.N. Azeez, A.A Ouda “A New Clustering Algorithm for Face Classification”, International Journal of Information Technology and Computer Science(IJITCS), 2016,6, 1-8, Published Online June 2016 http://www.mecs-press.org, pp 1-8, DOI:10.5815/ijitcs 2016.06.01
- M.H.Shovon, and M.Haque “An Approach of Improving Academic Performance by using K-means clustering Algorithm and Decision Tree”, International Journal of Advanced Computer Science and Applications(IJACSA)Vol.3, No. 8, pp.146-149, 2012
- Depreciation: Definition Available at: www.investorwords.com/1416/depreciation.html, Retrieved: June 5, 2016
- S.G. Rao, and A. Govardhan “Evaluation of H-and G- Indices of Scientific Authors using Modified K-means Clustering Algorithm”, International Journal of Information Technology and Computer Science (IJITCS) 2016,2, 47-51, pp 47-51 Published Online February 2016 http://www.mecs-press.org DOI:10.5815/ijitcs.2016.02.06
