Enhanced Metaheuristic Algorithms for the Identification of Cancer MDPs

Author: Essam Al Daoud, Noura Al-Fayoumi
Journal: International Journal of Intelligent Systems and Applications(IJISA) @ijisa
Article in issue: 2 vol.6, 2014.
Free access
Cancer research revolves around the study of diseases that involve unregulated cell growth. This direction facilitated the development of a wide range of cancer genomics projects that are designed to support the identification of mutated driver pathways in several cancer types. In this research, a maximum weight submatrix problem is used to identify the driver pathway in a specific type of cancer. To solve this problem, we propose two new metaheuristic algorithms. The first is an improved harmony search (IHS) algorithm and the second is an enhanced genetic algorithm (EGA). Results show that EGA enables better performance and entails less computational time than does conventional GA. Furthermore, the new IHS offers a higher number of suggested gene set solutions for mutated genes than does the standard genetic algorithm.
Genetic Algorithm, Maximum Weight Submatrix, Improved Harmony Search, Mutated Driver Pathways
Short address: https://sciup.org/15010523
IDR: 15010523
Text of the scientific article Enhanced Metaheuristic Algorithms for the Identification of Cancer MDPs
Published Online January 2014 in MECS
The revolutionary finding of cancer research can be expressed in a single statement: cancer is mostly a genetic disease. Tumors result from uncontrolled cell growth, i.e., mutations. In the human genome, many different types of genes control cell growth in a very systematic, precise manner. When errors occur in the DNA code of such genes, they may fail to effectively work and are regarded as “altered” or mutated. When numerous mutations in different genes occur in a specific group of cells over time, tumors grow, indicating that genes do not act in isolation but interact with other genes (and the proteins that these genes produce) in complex signaling and regulatory networks. Cancer is often called a disease of pathways because pathways or groups of genes mutate, thereby perturbing a particular gene function in cancer [1].
Therapeutic decision making in oncology after surgical resection of tumors (adjuvant treatment) is based on an assessment of the risk of tumor relapse; such assessment enables scientists to focus on others strategies for classifying tumors. These strategies not only improve the classification of each tumor type, but also guide the development of therapeutic approaches to limiting tumor growth and contributing to the delivery of personalized medical care [2].
Widespread knowledge of the mutational events that cause cancer is a critical foundation for future diagnostics, prognostics, and targeted therapeutics. The various efforts underway aim at systematically obtaining such knowledge; with the development of popular sequencing technologies, numerous mutation profiles of samples for many cancer types are now available [3-5].
The first challenge is to distinguish between driver mutations that are functionally important changes (i.e., those that enable biological conditions that allow tumors to initiate, grow, or persist) and ‘‘passenger’’ mutations that represent random somatic events. The importance of this challenge is evident in recent studies on chromosomal aberrations in cancer [4].
Many bioinformatics tools for determining mutation pathways have been established. These tools are developed on the basis of sequencing technologies that enable the drawing of numerous mutation profiles for many cancer types. Many challenges confront the field of bioinformatics, including limitations in sample quantity and the concentration of most research on cancer types that have glioblastoma multiforme tumors (GBM) as driver pathways [6].
Computational algorithms for copy number and expression in cancer (CONEXIC) indicate that driver mutations may leave a genomic ‘‘footprint’’ that can assist in distinguishing between driver and passenger mutations on the basis of three assumptions. First, a single driver mutation accidentally occurs in multiple tumors more often than expected. Second, driver mutation may be associated (correlated) with the expression of a group of genes that form a “module.” Finally, copy number aberrations frequently influence gene expression in modules via changes in driver expression. Computational algorithms combine copy number and gene expression data to detect aberrations that promote cancer progression [7].
The use of CONEXIC algorithms depends on identifying driver mutations by finding genes that are mutated to a significant frequency in a large group of cancer genomes. Driver mutations target multiple cellular signaling and regulatory pathways; therefore, cancer patients may exhibit different mutation combinations that sufficiently perturb necessary pathways. Understanding somatic mutations in cancer pathway patterns enables us to assume that cancer pathways would be perturbed in numerous patients. We therefore expect that with genome-wide measurements of somatic mutations, a driver pathway would exhibit high coverage, in which most patients show mutation in some genes in the pathway. Another assumption is that most patients suffer from cancer that is characterized by a single driver mutation in a pathway, causing the genes in a driver pathway to exhibit a pattern of mutually exclusive driver mutations; in such events, driver mutations are observed in exactly one gene in the pathway in each patient [1].
Another recommended method for identifying driver mutations is Markov chain Monte Carlo (MCMC), developed to solve the maximum weight submatrix problem in sample submatrices in proportion to their weight. A major advantage of the MCMC approach is that it samples from distributions of sets rather than identifies a single optimal set. It also does not require any assumptions on mutations. Nevertheless, although MCMC is a powerful procedure for solving this problem, it is a stochastic search technique that may be trapped in a local solution [1, 5].
An Integrating Mutation and gene Expression (IME) data model [5] was proposed given that the genes in the same pathway usually work with one another in executing one function. The expression profiles of gene pairs in the same pathway are therefore more highly correlated than those of gene pairs in different pathways. IME uses this characteristic to distinguish gene sets with identical mutations and profiles.
Given these considerations, our research is grounded on two combinatorial properties of mutations in a driver pathway—high coverage and mutual exclusivity; these properties are used as bases in solving the maximum weight submatrix by an improved harmony search (IHS) algorithm—a combination of conventional harmony search (HS) and genetic algorithm (GA).
The rest of this paper is organized as follows: Section 2 describes the previous metaheuristic algorithms for the identification of cancer. Section 3 and 4 introduce new methods based on genetic algorithm and harmony search respectively. Section 5 describes the used datasets. Section 6 discusses the experimental framework used to evaluate the performance of the suggested methods. Finally, Section 7 presents our conclusions.
-
II. Previous Methods
As previously stated, our approach depends on two assumptions proposed by Vandin [1]: the first revolves around coverage, i.e., that most patients have at least one mutation in a set, and the second is exclusivity, which means nearly all patients have no more than one mutation in a set.
The data comprise of a somatic mutation matrix and an expression matrix. The somatic mutation matrix is a binary matrix A with m rows (samples) and n columns (genes). The original maximum weight submatrix is an NP-hard problem, expressed as follows:
W(M)= Γ(M) -γ(M)
=2Γ(M)-∑g∈MΓ(g)
where Г(д) denotes the set of patients with a mutation in gene g. The coverage overlap of a set M of genes is the difference between the sum of the coverages of a single gene in a set and the coverage overlap.
γ ( M ) = ∑ g ∈ M Γ ( g ) - Γ ( M )
This problem is solved by maximizing the coverage and minimizing the coverage overlap. We can identify the submatrix with k columns with maximum weight, as shown in Figure 1 [5].
-
2.1 Genetic Algorithm
GAs are a family of computational stochastic models inspired by evolution. These algorithms encode a potential solution to a specific problem on a simple chromosome and apply recombination operators to these structures to preserve critical information. GAs are often viewed as function optimizers, although they have been applied to a broad range of problems [8].
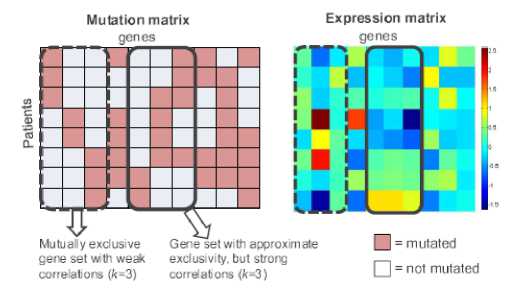
Fig. 1: Mutation and expression matrices
Under the GA approach, the algorithm is used to solve the maximum weight submatrix because it is a powerful flexible algorithm and has a natural connection with mutations and genes [5]. algorithm 1 shows the main steps of the genetic algorithm
Algorithm 1: Genetic Algorithm formulate initial population randomly initialize population repeat evaluate objective function find fitness function apply genetic operators reproduction crossover mutation until stopping criteria
In the beginning, GA randomly creates the initial population, which is encoded according to its index in the dataset. GA then evaluates the gene set using the fitness function, which is the formula of the maximum weight submatrix. Genetic operators, such as selection, crossover, and mutation operators, are always problem dependent. In this approach, given the score-based rank r i of an individual, selection probability p i is defined as follows:
p = 2 r i (3)
optimization problems. HS was conceptualized using an analogy with music improvisation, in which music players improvise the pitches of their instruments to obtain better harmony. It does not need initial values and uses a random search instead of a gradient search, thereby eliminating the need for derivative information [9]. Algorithm 2 introduces the main steps of the standard harmony search algorithm.
Algorithm 2: Harmony Search Algorithm.
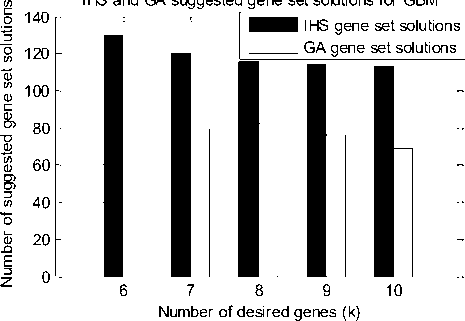
for each i e [1,N] do if rand() ≤ HMCR then x'i = Xi (j = 1,2,.....HMS) %memory consideration if rand()≤PAR then x' = x' ±rxbw %pitch adjustment if x'i > xu x'i = xiU elseif xi Step 1: Initialize the optimization problem, which is the maximum weight submatrix (F) and HS algorithm parameter: x11 x12 x12 x12 xN-1 xN-1 xN xN2 HM = v HMS-1 x1 HMS x1 HMS-1 x2 HMS x2 HMS-1 xN-1 HMS xN-1 HMS-1 xN HMS xN where F represents the objective function and x denotes the set of each decision variable. Each row presents the candidate solution for our problem; therefore, xi (from 1 to N) is the index of genes at the mutation matrix. N pertains to the number of candidate solutions; it is the multiple of sample size. Under this context, the HS algorithm parameters that are required to solve the optimization problem are also specified in this step. The number of solution vectors in harmony memory (HM) is the size of the HM matrix. Step 2: Initialize HM, which is a memory location where all the solution vectors are stored. The HM matrix, shown in (4), is filled with randomly generated solution vectors by uniform distribution, in which all the rows in HM cannot be duplicated. Step 3: Improvise a new harmony from HM. New harmony vector x' = (x‘ ,x‘ ,..,x^ ) is generated on the basis of three rules: (i) mmory consideration, (ii) pitch adjustment, and (iii) random selection. The process of generating a new harmony is called “improvisation.” In memory consideration, the value of the first decision variable (x‘' ) for the new vector is chosen from any value in the specified HM range (x; - xHMS). consideration, pitch adjustment, or random selection is applied to each variable of the new harmony vector. Step 4: Update HM. If new harmony vector x' = (x‘ ,x‘ ,..,xy) is better than the worst harmony in HM, evaluated in terms of objective function value F, the new harmony is included in HM, whereas the worst harmony is excluded. Step 5: Repeat Steps 3 and 4 until the termination criterion is satisfied [10]. HMCR, which varies between 0 and 1, is the rate of choosing one value from the historical values stored in the HM, whereas (1-HMCR) is the rate of randomly selecting one value from the possible range of gene set values. x x ^ ^ e {x* ,xi,..,xHM} with HMCR x’ eXi with (1 - HMCR) IHS dynamically updates PAR and bw according to (6) and (7): PAR (k) = PARm„ PAR —P PARmm . +-----max-------min * currentiter Maxiter bw(к) = bwmax * exp Maxiter * currentiter where PAR min and PAR min are between 0 and 1, while bw min and max are 100 and 500, respectively. After this, every component obtained by memory consideration is examined to determine whether a component should be pitch adjusted. This operation uses the PAR parameter, which is the rate of pitch adjustment; it is expressed follows: pitch adjustment Yes with PAR = No with (1 - PAR) III. Enhanced Genetic Algorithm Algorithm 3 introduces an enhanced genetic algorithm. Three changes are suggested and added to the standard algorithm namely: Selecting the parent from the low fitness, applying centers on the mutation process and new crossover techniques Algorithm 3: Enhanced genetic algorithm formulate initial population randomly initialize population repeat evaluate objective function find fitness function apply genetic operators reproduction Select parent according to uniform solution. crossover let X1 = (x1, x 2, x 3,..., xp ) and Y1 =(У1,y2,y3,...,yp) repeat until suitable criteria find suitable portion in X1 and Y1 Xi = ( Xi, y 2, x 3,..., xp) Y1' =(y1,x 2, y 3,..., yp) return the offspring which has highest ri Mutation Let i be random Integer between 1 and p change I numbers of ones to zeros and I number of zeros to ones X" = (x1,y2,x3,...,xp ) return the child that has the highe rank between X1' and X1'' The value of (1-PAR) sets the rate of idle period. If the pitch adjustment decision for x‘ is Yes, x‘ is replaced thus: x' ^ x' ±r * bw (8) where r is a random number generated using uniform distribution between 0 and 1. In Step 3, HM According to this algorithm, the ones on parents: X and Y are the selective genes and p is the number of genes in a sample. GA selects the parents using a uniform solution. Let us suppose that the parents are X1 and Y1 ; thus, enhanced GA (EGA) makes cuts on suitable portions to guarantee the same number of desired genes in each child. In the crossover operation, EGA verifies which offspring X and Y have the highest rank. If this offspring is X‘ , then it is saved; the mutation of this offspring is induced by changing the i number of ones to the i number of zeros. After this, the mutation function calculates the fitness of each X’ (child before mutation) and X’ (child after mutation), and returns the offspring with the highest rank. The HS algorithm may overcome the drawbacks of GA’s building block theory, which works well only when the relationship among variables in a chromosome is carefully considered. If the neighboring variables in a chromosome have a weaker relationship than do the remote variables, building block theory may be ineffective because of the crossover operation [11]. Algorithm 4 introduces the improved harmony search algorithm, where new operation is combined with the standard harmony search algorithm such as crossover and mutation. Algorithm 4: Improved harmony search algorithm for each i e [1,N] do if rand()≤HMCR then x‘ = xJi(J = 1,2, ....,HMS) %memory consideration if rand()≤PAR then x' = x' ±rxbw %pitch adjustment if xi > xu x'i = xiU elseif x Because no crossover operation is executed in the HS algorithm, the solutions and fitnesses generated are unacceptable. Therefore, we cannot confirm whether the HS algorithm can identify an appropriate solution for the maximum weight submatrix problem. As a resolution, we develop an HIS algorithm that includes a crossover operation, which we incorporate in Step 3. We then change the improvised into the index of chromosomes in HM to find appropriate parents. We collect two datasets to evaluate our methods (Table 1). The first dataset is the Ovarian Cancer (OC) dataset, which comprises 313 samples and 5385 genes. The second is the GBM dataset, which contains 90 samples and 1126 genes. Both datasets are directly obtained from [5], but can also be downloaded from the TCGA website. The data comprise somatic mutations and copy number aberrations; we use only the data of level 3. After processing the data, we obtain mutation matrix A. We use the mutation matrix in previously published methods. A is a binary matrix of dimensions m × n, where m indicates the number of samples and n indicates the number of genes. Each entry aij refers to the status of gene j in sample i: aij=1 if one of the following conditions holds: (1) The mutation of gene j in sample i is labeled “valid somatic” [12]. (2) Gene j is in the statistically significant aberration regions of sample i, as determined by GISTIC [13]. To identify the characteristics of these algorithms and validate their efficiency, we first compare EGA and the GA used in [5] and the GA and IHS methods using the datasets. We enhance GA to determine an appropriate solution to the maximum weight submatrix. We change the process for selecting parents, depending on a uniform solution, to guarantee that all parents are equally reflected. We choose the parents with the highest fitness or those with low fitness and unacceptable scores. In [5], the GA selects parents from a population on the basis of the selection probability pi in the equation in Ref. [1] ; each couple generates an offspring. The second change that we apply centers on the mutation process, in which our approach is to take a random number between 1 and k (number of genes in a single set). By contrast, the GA in [5] induces mutation on only one gene of a chromosome, regardless of the length of k. The third change that we implement is the crossover. Using our EGA, we identify suitable crossovers in two parents and exchange them, thereby guaranteeing that each parent has the same number of genes (coded by 1). We then compare two children and take the best one on the basis of fitness. The GA in [5] determines whether similarities exist in the genes of each parent’s relative; such genes are endowed to the child and then the remaining genes are collected. Genes are randomly selected from the remaining group on the basis of the length of k. Finally, the genes are randomly sent to any of the children. Table 1 shows the results for EGA applied on the TP53, and TSPAN31) for the further analysis of more GBM dataset after the removal of genes (CDK4, gene sets. CDKN2A, CDKN2B, CYP27B1, ERBB2, MTAP, RB1, Table 1: The detected genes by using EGA on GBM dataset K Fitness Gene set samples 2 43 PIK3R1 PTEN 5 50 EGFR GRIA2 PIK3CA PIK3R1 PTEN 7 52 EGFR GPR32 GRIA2 NOTCH1 PIK3CA PIK3R1 PTEN EGFR GRIA2 IQSEC3 PIK3CA PIK3R1 PTEN TBC1D17 ATP1B2 EGFR GRIA2 PIK3CA PIK3R1 PTEN TRIP11 10 55 BAX EGFR GRIA2 NOTCH1 PIK3CA PIK3R1 PRNP PTEN TFAP2C TUSC3 EGFR GRIA2 PIK3CA PIK3R1 PRMT1 PTEN RELN SH3YL1 TRIP11 TUSC3 AZGP1 EGFR GRIA2 PIK3CA PIK3R1 PRF1 PTEN RELN SH3YL1 SIGLEC5 Table 2 introduces the gene sets detected upon solving the Maximum Weight Submatrix problem using EGA on the OC after remove the genes (TP53, TTN, CCNE1, MYC, NINJ2) and observe the occurrence of KRAS, NF1, and MAPK8IP2 when k>3, where these genes are part of the MAPK signaling pathway. The suggested EGA shows good performance under certain k values, with high scores. The GA in [5] evaluates the significance of the identified gene pattern in accordance with [1]—a process that entails more time than that spent using EGA. Figure 2 shows that EGA and GA involve approximately the same computational time when k<6. Beyond this value, EGA exhibits better performance. Figure 3 shows that GA consumes less time when k<5, but beyond this value, EGA exceeds GA’s performance. Table 2: The detected genes by using EGA on OC dataset K Fitness Gene set 2 71 KRAS PPP2R2A 5 114 KRAS MAPK8IP2 MUC16 NF1 STMN3 KRAS MAPK8IP2 MUC16 NF1 ZGPAT KRAS MAPK8IP2 MUC16 NF1 SLC2A4RG 7 128 CASC1 KCTD14 MAPK8IP2 MUC16 NF1 RTEL1 RYR2 CASC1 KCTD14 MAPK8IP2 MUC16 NF1 RYR2 SLC2A4RG KRAS MAPK8IP2 MUC16 NF1 PPP1R3A RTEL1 RYR2 10 146 KRAS MAPK8IP2 MMRN1 MUC16 NF1 PPP1R3A PTEN RYR2 STMN3 ZFHX4 KRAS MAPK8IP2 MMRN1 MUC16 NF1 PPP1R3A PTEN RTEL1 RYR2 ZFHX4 BRCA2 KCTD14 KRAS MAPK8IP2 MGAM MMRN1 MUC16 NF1 PTEN STMN3 Genetic Algorithm Results for GBM Genetic Algorithm Results for OC - О- GA search time ■ О'" EGA search time ■ ❖■- Gene set Weight ^55 - О- GA search time О--- EGA search time ■ ❖■-■ Gene set Weight р р ф Е Л О Е ф О......О' Number of desired genes (k) Fig. 2: Search time and gene set weight for GA and EGA by using GBM datasets А' I р Number of desired genes (k) Fig. 3: Time and gene set weight for GA and EGA by using the OC datasets After applying IHS on GBM at k=2, we obtain (CDKN2A, TP53), which are the most well-known cancer genes, and consider these a part of the p53 signaling pathway. The other gene sets used are (CDKN2B, CDK4) and (CDKN2B, TSPAN31); the former is part of the RB signaling pathway. If we use IHS at k=3, then (CDKN2B, CDK4) will re-appear with RB1, thereby improving the relationship between these two genes. The results of the removal of some genes (CDK4, CDKN2A, CDKN2B, CYP27B1, ERBB2, MTAP, RB1, TP53, TSPAN31) and the use of IHS to detect additional gene sets are shown in Table 3. Table 3: The detected genes by using GA on GBM dataset K Fitness Gene set 2 43 PIK3R1 PTEN 5 50 EGFR GRIA2 PIK3CA PIK3R1 PTEN 7 52 EGFR GRIA2 RELN IQSEC3 PIK3CA PIK3R1 PTEN HRC EGFR GRIA2 PIK3CA PIK3R1 PTEN TRIM32 ACP1 KLK2 EGFR GRIA2 PIK3CA PIK3R1 PTEN 10 55 AZGP1 EGFR GRIA2 PIK3CA PIK3R1 PRNP PTEN RELN SH3YL1 RUVBL2 CSF1R EGFR GRIA2 IRF2BP1 NOTCH1 PIK3CA PIK3R1 PTEN TRIP11 TUSC3 CSF1R EGFR GRIA2 MAP2 PIK3CA PIK3R1 PTEN RELN SH3YL1 KLK7 The suggested methods exhibit performance superior to that of GA. GA satisfactorily performs compared with binary linear programming (provides an exact solution) in terms of time; although GA cannot identify the optimal solution in some datasets, its results are acceptable. IHS cannot outperform GA in terms of time but exceeds the number of solutions generated by the latter (Figure 3), indicating that IHS can generate more pathways that interact with one another to cause cancer. Fig. 4: number of suggested genes using GA and IHS for GBM The analysis of cancer genome data presents many computational challenges, prompting us to develop a GA method and apply it on GBM and OC datasets. The enhancements to conventional GA enable us to achieve good results in terms of simulation time and ranking of desired genes. We also propose a new IHS, an improvement to the HS algorithm, to identify a suitable solution to the maximum weight submatrix problem. Adding a crossover operation is a good step forward in identifying a new algorithm or enhancing an existing one. We apply IHS on the GBM dataset, generating more gene set solutions than does GA. EGA also exhibits better simulation time.IV. Improved Harmony Search Algorithm
V. Biological Dataset
VI. Results and Discussion
VII. Conclusion
References Enhanced Metaheuristic Algorithms for the Identification of Cancer MDPs
- F. Vandin, E. E. Upfal, B. J. Raphael. Algorithms and Genome Sequencing: Identifying Driver Pathways in Cancer. IEEE Internet Computing, v16,2012, pp. 39-46.
- C. Swanton, C. Caldas. Molecular classification of solid tumours: towards pathway driven therapeutics. Br J Cancer, v100, n10, 2009, pp.1517-1522.
- P. Spellman. Integrated genomic analyses of ovarian carcinoma. Nature, v474, 2011, pp. 609-615.
- R. Beroukhim, G. Gad, N. Leia, et al. Assessing the significance of chromosomal aberrations in cancer: methodology and application to glioma. Proc. Natl. Acad. Sci. USA, v104, n50, 2007, pp. 20007-20012.
- J. Zhao, S. Zhang, W. Ling-Yun, XS. Zhang Efficient methods for identifying mutated driver pathways in cancer. Bioinformatics, v28, n22, 2012, pp. 2940-2947.
- M. D. Leiserson, D. Blokh, R. Sharan, B. J Raphael. Simultaneous Identification of Multiple Driver Pathways in Cancer. PLoS Comput. Biol., v9, n5, 2013, e1003054.
- A. David, L. Oren, K. Jessica, et al. An integrated approach to uncover drivers of cancer. Cell, v143, n6, 2010, pp.1005-1017.
- C. Yan, Z. Y. Wang, Y. Cai, Y. N. Wu. A Genetic Algorithm for Detecting Communities in Large-scale Complex Networks. ACS, v13, n1, 2010, pp. 3–17.
- D. Zou, L. Gao, J. Wu, S. Li, Y. Li. A novel global harmony search algorithm for reliability problems. Computers & Industrial Engineering, v58, 2010, pp. 307–316.
- D. Bernert, L. Coelho. An improved harmony search algorithm for synchronization of discrete-time chaotic systems. Chaos, Solitons and Fractals, v41, 2009, pp. 2526–2532.
- Z. W. Geem. Improved Harmony Search from Ensemble of Music Players, Lecture Notes in Artificial Intelligence v4251, 2006, pp. 86-93.
- D. L. Masica, R. Karchin. Correlation of somatic mutation and expression identifies genes important in human glioblastoma progression and survival. Cancer Res., v71, 2011, pp. 4550-4561.
- R. G. Verhaak, K. A. Hoadley, E. Purdom. Integrated genomic analysis identifies clinically relevant subtypes of glioblastoma characterized by abnormalities in PDGFRA IDH1, EGFR, and NF1. Cancer Cell, v17, n1, 2010, pp. 98-110.
