Enhancing Jakarta Faces Web App with AI Data-Driven Python Data Analysis and Visualization

Author: Bala Dhandayuthapani V.
Journal: International Journal of Information Technology and Computer Science @ijitcs
Article in issue: 5 Vol. 16, 2024.
Free access
Python is widely used in artificial intelligence (AI) and machine learning (ML) because of its flexibility, adaptability, rich libraries, active community, and broad environment, which makes it a popular choice for AI development. Python compatibility has already been examined with Java using TCP socket programming on both non-graphical and graphical user interfaces, which is highly essential to implement in the Jakarta Faces web application to grab potential competitive advantages. Python data analysis library modules such as numpy, pandas, and scipy, as well as visualization library modules such as Matplotlib and Seaborn, and machine-learning module Scikit-learn, are intended to be integrated into the Jakarta Faces web application. The research method uses similar TCP socket programming for the enhancement process, which allows instruction and data exchange between Python and Jakarta Faces web applications. The outcome of the findings emphasizes the significance of modernizing data science and machine learning (ML) workflows for Jakarta Faces web developers to take advantage of Python modules without using any third-party libraries. Moreover, this research provides a well-defined research design for an execution model, incorporating practical implementation procedures and highlighting the results of the innovative fusion of AI from Python into Jakarta Faces.
Data Analysis, Visualization, Interoperability, Jakarta Faces, Matplotlib, Python, Seaborn, TCP, Web App
Short address: https://sciup.org/15019507
IDR: 15019507 | DOI: 10.5815/ijitcs.2024.05.03
Text of the scientific article Enhancing Jakarta Faces Web App with AI Data-Driven Python Data Analysis and Visualization
In the digital age, efficiently analyzing and visualizing data is crucial for decision-making and strategic planning. Python has emerged as a leading language for data analysis and visualization due to its powerful libraries and ease of use. Python is a popular choice for data analytics due to its simplicity, rich library ecosystem, and active community, which makes it an ideal choice for data analytics [1]. Python's versatile data analysis library modules, including numpy, pandas, and scipy, as well as visualization libraries, including Matplotlib, Seaborn, Ggplot, Plotly, Geoplotlib, Bokeh, Folium, Altair, and Pyga, and machine-learning module Scikit-learn enable developers to generate visual representations of data quickly and efficiently, aiding in understanding complex information and making informed decisions.
Jakarta Faces[2], formerly Java Server Faces (JSF), is a Java-based component framework for web applications. It offers a well-defined programming model and various tag libraries. Web pages, called Facelets pages, serve as the presentation layer for these applications. The component tags are used to add components and wire them to server-side objects. To add components, the page needs access to the Java Faces HTML render kit tag library and the Jakarta Faces core tag library.
Programming language interoperability [3] refers to the seamless communication and execution of source code from multiple programming languages within a system. Language mapping allows programmers to reuse functionality from other languages and address specific problem areas. This interoperability [4,5] is crucial in distributed computing environments, logic programming languages, and cloud computing. Flexible language interoperability [6] emphasizes the need for adaptive systems that can integrate multiple languages efficiently. The current state of cloud computing interoperability [7] highlights the importance of standardized protocols and interfaces.
In recent years, the need for integrating Python's powerful data analysis capabilities with Java's robust application frameworks has become increasingly important. This integration explores through the implementation of Python interoperability in Java GUI applications using TCP socket communication [8], offering a practical solution for seamless data exchange between these two popular programming environments. Consequently, Python's AI data-driven capabilities can be integrated with Jakarta Faces web applications. The integrated solution can ensure cross-platform compatibility, enables Python integration without affecting the existing Java codebase, and assumes a compatible communication method within a single application environment. Java is a preferred high-performance project, and Python's interoperability allows for easy scripting and robust system integration. Python's interoperability within Java can provide an effective library for Jakarta Faces. However, integrating Python's data and visualization capabilities within Java web application development can exhibit an innovative experiment. This integration of process brings Python interoperability of machine learning models into Java-based production systems and can enhance collaboration and efficiency.
This research aims to bridge the gap between Python and Java by integrating Python-based data analysis and visualization capabilities into Jakarta Faces web applications using TCP socket programming. The research explores the benefits and drawbacks of this integration, with an emphasis on data and visualization frameworks particularly Matplotlib and Seaborn. It also investigates the integration of Python-based machine learning models into Java production systems to enhance team collaboration and efficiency. The primary objective of this research is to streamline workflows for Java data scientists by incorporating Python modules seamlessly into Jakarta Faces. The outcome of this research is bounded to a well-defined research design for an execution model, incorporating practical implementation code snippets and showcasing the innovative fusion of AI from Python into Jakarta Faces.
The significance of this study lies in its potential to enhance various fields such as finance, healthcare, and education, where real-time data visualization is invaluable. The ability to leverage Python's powerful libraries within Jakarta Faces web applications can lead to improved decision-making processes, more efficient data management, and enhanced overall functionality of web-based systems. This research sets the stage for future advancements in integrating AI and machine learning models into web applications, potentially transforming how data is utilized across different sectors. This article is structured as follows: Section 2 reviews related work, Section 3 details the methodology, Section 4 presents the results and discussion, and Section 5 discusses the conclusion and future directions.
2. Related Works
The work on cross-language interoperability [9] in multi-language runtimes resulted in substantial improvements in efficient multi-language environments, allowing for smooth collaboration among various programming languages. Cloud portability and interoperability [10] emphasize the significance of interoperability profiles and standards in facilitating seamless communication and data exchange across diverse cloud systems. A method for achieving software interoperability [11] based on data analysis focused on analyses software data to establish interoperability, contributing insights into practical methods for achieving compatibility among different software applications. A case study comparing Java and Python [12] focuses on how language syntax impacts program complexity. The findings shed light on the differences in syntax structures and their direct correlation with program complexities, providing insights into the programming practices adopted in different languages. Data visualization aids in gaining insights from complex datasets, highlighting the importance of intra-socket and inter-socket communication [13] in multi-core systems for optimizing system performance.
The visualization of real-world enterprise data using the Python Django framework [14] showcasing the framework's capability to handle and represent complex datasets effectively. Their study underscores the utility of Django in developing scalable and interactive data visualization applications for enterprise environments. Application for sales data [15] analysis and visualization using Python and Django, demonstrating the effectiveness of these technologies in providing actionable business insights through comprehensive data representation highlights the practical applications of data visualization tools in enhancing business decision-making processes. A comprehensive review assessing the performance of various Python data visualization libraries [16], examining their efficiency, usability, and suitability for different types of data analysis tasks. Their evaluation offers valuable insights into the strengths and limitations of these libraries, guiding users in selecting the appropriate tools for their specific visualization needs.
Python data visualization techniques [17] highlight the diverse applications and effectiveness of displaying complex datasets. The use of Matplotlib and Seaborn libraries in showcasing Python's libraries' efficacy in data science [17,18]. The data analysis using Python [19] expands the capabilities of data manipulation and visualization. A comparative analysis [20] was conducted by Matplotlib and Seaborn in Python for data visualization, providing insights into their respective strengths in various applications. A Python-based data visualization and teaching system outlining a configurable system for data visualization tailored for educational purposes [21]. Investigated Python data visualization technology [22], exploring the advancements, methods, and applications of Python-centric data visualization approaches. An investigation on advancements in data visualization technology [23] based on Python, highlighting the development of interactive and dynamic visualization techniques, emphasizes the potential of Python in enhancing data interpretation and user engagement through innovative visualization methods. The performance of various Python data visualization libraries [24] reviewed evaluating their efficiency, usability, and effectiveness for diverse data analysis tasks, offer critical insights into the comparative advantages of these libraries, aiding users in selecting the most appropriate tools for their visualization requirements
The importance of web-based visualization tools [25] is highlighted for genomic data and fusion engineering design. A cross-platform platform for web-based interactive data visualization [26] is enhancing data exploration in bioinformatics due to its growing importance. A web-based protein data visualization library [27], leveraging Python for data analysis and visualization. The study [28] explores distributed design for incorporated settings, substantial discovery analysis, and visualization methodologies, potentially exploring the best practices for these tasks. Innovative methods for enhancing scientific data visualization in immersive environments [29], thereby enhancing user interaction and facilitating data interpretation. A programmable web platform for distributed data access, analysis, and visualization in fusion engineering and design [30] can promote collaboration and exploration through data analysis and visualization. The web application showcased in SoftwareX [31] offers process mining and interactive visualization capabilities, likely showcasing a comprehensive solution for data analysis and visualization. The study [32] aims to explore methodologies for defining and visualizing process execution variants from partially ordered event data in the information sciences.
A comprehensive review [33] conducted for data visualization tools detailing their features, strengths, and weaknesses, while a comparative analysis [34] of effective visualization techniques provides for multi-dimensional data, highlighting their applicability and efficiency. A survey data visualization analysis [35] based on explainable artificial intelligence, exploring its role in enhancing the interpretability of complex models, whereas the applications of data visualization technology [36] in artificial intelligence focusing on its contributions to improving AI model transparency and decision-making. The application of data visualization in enterprise data analysis [37], demonstrating how visualization tools can be leveraged for insightful business analytics and strategic planning.
The implementation of Python interoperability in Java GUI applications [8] focused on practical methods to establish interoperability between specific languages through TCP socket communication, addressing the technical aspects of communication protocols between Python and Java. Synthesizing the studies reveals a prominent gap in the literature concerning the seamless integration of Python's data analysis capabilities within Jakarta Faces through TCP communication. Python interoperability with Java GUI application research examined and took advantage of the Python library for Java GUI applications. The data observed and visualized in many graphs such as line, bar, histogram, scatter, pie, strip, swarm, heatmap, distplot, boxplot, and violin using Matplotlib and Seaborn via TCP sockets into Java GUI applications such as Java applet, Java Swing, and Java FX from a Python server.
The current body of knowledge emphasizes the importance of data analysis and visualization, language interoperability, and cloud standards, yet there exists a void in exploring the integration of Python within Jakarta Faces for efficient data analysis and visualization. The proposed research aims to bridge this gap by investigating and developing methodologies that facilitate the harmonious fusion of Python's data analysis capabilities with Jakarta Faces through TCP communication. This investigation aligns with the broader goals of enhancing web-based applications by leveraging Python's strengths in data analysis and visualization within the Jakarta Faces framework.
To ensure long-term interoperability of programming languages, integrate best practices and standards into the development process, such as the use of recognized data input formats and communication protocols. Python interoperability in Java can be performed in a variety of execution settings by employing TCP socket communication. We can implement any of the execution environments mentioned in the use cases. A local server and a local client were used to conduct and assess this research. Python and Java are two of the most popular programming languages, and combining Python and Java code may be appropriate in many situations. TCP socket programming, which allows network connections between applications operating on different machines, is one way that can be utilized with Python as a server and Jakarta Faces available via the client browser.
3. Methodology 3.1. Research Design
In this execution model, a Python server will be used as a server, which will have all the data analysis and visualization libraries. Jakarta Faces will receive all input commands from web clients, and then all the commands will be sent to a Python server, which will execute them and return the results to Jakarta Faces. Fig. 1 illustrates a three-tier architecture for a web application that integrates Python for data processing and visualization with Jakarta Faces for the web interface, deployed on the Glassfish server, and accessed by web clients through browsers like Chrome, Firefox, and Edge. In this setup, Python functions as a server responsible for handling data stored in CSV files and generating visualizations saved as images (e.g., plot.jpg). These processed data files and images are then communicated to a Jakarta Faces application, which is hosted on the Glassfish server. This middleware facilitates the integration of data and visualizations into the web interface. The web clients, represented by various web browsers, interact with this interface to access and view the data visualizations. The architecture emphasizes a smooth data flow from Python to the Jakarta Faces application, which then delivers the processed content to the end-users through their web browsers. This setup enables dynamic and interactive data-driven web applications, leveraging Python's analytical power and Jakarta Faces' robust web framework.
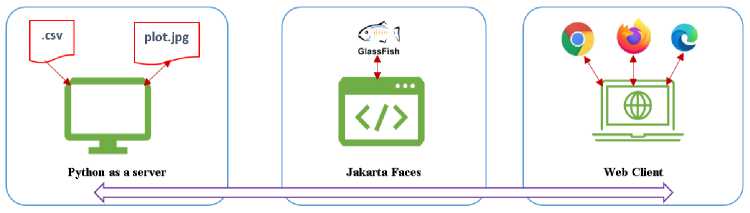
Fig.1. Execution model of python in JSF
The Jakarta Faces application can be created using NetBeans, as shown in Fig. 2. The figure illustrates the project structure of a web application named "WebClient" within an Integrated Development Environment (IDE). It includes key directories: Web Pages, containing the main web page index.xhtml and a resources subdirectory with an image file plot.jpg; Source Packages, holding Java source code like MyBean.java within the default package; Test Packages for test files; Libraries for external dependencies; Test Libraries for testing-specific libraries; and Configuration Files for necessary setup configurations. This structure facilitates the organization and development of a Jakarta Faces web application, integrating data visualizations likely generated by a Python server.
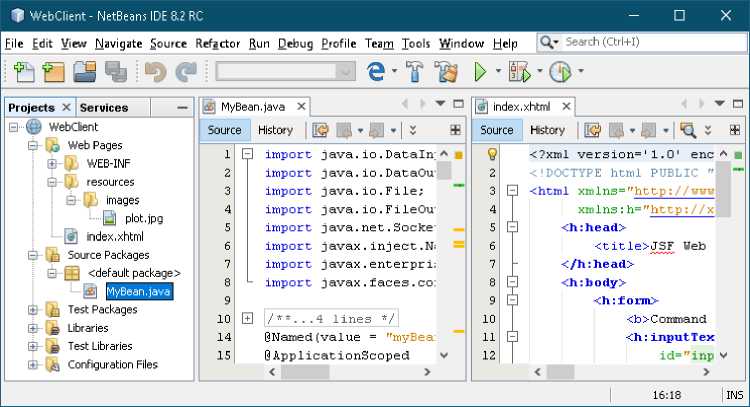
Fig.2. Jakarta faces project structure
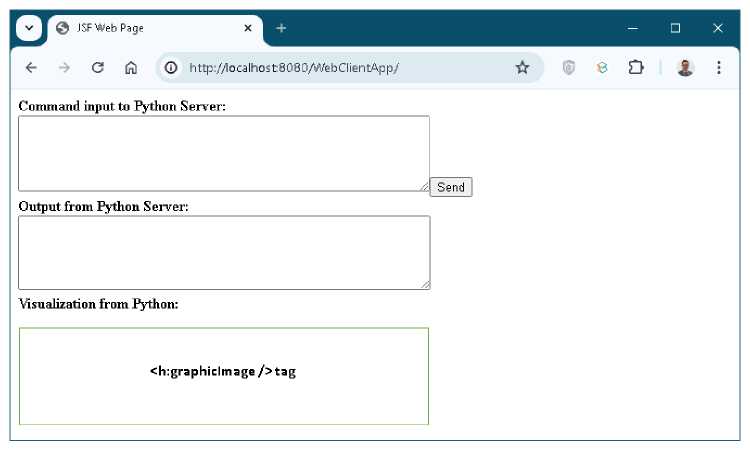
Fig. 3 shows the web interface of the "WebClient" application, hosted at `localhost:8080`, featuring three main sections. The **Command Input to Python Server** section allows users to input commands or data to be sent to the
Python server, with a "Send" button for submission. The **Output from Python Server** section displays responses from the Python server. The **Visualization from Python** section is intended for displaying visual data, such as charts or graphs, generated by the Python server, using the `h:graphicImage` tag. This setup facilitates interactive data processing and visualization directly within the web interface.
-
3.2. Procedures for TCP Communications
-
3.3. Python Server
This Python script sets up a TCP server that listens for incoming connections on a specified port (1234). It imports a variety of libraries for data manipulation (pandas, numpy), statistical operations (scipy), plotting (matplotlib, seaborn), machine learning (sklearn), and basic socket operations (socket). The server accepts connections and processes messages received from clients. If a message contains the string "exit()" or "quit()", the server will terminate. If a message ends with ".csv", it assumes the message is a filename, reads the CSV file into a panda dataframe, and confirms the load to the client. If a message starts with "chart", it saves the current matplotlib plot as an image file and sends it to the client. For other messages, it tries to execute the message as Python code and returns the result, ensuring numeric and floating-point outputs are handled correctly. Any errors are caught and sent back to the client before the server raises the exception. Overall, program1 interprets and processes client commands.
The technical implementation of the integration between Python and Jakarta Faces relies heavily on socket programming, enabling seamless communication between the two environments. The setup involves configuring a Python server to listen on a specified port for incoming commands from the Jakarta Faces client. The Python server comprises generating a system and IPv4 addressing and a TCP connection, binding it to the hostname and port number of the current system, and listening for incoming connections. When a connection is established, the server receives commands, executes them, and sends the results back to the client. Server manages client requests, interprets messages as commands, and processes them accordingly. If a command is exited or quit, the server terminates the connection. For CSV files, the server creates a data frame and sends an image. For other commands, Python code is executed. If errors occur, the server closes the connection and halts the program. The primary server loop accepts connections, receives messages, decodes them into strings, processes commands, and returns output to the client. If the command is an exit or quit request, the program is exited, the client connection is closed, and the iteration is terminated. If the command is a Python command, it is executed, and the output is captured. It returns the output to the client if it is numeric, floatingpoint, or a string. When an error occurs, exception handling is performed, which includes producing an error message, sending it back, shutting the client connection, and raising an exception to stop the program.
Jakarta Faces handles user commands, communicates with a Python server, processes data, and presents results. It divides multi-line commands, transmits them to the server, determines whether the request is an exit or quit, terminates the connection, and displays the output. It supplies a flexible user interface for working with Python code. Obtaining user input, separating multi-line commands, validating input length, creating a socket connection, and iterating over commands are all part of it. It also takes care of server answers, non-exit commands, "chart" instructions, and empty input. If the output is numeric, the algorithm refreshes the UI; otherwise, it prompts the user to provide a command. If an error occurs, an error message is printed, it is included in the output, and the UI element result is updated. It also deals with exceptions and ensures a pleasant user experience.
Potential challenges related to the interoperability between Python and Jakarta Faces primarily revolve around communication delays, error handling, security concerns, resource management, scalability, and maintenance. Communication delays can be mitigated by optimizing data transfer and using asynchronous communication. Comprehensive error handling and logging mechanisms are essential for identifying and resolving errors effectively. Security concerns can be alleviated by using SSL/TLS encryption and implementing strict authentication protocols. To manage resource contention, deploying Python and Jakarta Faces on separate servers and using containerization can be effective. Scalability can be achieved through load balancing and scalable cloud services. Proper documentation and the use of integrated development environments (IDEs) can simplify maintenance and debugging. By addressing these challenges with appropriate mitigation strategies, a robust and efficient integration between Python and Jakarta Faces can be achieved.
Program code 1: Python as a server [8]
try:
float(a_string)
return True except ValueError:
return False try:
s.bind((socket.gethostname() ,1234))
print(socket.gethostname())
s.listen(5)
while True:
if(xcode=="exit()" or xcode=="quit()"):
print("output-0: ",xcode)
elif(xcode.endswith(".csv")):
df = pd.read_csv(xcode)
print("output-00: ",xcode," loaded")
elif(xcode.startswith("chart")):
clt.sendall(image_data)
else:
exec(f"out= "+xcode) #, globlsparam, localsparam)
output=str(out)
if(output.isnumeric()):
print("output-1: ",out)
elif (is_float(output)):
print("output-1: ",output)
else:
print("output-2: ",output)
except Exception as err:
print(f"Unexpected {err=}")
error=str('Runtime Error: ') + str(err)
raise
-
3.4. Jakarta Faces
The provided XML snippet represents an XHTML file that incorporates Jakarta Faces components for creating a web page. This XHTML file creates a web page with Jakarta Faces components for sending commands to a Python server, displaying server responses, and presenting visualizations from Python, mainly through managed bean properties bound to different UI components. Here's a summary of the structure and functionalities:
"">
xmlns:h=" Program code 2: ">
Command input to Python Server:
Output from Python Server:
Program 2 represents a Jakarta Faces web page designed to interact with a Python server. The XML declaration and DOCTYPE specify the document type and encoding, ensuring it conforms to XHTML 1.0 Transitional standards. The `html` tag sets up the HTML document structure, with namespaces for standard HTML and JSF components. The `h:head` section includes a title for the webpage, and the `h:body` section contains the main content. Within the body, a form (`h:form`) allows users to send commands to the Python server. An input text area (`h:inputTextarea` with ID "input") lets users enter commands, which are bound to the `instruction` property of a backing bean (`myBean`). A command button (`h:commandButton`) triggers the `connect()` method of the backing bean to send the command to the server. The result from the server is displayed in another input text area (`h:inputTextarea` with ID "result"), bound to the `output` property of the backing bean. Additionally, an image (`h:graphicImage`) displays any visualization received from the Python server, specified by the `picFile` property of the backing bean and only rendered if `picFile` is not empty. The image is displayed with specified dimensions and an alternative text if no chart is available. The provided Program code 3 is a managed bean designed for Jakarta Faces applications.
import javax.enterprise.context.ApplicationScoped;
@Named(value = "myBean")
@ApplicationScoped public class MyBean { private String instruction;
private String output;
private String picFile;
public MyBean() { } public String getInstruction() { return instruction; } public void setInstruction(String instruction) { this.instruction = instruction; } public String getOutput() { return output; } public void setOutput(String output) { this.output = output; } public String getPicFile() { return picFile; } public void setPicFile(String picFile) { this.picFile = picFile; } public void connect(){
String output="";
try{
String sendData =getInstruction();
setInstruction("");
Socket s=null;
DataInputStream in=null;
DataOutputStream out=null;
for (String xcode : code ) { s=new Socket("192.168.56.1",1234); //10.153.70.91 192.168.0.106
in=new DataInputStream(s.getInputStream());
out=new DataOutputStream(s.getOutputStream());
output = ">>> "+ xcode + "\n"; //+ result.getText();
output += "Disconnected"+ "\n" + getOutput();
} else{ //receive from python byte[] bdata=new byte[64000];
String sdata="",edata="";
FacesContext facesContext = FacesContext.getCurrentInstance();
String path = (String) facesContext
.getExternalContext()
.getRealPath("/");
setOutput("Exist " + f.exists());
if(f.exists()) f.delete();
setOutput("Exist " + f.exists());
setOutput(output); // number data
} else{ output += ">>> "+ edata + "\n" + getOutput();
setOutput(output); //text data if(edata.contains("Runtime Error: ")) { output = "Connection Terminated, reconnect again..\n" + output;
setOutput(output); }
}
}
}
} else { output += "Type the command to send to the Python server..." + "\n" + getOutput(); setOutput(output);
}
}catch(Exception e1){ output += "Runtime Error" + e1.toString() + "\n" + getOutput(); setOutput(output);} }
}
Program code 3 defines a managed bean (`MyBean`) for a Jakarta Faces application, facilitating communication with a Python server over a TCP socket. The class is annotated with `@Named` and `@ApplicationScoped`, making it an application-scoped bean that can be accessed via its name (`myBean`). The bean includes properties for storing user instructions (`instruction`), server output (`output`), and the file path for a received image (`picFile`).
The `connect` method is the core functionality for interacting with the Python server. It begins by retrieving the instruction entered by the user and splitting it into individual commands. For each command, it establishes a socket connection to the server at the specified IP address and port (Ex. 192.168.56.1:1234). It sends the command to the server via a `DataOutputStream` and waits for the server's response using a `DataInputStream`.
If the command is "exit()" or "quit()", the method closes the socket and updates the output to indicate disconnection. For the "chart" command, it expects an image from the server. The method retrieves the web application's real path, deletes any existing plot image, saves the new image received from the server to a specific directory, and updates the output to confirm the image loading. For other commands, the method reads the response from the server, distinguishing between numeric and text data. It updates the output property with the server's response and handles any runtime errors by appending the error message to the output. Throughout the process, the bean's properties are updated to reflect the current state, ensuring that the web page displays the latest information from the server.
4. Result and Discussion
Python libraries Matplotlib with Pyplot, and Seaborn enable data analysis and visualization, aiding decisionmaking through graphs or charts, and promoting efficient machine learning and exploratory data analysis. The research utilized a dataset called "data.csv" with 47 rows, three columns, and 1 Not a Number (NaN) value for undefined or empty values. The Python server produces output based on various instructions, including output-0, output-00, output-1, and output-2. The "data.csv" sample was analyzed using Python pandas, Matplotlib, and Seaborn, and visualized in graphs like distplot, violin, and strip, demonstrating the versatility of Python libraries in various scenarios.
Table 1 displays the statistical analysis code in the Java web client and the output on the Python server, illustrating the results on the Jakarta Faces shown in Fig. 4. The figure displays the "WebClient" application's web interface showcasing user interaction with a Python server for data analysis. It includes a Command Input to Python Server section for entering commands, an Output from Python Server section showing the results of statistical analysis commands like correlation matrices, percentiles, standard deviation, mean, and dataframe dimensions, and a Visualization from Python section intended for displaying visual data, which is currently empty. This setup demonstrates the application's ability to perform detailed data analysis and provide immediate feedback within the web interface.
Table 1. Statistical analysis
|
Web Client Input |
Python Server Output |
|
data.csv df.shape np.mean(df) np.median(df) np.std(df) np.percentile(df.area, 75) df.corr() |
output-00: data.csv loaded output-2: (44, 3) output-2: area 2020.260870 rooms 3.152174 price 340967.28260 dtype: float64 output-1: nan output-2: area 783.283541 rooms 0.750866 price 124982.074608 dtype: float64 output-1: nan output-2: area rooms price area 1.000000 0.566894 0.854541 rooms 0.566894 1.000000 0.459185 price 0.854541 0.459185 1.000000 |
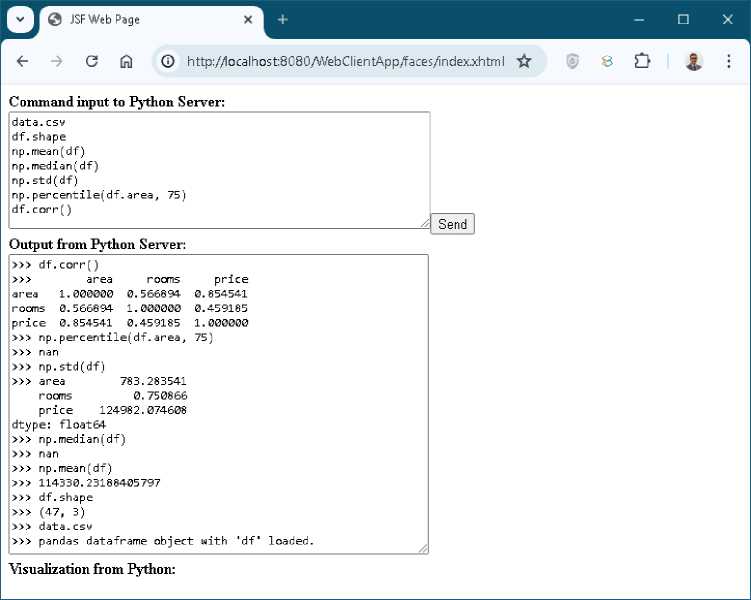
Fig.4. Statistical analysis
The output from the Python server provides a detailed summary of the dataset analysis and correlation. The data file data.csv has been successfully loaded (data.csv loaded). The dataset contains 44 rows and 3 columns (44, 3). The mean values for each column are as follows: area is 2020.26, rooms is 3.15, and price is 340,967.28 (area 2020.260870, rooms 3.152174, price 340967.28260). The standard deviation values are also provided: area is 783.28, rooms is 0.75, and price is 124,982.07 (area 783.283541, rooms 0.750866, price 124982.074608). Additionally, the correlation matrix indicates the relationships between the variables: area and price have a high correlation of 0.85, area and rooms have a moderate correlation of 0.57, and rooms and price have a moderate correlation of 0.46 (area rooms price area 1.000000 0.566894 0.854541 rooms 0.566894 1.000000 0.459185 price 0.854541 0.459185 1.000000). The output includes some missing values denoted as nan. This summary provides an overview of the dataset's structure, central tendencies, dispersion, and variable correlations.
Table 2 shows the Java web client code and Python server output for Jakarta Faces, which are used to illustrate the results in Fig. 5, including space, room, and price columns, as well as count, mean, median, standard deviation, minimum and maximum values.
Table 2. Describe dataframe
|
Web Client Input |
Python Server Output |
|
df.describe() |
output-2: area rooms price count 46.000000 46.000000 46.000000 mean 2020.260870 3.152174 340967.282609 std 791.938871 0.759163 126363.133932 min 852.000000 1.000000 169900.000000 25% 1442.250000 3.000000 249900.000000 50% 1889.000000 3.000000 299900.000000 75% 2284.500000 4.000000 392175.000000 max 4478.000000 5.000000 699900.000000 |
Output from Python Server section displays the results of the command df.describe(), which provides a statistical summary of the dataset. The summary includes count, mean, standard deviation, minimum, 25th percentile (25%), median (50%), 75th percentile (75%), and maximum values for the variables area, rooms, and price. The dataset consists of 46 observations. The mean values for area, rooms, and price are 2020.26 square units, 3.15 rooms, and $340,967.28, respectively. The standard deviations are 791.94 for area, 0.76 for rooms, and $126,363.13 for price, indicating the dispersion of values around the mean. The minimum values recorded are 852 square units per area, 1 room, and a price of $169,900. The first quartile (25%) values are 1442.25 square units, 3 rooms, and $249,900, while the median (50%) values are 1889 square units, 3 rooms, and $299,900. The third quartile (75%) values are 2284.5 square units, 4 rooms, and $392,175. The maximum values observed are 4478 square units per area, 5 rooms, and a price of $699,900. This summary offers a comprehensive overview of the distribution and variability of house areas, room numbers, and prices within the dataset.
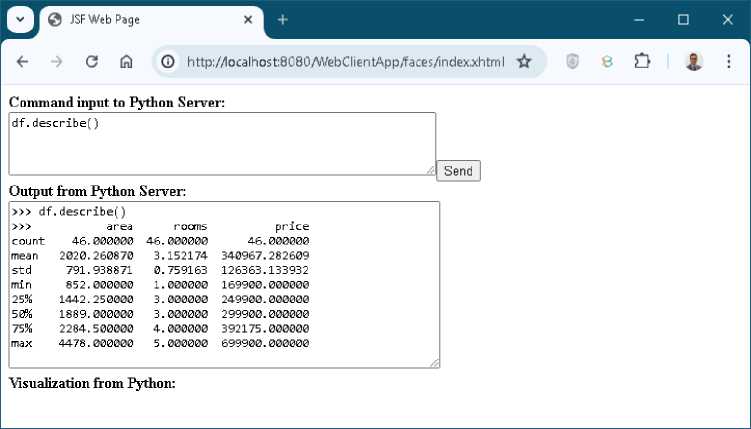
Fig.5. Describe dataframe
Table 3. Linear regression
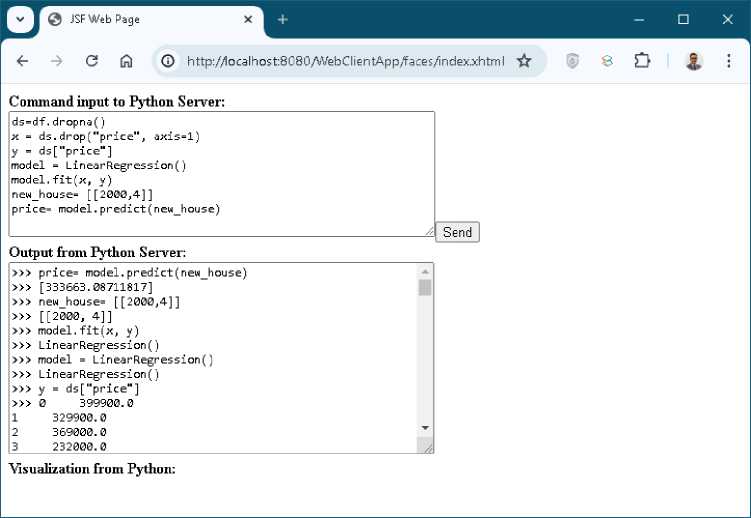
Table 3 shows Pandas library's continuation using Sklearn linear model, predicting a new price of 333663.08711817 for 2000 area and four rooms using linear regression shown in Fig. 6.
|
Web Client Input |
Python Server Output |
|
ds=df.dropna() x = ds.drop("price", axis=1) y = ds["price"] model = LinearRegression() model.fit(x, y) new_house= [[2000,4]] price= model.predict(new_house) |
output-2: LinearRegression() output-2: [[2000, 4]] output-2: [333663.08711817] |
Fig.6. Linear regression
The output from the Python server details the use of a linear regression model for predicting house prices. The first line indicates the initialization of the linear regression model (`LinearRegression()`). The second line shows the input data for the prediction, specifying a house with 2000 square units of area and 4 rooms (`[[2000, 4]]`). The third line provides the predicted price for this house, which is approximately $333,663.09 (`[333663.08711817]`). This output highlights the process of setting up the linear regression model, inputting the data, and obtaining a predicted house price. The dataset presently used is cleaned one, therefore it does not do cleaning process, however for different dataset, the data cleaning, handling missing values, normalization, standardization with the machine learning cycle can be done.
The Output from Python Server section shows the results of several Python commands related to predicting house prices. It includes the command price_model.predict(new_house), which outputs predicted prices for new houses with specific features. The output also details the initialization and training of a linear regression model using LinearRegression(), followed by fitting the model to the dataset with price_model.fit(). Additionally, it demonstrates further predictions based on the trained model, showcasing the model's ability to estimate house prices based on the given features.
Table 4 shows the code for a bar chart using Matplotlib. The x-axis label represents rooms, and the y-axis label represents the area. The output from the Python server describes the configuration of a bar chart. The first line indicates that the plot contains a bar container with 25 bar elements (`
Table 4. Barchart with matplotlib
Python Server Output output-2:
output-2: Text(0, 0.5, 'area')
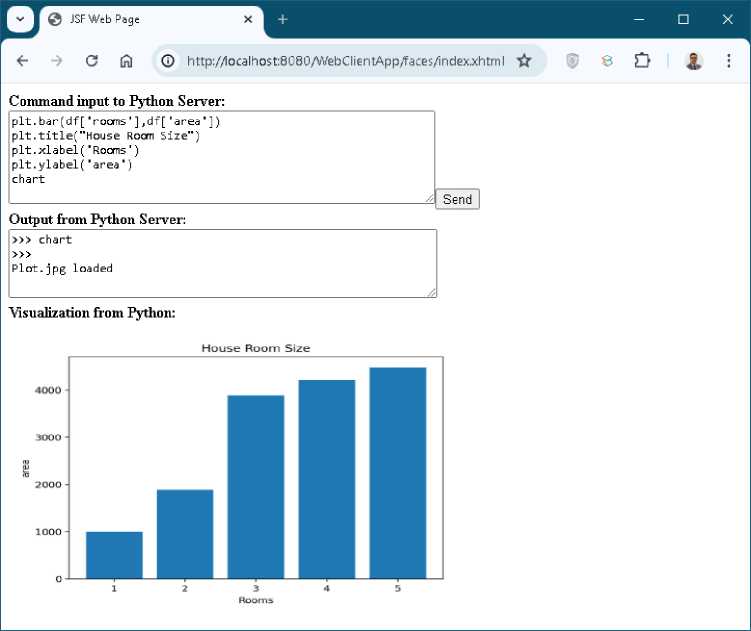
Fig.7. Bar chart with Matplot
The violin plot for Seaborn was created using Table 5, with x-axis labels representing rooms and y-axis labels representing prices. The title is "Violin plot," and output-2 was generated on the Python server. The output from the Python server describes the configuration of a boxplot titled "Boxplot." It specifies the title's position (`Text(0.5, 1.0, 'Boxplot')`), indicating that the title is centered at the top of the plot. Additionally, it provides the subplot's location and dimensions (`AxesSubplot(0.125,0.125;0.775x0.755)`), which determines where the boxplot is rendered within the figure window. This output details the structural attributes and the positioning of the title for the boxplot. In Fig. 8, the Visualization from Python section visualizes data processed by the Python server. It currently displays a violin plot representing the distribution of a dataset across different room sizes (1.0 to 5.0) on the x-axis, with the corresponding values on the y-axis. The violin price decreased from 20,000 to 40,000.
Table 5. Violin plot with seaborn
Python Server Output
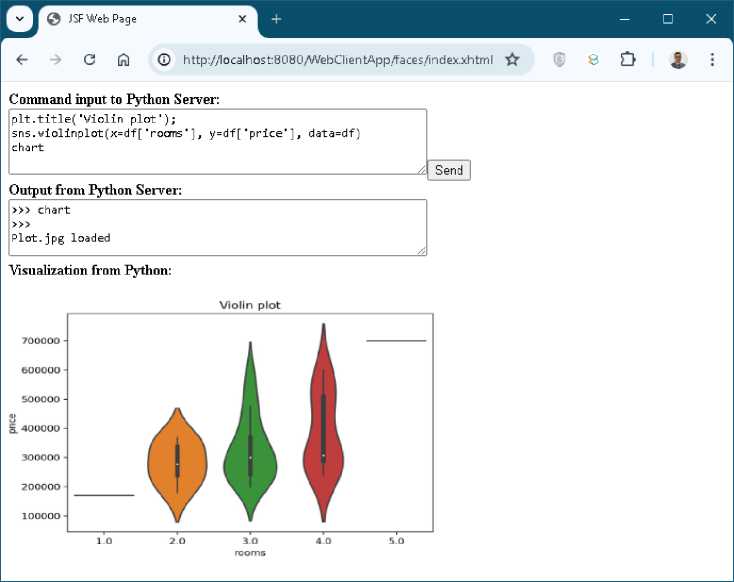
Fig.8. Violin plot with seaborn
The code used Table 6 to create a strip plot with x-axis labels for rooms and y-axis labels for area. The provided code snippet generates a visualization using Seaborn to explore the relationship between the area of houses and the number of rooms. The line plt.title('House Area') sets the title of the plot to 'House Area,' clearly indicating the focus of the visualization. The line ax=sns.stripplot(y=df['area'], x=df['rooms']) employs Seaborn's stripplot function to create a strip plot, which is particularly effective for showing the distribution of individual data points. In this plot, the y-axis represents the area of the houses (df['area']), and the x-axis represents the number of rooms (df['rooms']). Each point on the strip plot corresponds to a specific house, positioned based on its area and the number of rooms it has. This visualization helps in identifying patterns, clusters, and outliers in house areas across different room counts, providing valuable insights into how house size may correlate with the number of rooms shown in Fig. 9.
Table 6. Strip plot with seaborn
|
Web Client Input |
Python Server Output |
|
plt.title('House Area') ax=sns.stripplot(y=df['area'], x=df['rooms']) chart |
output-2: Text(0.5, 1.0, 'House Area') output-2: Axes(0.125,0.11;0.775x0.77) |
The provided output indicates the details of a matplotlib plot created to visualize house areas. The first line, Text(0.5, 1.0, 'House Area'), specifies the title of the plot, 'House Area,' which is positioned at the center of the x-axis (0.5) and at the top of the y-axis (1.0). This title succinctly informs the viewer about the subject of the plot. The second line, Axes(0.125,0.11;0.775x0.77), describes the dimensions and position of the plot's axes within the figure. Specifically, it states that the axes are located at coordinates (0.125, 0.11) relative to the figure's lower left corner, and they span a width of 0.775 and a height of 0.77 of the total figure size. These details together indicate that the plot is well-defined, with the title and axes positioned to provide a clear and informative visualization of the data.
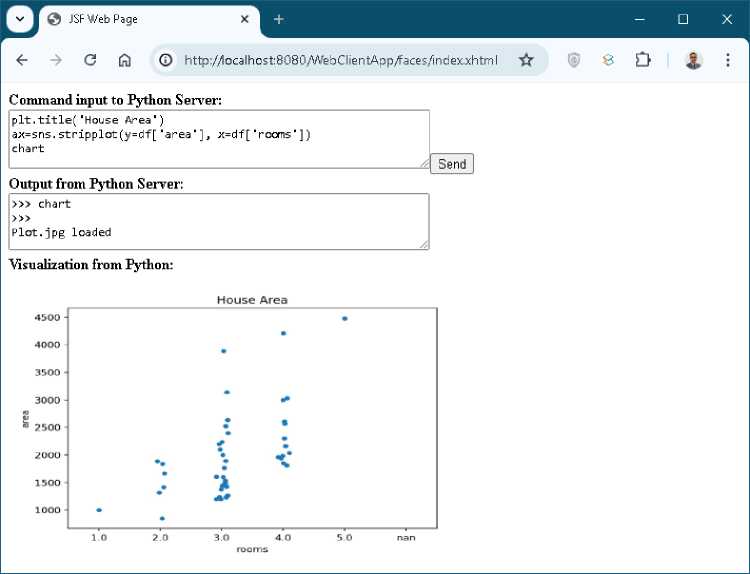
Fig.9. Strip plot with seaborn
The integration of Python with Jakarta Faces significantly enhances user experience by improving the usability and functionality of the web application. By leveraging Python's robust data analysis and visualization libraries, such as Matplotlib and Seaborn, users can benefit from sophisticated, real-time visual representations of complex datasets directly within the web interface. This integration allows for more intuitive data interaction, enabling users to gain insights quickly and make informed decisions based on dynamically generated charts and graphs. Additionally, the seamless execution of data processing tasks on the Python server, combined with the responsive design of Jakarta Faces, ensures that users experience minimal latency and high performance. The ability to handle extensive data manipulation and machine learning tasks within the web app reduces the need for users to rely on external tools, streamlining their workflow and increasing overall efficiency. This enhanced functionality makes the application more powerful and userfriendly, offering a comprehensive platform for data-driven decision-making and analysis. The integration improves user experience, reduces development time, and increases compatibility across platforms.
Enhancing Jakarta Faces Web App with AI Data-Driven Python Data Analysis and Visualization presents several challenges, including latency issues and error handling complexities from TCP socket communication, increased resource consumption, and scalability difficulties. Security concerns involve ensuring data privacy and securing communication. Maintenance and debugging are more complex and time-consuming, requiring proficiency in both Python and Java. The steep learning curve and managing dependencies to prevent conflicts between environments add to the overall challenge, especially in complex projects.
For future research, it is recommended to explore advanced machine learning integrations and real-time data processing capabilities within the Jakarta Faces and Python interoperability framework. Investigating the use of more sophisticated AI models, such as deep learning algorithms, could enhance predictive analytics and decision-making processes. Examining the integration of other Python visualization libraries, such as Plotly and Bokeh, could further enhance the user experience by providing interactive and dynamic visualizations. Practical implications of these findings suggest that businesses and academic institutions could leverage this integration to develop more robust, data-driven web applications, improving efficiency and user engagement. Future studies could also investigate the security aspects of this integration, ensuring data privacy and protection in a distributed environment. By addressing these areas, future research can contribute to the development of more powerful, scalable, and secure web applications that effectively harness the capabilities of both Python and Jakarta Faces.
5. Conclusions
This research demonstrates the successful integration of Python's robust data analysis and visualization capabilities with Jakarta Faces web applications through TCP socket communication, significantly enhancing the functionality and user experience of the web application. The practical implications of this integration are profound, providing a seamless platform for real-time data-driven decision-making within a web interface. Python's support for AI development comes through its libraries. NumPy and SciPy handle numerical and scientific computation; Pandas handles data manipulation;
and Matplotlib, along with Seaborn, addresses data visualization demands. Scikit-learn is an adaptable machinelearning tool for a variety of applications. This research technique saves development time, maintenance, usability, and system integration expenses and is simple to deploy, especially in small-scale applications. The research explores several execution environment paradigms to provide improved approaches for integrating Python libraries without the use of third-party libraries. It explains how to use Python built-in functions, string functions, collections, NumPy, SciPy, Pandas, and Scikit-Learn to perform data analysis and machine learning. This integration could assist a variety of areas, including data science, finance, engineering, and healthcare. For future research, it is recommended to explore the incorporation of advanced AI models, such as deep learning algorithms, to further enhance predictive analytics and decision-making processes. Investigating the integration of interactive Python visualization libraries, such as Plotly and Bokeh, may further improve user engagement and experience. Further research should also address the security aspects of this integration, ensuring robust data privacy and protection. And at the next level, it can adopt a low-code and nocode approach to AI-driven Python module-based data analysis and visualization techniques using the present research. The proliferation of low-code and no-code platforms generates a user-friendly environment, enhancing decision-making processes easily.
References Enhancing Jakarta Faces Web App with AI Data-Driven Python Data Analysis and Visualization
- A. Joshi and H. Tiwari, “An Overview of Python Libraries for Data Science,” J. Eng. Technol. Appl. Phys., vol. 5, no. 2, pp. 85–90, 2023, doi: https://doi.org/10.33093/jetap.2023.5.2.
- “Jakarta Faces Technology.” https://jakarta.ee/learn/docs/jakataee-tutorial/current/web/faces-intro/faces-intro.html
- K. Kratchanov and E. Ergün, “Language Interoperability in Control Network Programming,” vol. 7, no. 78, pp. 79–90, 2018.
- H.-A. Jacobsen, “Programming Language Interoperability in Distributed Computing Environments,” Distrib. Appl. Interoper. Syst. II, pp. 287–300, 1999, doi: 10.1007/978-0-387-35565-8_24.
- J. J. Cook, “Language interoperability and logic programming languages,” 2005, [Online]. Available: http://www.era.lib.ed.ac.uk/handle/1842/725
- T. Ekman, P. Mechlenborg, and U. P. Schultz, “Flexible language interoperability,” J. Object Technol., vol. 6, no. 8, pp. 95–116, 2007, doi: 10.5381/jot.2007.6.8.a2.
- N. Loutas, E. Kamateri, F. Bosi, and K. Tarabanis, “Cloud computing interoperability: The state of play,” Proc. - 2011 3rd IEEE Int. Conf. Cloud Comput. Technol. Sci. CloudCom 2011, pp. 752–757, 2011, doi: 10.1109/CloudCom.2011.116.
- Bala Dhandayuthapani V., "Python Data Analysis and Visualization in Java GUI Applications Through TCP Socket Programming", International Journal of Information Technology and Computer Science, Vol.16, No.3, pp.72-92, 2024.
- M. Grimmer, R. Schatz, C. Seaton, T. Würthinger, and M. Luján, “Cross-language interoperability in a multi-language runtime,” ACM Trans. Program. Lang. Syst., vol. 40, no. 2, 2018, doi: 10.1145/3201898.
- C. Computing and S. Committee, IEEE Guide for Cloud Portability and Interoperability Profiles (CPIP). 2020.
- T. Y. Shevgunov and G. V. Malshakov, “Method of Achieving Interoperability of Applied Software Based on the Analysis of Their Data,” 2020 Syst. Signals Gener. Process. F. Board Commun., 2020, doi: 10.1109/IEEECONF48371.2020.9078549.
- K. Munawar and M. S. Naveed, “The Impact of Language Syntax on the Complexity of Programs: A Case Study of Java and Python,” Int. J. Innov. Sci. Technol., vol. 4, no. 3, pp. 683–695, 2022, doi: 10.33411/ijist/2022040310.
- H. Subramoni, F. Petrini, V. Agarwal, and D. Pasetto, “Intra-socket and inter-socket communication in multi-core systems,” IEEE Comput. Archit. Lett., vol. 9, no. 1, pp. 13–16, 2010, doi: 10.1109/L-CA.2010.4.
- P. S. K. Manikanta Vamsi, P.Lokesh K. Neha Reddy, “Visualization of Real-World Enterprise Data using Python Django Framework,” s Sci. Eng. Pap., pp. 0–6, 2021, doi: 10.1088/1757-899X/1042/1/012019.
- D. Punasya, H. Kushwah, H. Jain, and R. Sheikh, “an Application for Sales Data Analysis and Visualization Using Python and Django,” Int. Res. J. Mod. Eng., no. 06, pp. 1757–1762, 2021, [Online]. Available: www.irjmets.com
- L. Addepalli et al., “Assessing the Performance of Python Data Visualization Libraries: A Review,” Int. J. Comput. Eng. Res. Trends, vol. 10, no. 1, pp. 29–39, 2023.
- A. Kumar Rathore and R. Rajnish, “Comprehensive review of data visualization techniques using python,” Amity J. Comput. Sci., vol. 3, no. 2, pp. 42–48, 2017.
- A. Oberoi and R. Chauhan, “Visualizing data using Matplotlib and Seaborn libraries in Python for data science,” Int. J. Sci. Res. Publ., vol. 9, no. 3, p. p8733, 2019, doi: 10.29322/ijsrp.9.03.2019.p8733.
- K. Nongthombam, “Data Analysis Using Python,” Int. J. Eng. Res. Technol., vol. 10, no. 07, pp. 463–468, 2021.
- A. H. Sial, S. Yahya, and S. Rashdi, “Comparative Analysis of Data Visualization Libraries Matplotlib and Seaborn in Python,” Int. J. Adv. Trends Comput. Sci. Eng., vol. 10, no. 1, pp. 277–281, 2021, doi: 10.30534/ijatcse/2021/391012021.
- J. Zhang, “Python based data visualization and configurable teaching system design and implementation,” Proc. IEEE Asia-Pacific Conf. Image Process. Electron. Comput. IPEC 2021, pp. 1136–1140, 2021, doi: 10.1109/IPEC51340.2021.9421127.
- S. S. Cao, Y. Zeng, S. Yang, and S. S. Cao, “Research on Python Data Visualization Technology,” J. Phys. Conf. Ser., vol. 1757, no. 1, 2021, doi: 10.1088/1742-6596/1757/1/012122.
- F. Li, “Research on Data Visualization Technology Based on Python,” Int. J. Multidiscip. Res. Anal., vol. 05, no. 05, pp. 907–910, 2022, doi: 10.47191/ijmra/v5-i5-03.
- L. Addepalli et al., “Assessing the Performance of Python Data Visualization Libraries: A Review,” Int. J. Comput. Eng. Res. Trends, vol. 10, no. 1, pp. 29–39, 2023, doi: 10.22362/ijcert/2023/v10/i01/v10i0104.
- W. Wu and W. S. Noble, “Genomic data visualization on the web,” Bioinformatics, vol. 20, no. 11, pp. 1804–1805, 2004, doi: 10.1093/bioinformatics/bth154.
- H. Li et al., “Visual Omics: a web-based platform for omics data analysis and visualization with rich graph-tuning capabilities,” Bioinformatics, vol. 39, no. 1, pp. 2–5, 2023, doi: 10.1093/bioinformatics/btac777.
- M. Sedova, L. Jaroszewski, and A. Godzik, “Protael: Protein data visualization library for the web,” Bioinformatics, vol. 32, no. 4, pp. 602–604, 2016, doi: 10.1093/bioinformatics/btv605.
- Y. C. K. Piao, N. Ezzati-Jivan, and M. R. Dagenais, “Distributed architecture for an integrated development environment, large trace analysis, and visualization,” Sensors, vol. 21, no. 16, pp. 1–29, 2021, doi: 10.3390/s21165560.
- R. Liu et al., “Narrative scientific data visualization in an immersive environment,” Bioinformatics, vol. 37, no. 14, pp. 2033–2041, 2021, doi: 10.1093/bioinformatics/btab052.
- F. Esquembre, J. Chacón, J. Saenz, J. Vega, and S. Dormido-Canto, “A programmable web platform for distributed access, analysis, and visualization of data,” Fusion Eng. Des., vol. 197, no. September, p. 114049, 2023, doi: 10.1016/j.fusengdes.2023.114049.
- I. Merkoureas, A. Kaouni, G. Theodoropoulou, A. Bousdekis, A. Voulodimos, and G. Miaoulis, “Smyrida: A web application for process mining and interactive visualization,” SoftwareX, vol. 22, p. 101327, 2023, doi: 10.1016/j.softx.2023.101327.
- D. Schuster, F. Zerbato, S. J. van Zelst, and W. M. P. van der Aalst, “Defining and visualizing process execution variants from partially ordered event data,” Inf. Sci. (Ny)., vol. 657, no. November 2023, p. 119958, 2024, doi: 10.1016/j.ins.2023.119958.
- A. Lavanya, S. Sindhuja, L. Gaurav, and W. Ali, “A Comprehensive Review of Data Visualization Tools : Features , Strengths , and Weaknesses,” Int. J. Comput. Eng. Res. Trends, no. March, 2023, doi: 10.22362/ijcert/2023/v10/i01/v10i0102.
- S. Gadiparthi, “Effective Visualization Techniques for Multi- dimensional Data : A Comparative Analysis,” Int. J. Sci. Res. (IJSR, no. May, 2024, doi: 10.21275/SR24501104057.
- S. Yin, M. Ibrar, and L. Teng, “Data Visualization Analysis Based on Explainable Artificial Intelligence : A Survey Data Visualization Analysis Based on Explainable Artificial Intelligence : A Survey,” IJLAI Trans. Sci. Eng., no. May, 2024.
- H. W. A. Yanyan Xia, “Applications of Data Visualization Technology in Artificial Intelligence,” Front. Business, Econ. Manag., vol. 15, no. 2, pp. 2–5, 2024.
- K. Qu, “Application of data visualization in enterprise data analysis,” MATEC Web Conf., vol. 01038, pp. 1–5, 2024, doi: https://doi.org/10.1051/matecconf/202439501038.
