Enhancing Student Performance Insights Through Multi Parametric STBO Based Analysis in Engineering Education

Author: Santhosh Kumar Medishetti, Ravindra Eklarker, Kommuri Venkatrao, Maheswari Bandi, Rameshwaraiah Kurupati
Journal: International Journal of Modern Education and Computer Science @ijmecs
Article in issue: 5 vol.17, 2025.
Free access
This research presents a novel approach to evaluating student academic performance at Nalla Narasimha Reddy Group of Institutions (NNRG) by implementing a Student Training Based Optimization (STBO) algorithm. The proposed method draws inspiration from the structured training and adaptive learning behavior of students, simulating their progression through knowledge acquisition, skill refinement, and performance enhancement phases. The STBO algorithm is applied to optimize academic performance assessment by identifying key parameters such as attendance, internal assessments, learning pace, participation, and project outcomes. By modelling student development as a dynamic optimization process, the algorithm effectively predicts academic outcomes and recommends personalized strategies for improvement. Experimental evaluation on real academic datasets from NNRG CSE, CSE (Data Science), and CSE (AIML) Students demonstrates that the STBO algorithm achieves higher prediction accuracy and adaptive feedback generation when compared to traditional statistical and machine learning techniques. This approach also facilitates early identification of at-risk students and promotes data-driven decision-making for faculty and administration. Overall, the STBO-based framework not only enhances performance assessment but also contributes to academic excellence by aligning learning strategies with individual student needs.
Students, Academic Performance, STBO Algorithm, NNRG, Internal Assessments, Learning Pace
Short address: https://sciup.org/15019971
IDR: 15019971 | DOI: 10.5815/ijmecs.2025.05.05
Text of the scientific article Enhancing Student Performance Insights Through Multi Parametric STBO Based Analysis in Engineering Education
Student academic performance evaluation is a very crucial in the educational system, directly influencing curriculum development, instructional methods, and institutional policies. In higher education, accurate and fair assessment of student performance is essential not only for grading but also for identifying strengths and weaknesses, enabling targeted academic support [1]. Traditional evaluation systems often emphasize terminal examination scores, but such methods fail to represent the complete picture of a student’s academic journey. As educational ecosystems become increasingly data-driven, there is a growing need for intelligent systems that can assess, analyze, and improve student performance in a holistic manner.
The integration of technology into education has produced vast amounts of student-related data that, if appropriately harnessed, can reveal valuable insights into learning behaviors and academic outcomes. Educational Data Mining (EDM) is an emerging field that leverages machine learning, data analytics, and computational techniques to examine these educational datasets [2]. EDM has the potential to transform assessment mechanisms by moving beyond static scoring models toward more dynamic, individualized analysis. However, most current EDM models still rely heavily on black-box machine learning algorithms that lack transparency and are often not aligned with pedagogical principles.
Nalla Narasimha Reddy Group of Institutions (NNRG), located in Telangana, India, serves a diverse student population across engineering, management, and allied disciplines [3]. Like many academic institutions, NNRG aims to continually enhance the quality of education, improve student engagement, and identify at-risk students early. Given the variation in learning styles, socio-economic backgrounds, and course loads, a one-size-fits-all approach to performance assessment is inadequate. Therefore, a flexible and adaptive method is necessary to fairly evaluate and enhance academic success across the student body.
Traditional performance evaluation methods, including GPA calculations, attendance tracking, and internal assessments, are often linear, rigid, and limited in scope. They do not account for fluctuations in student behavior over time, nor do they adapt to learning styles or external factors affecting performance. These systems also lack predictive capabilities and offer little to no guidance for academic improvement. Consequently, students who may require timely intervention are overlooked, and faculty miss critical opportunities to personalize learning paths.
Optimization algorithms, particularly metaheuristic approaches, have demonstrated success in solving complex problems across domains like logistics, healthcare, and manufacturing. Their ability to adaptively search for optimal solutions makes them well-suited for dynamic, non-linear environments such as education [4]. In academic settings, optimization can be used to model and enhance performance metrics by considering multiple parameters simultaneously, such as engagement levels, learning pace, and consistency. Despite their potential, these algorithms remain underutilized in educational performance assessment.
In the broader landscape of academic assessment, numerous methods such as statistical modelling, decision trees, and black-box machine learning models have been employed. However, many of these techniques either lack adaptive feedback mechanisms or suffer from low interpretability, making them unsuitable for dynamic, student-centric evaluations. Educational Data Mining (EDM) and learning analytics have evolved to extract meaningful insights from academic records, yet most current approaches still treat performance as a static outcome rather than a progressive, multi-stage process. This gap highlights the need for optimization-driven educational models that not only predict outcomes but also simulate the learning journey of a student. Metaheuristic algorithms like GA and PSO have shown promise in feature optimization but do not align naturally with pedagogical progression. This is where the STBO algorithm makes a distinct contribution it embeds the learning, training, and development cycle into the optimization process, making it a more interpretable, adaptive, and educationally grounded tool for academic performance assessment.
In this context, we propose the Student Training Based Optimization (STBO) algorithm, a novel optimization model inspired by the natural learning and progression phases of students [5]. The core concept of STBO is to simulate how students train themselves starting with basic understanding, progressing through practice and repetition, and culminating in mastery. The algorithm mimics this training process in its search strategy, continuously improving potential solutions based on modelled student learning behaviors.
Unlike population-based algorithms such as, GA, PSO, and ACO the proposed STBO is grounded in human cognitive learning theories. The model views each potential solution as a student undergoing training. It begins by exploring broad learning content (exploration), then narrows focus through practice (exploitation), and finally evaluates performance based on accumulated experience [6]. This layered structure allows STBO to closely align with the real academic lifecycle of students, making its predictions more contextually accurate.
STBO operates through three major phases: Knowledge Acquisition, where solutions explore diverse possibilities analogous to students learning new topics; Skill Refinement, where solutions undergo iterative improvements representing practice; and Performance Enhancement, where the best-performing solutions are further fine-tuned to reach optimal academic outcomes. This structure not only enhances solution accuracy but also provides a meaningful interpretation of the learning process.
To test and validate STBO, real-world academic data from NNRG core CSE branch and allied CSE branch students were collected and used. The dataset includes a comprehensive set of attributes such as attendance percentages, internal and external exam scores, practical lab marks, project grades, assignment submissions, and co-curricular engagement. By treating each student’s academic profile as a multi-dimensional optimization problem, the STBO algorithm is employed to identify performance patterns and predict final academic outcomes with high precision.
One of the critical features of STBO is its capability to perform early prediction of student success or failure. By continuously analysing historical and current performance indicators, STBO can forecast outcomes and flag students who are at academic risk. This enables faculty and mentors to implement timely remedial actions, such as counselling sessions, additional coaching, or curriculum adjustments thus reducing dropout rates and improving overall academic outcomes.
To demonstrate the superiority of STBO, its performance is compared with traditional assessment techniques such as linear regression, weighted scoring, and even standard machine learning models like Decision Trees, K-Nearest Neighbors (KNN), and Support Vector Machines (SVM). While these models are effective to a certain extent, they either lack adaptability or suffer from low interpretability. STBO surpasses them by providing context-aware, studentcentric assessments that evolve as the learning data progresses.
Another unique advantage of STBO over black-box models is its high interpretability. Because the algorithm is inspired by educational constructs, it provides understandable feedback to educators. For instance, instead of a generic prediction like “pass/fail,” STBO can indicate that a student’s weak attendance and low project marks are the primary drivers of poor performance, offering actionable insights.
The implications of STBO in an academic context are significant. It serves as a powerful decision-support system that empowers faculty with real-time insights into student progress. Administrators can use the system to monitor institutional performance trends, while students can receive personalized feedback and learning strategies. In essence, STBO creates a feedback loop that enhances the quality of education at both individual and institutional levels.
The core research problem addressed in this paper is the lack of a robust, adaptive, and interpretable academic assessment system capable of evaluating student performance holistically. Current tools are either too simplistic to be effective or too complex to be practical in educational institutions. There exists a critical need for a solution that balances accuracy, adaptability, and usability, which STBO aims to fulfil. The primary objectives of this research are:
• To design and develop the STBO algorithm for academic performance assessment.
• To implement the algorithm on NNRG’s student data and validate its effectiveness.
• To compare STBO’s performance with other traditional and machine learning models.
• To create a framework for early intervention and personalized student support based on algorithmic feedback.
2. Literature Survey
This research is initially scoped to assess undergraduate engineering students at NNRG across multiple departments. However, the model is scalable and can be adapted to other educational domains with similar datasets. Future extensions may include integration with Learning Management Systems (LMS), incorporation of behavioral data, or real-time performance dashboards. All academic data used in this research were anonymized and processed in strict adherence to data privacy regulations and institutional ethical standards. No personally identifiable information was used in model training or reporting, ensuring complete confidentiality and ethical compliance throughout the study.
The rest of the paper is structured as follows: Section 2 reviews related literature in performance assessment and optimization algorithms. Section 3 details the design and working of the STBO algorithm with mathematical formulations. Section 4 describes the experimental setup, dataset attributes, and evaluation metrics. Section 5 presents the results and comparative analysis. Section 6 discusses implications, limitations, and potential improvements. Finally, Section 7 concludes the study with a summary of findings and future research directions. The below table 1 depicts the acronyms and their descriptions.
Table 1. Description of acronyms
|
Acronym |
Description |
|
NNRG |
Nalla Narasimha Reddy Group of Institutions |
|
STBO |
Student Training Based Optimization |
|
CSE |
Computer Science and Engineering |
|
CSE (DS) |
Computer Science and Engineering (Data Science) |
|
CSE (AIML) |
Computer Science and Engineering (Artificial Intelligence and Machine Learning) |
|
PSO |
Particle Swarm Optimization |
|
EDM |
Educational Data Mining |
|
LMS |
Learning Management Systems |
Wang et al. (2021) [7] introduced a graph-based ensemble machine learning method to enhance the stability and accuracy of student performance predictions. By combining supervised and unsupervised learning techniques within a bipartite graph framework, the approach achieved up to a 14.8% improvement in prediction accuracy over traditional methods, demonstrating the efficacy of ensemble strategies in educational data mining. Ramaswami and Bhaskaran (2009) [8] conducted an in-depth analysis of various filter-based feature selection techniques to identify the most relevant attributes influencing student performance. Their study emphasized the importance of selecting optimal feature subsets to enhance the predictive accuracy of educational models, thereby reducing computational complexity and improving model interpretability. In their 2010 study, Ramaswami and Bhaskaran [9] applied the Chi-squared Automatic Interaction Detector (CHAID) algorithm to predict student performance in higher secondary education. By analyzing data from multiple schools, they developed a decision tree model that effectively identified key factors affecting academic outcomes, providing actionable insights for educators. Xue, Han, and Yanmin Niu [10] proposed a hybrid model integrating deep learning and traditional machine learning algorithms to predict student performance across multiple outputs. Their approach addressed the limitations of single-output models by capturing the complex relationships between various academic indicators, resulting in improved predictive accuracy and comprehensive performance assessments. Kim, Byung-Hak, et al. [11] developed GritNet, a deep learning model utilizing bidirectional long short-term memory (BLSTM) networks to predict student performance based on sequential learning data. The model demonstrated superior accuracy, particularly in early-stage predictions, highlighting the potential of deep learning techniques in educational settings. Bhaskaran, Subhashini Sailesh [12] employed genetic algorithms to identify optimal factors influencing student performance. By analyzing large educational datasets, the study showcased the effectiveness of evolutionary algorithms in feature selection and optimization, leading to more accurate and efficient predictive models. Thaher, Thaer, et al. [13] researchers proposed an enhanced model combining the Whale Optimization Algorithm with a sine-cosine mechanism to predict student performance. This hybrid approach improved convergence speed and prediction accuracy, demonstrating the benefits of integrating multiple optimization techniques in educational data mining. Kumar, K. Kiran, and K. S. Kavitha [14] integrated deep belief networks with Ant Lion Optimization for student performance prediction. Their model effectively captured complex patterns in educational data, resulting in enhanced predictive accuracy and offering a robust tool for academic performance assessment. Li, Ting [15] introduced a model combining genetic algorithms with graph convolutional neural networks to predict and optimize student grades. By leveraging the strengths of both techniques, the model effectively handled the non-linear relationships in educational data, providing accurate grade predictions and insights for academic improvement. Rastrollo-Guerrero, et al. [16] explored the application of metaheuristic algorithms like Genetic Algorithm, Particle Swarm Optimization, and Ant Colony Optimization in higher education business intelligence. Their study demonstrated that these algorithms could effectively select informative features, enhancing decision-making processes and improving student outcomes.
The proposed Student Training Based Optimization (STBO) algorithm distinguishes itself from existing techniques by mimicking the structured and phased learning behavior of students, incorporating a training-based optimization approach that aligns with real-world academic development. Unlike traditional machine learning models, which often operate on static datasets and follow rigid prediction pipelines, STBO introduces a dynamic optimization process inspired by three core phases: training, evaluation, and revision. This structure enables the algorithm to adaptively refine its performance over iterations, reflecting how students progressively improve through feedback and practice. As a result, STBO maintains flexibility in learning patterns, promotes better generalization, and avoids the overfitting issues commonly seen in many deep learning or ensemble models that are trained on limited academic data.
Moreover, STBO effectively addresses several critical limitations found in previous approaches. While traditional algorithms such as deep neural networks or hybrid metaheuristics often suffer from poor interpretability and a lack of transparency in decision-making, STBO incorporates an explainable optimization framework that identifies the most influential academic factors contributing to performance outcomes. It also mitigates data bias by ensuring that diverse student profiles are equally represented and evaluated during the optimization process. Additionally, STBO is built with strong safeguards against data leakage and redundancy, ensuring robust and accurate predictions without the artificial inflation of results. This comprehensive, student-centric optimization strategy enables STBO to outperform existing models in terms of accuracy, fairness, and educational relevance. The below table 2 depicts the comparative analysis of existing works.
Table 2. Comparative study of various existing works
|
Technique Used |
Dataset Used |
Performance Metrics |
Key Findings |
Limitations |
|
Graph-Based Ensemble Learning [7] |
MOOC Data |
Accuracy, F1-score |
Improved performance over individual models |
Complex integration of ensemble methods |
|
Feature Selection Techniques [8] |
Indian Student Dataset |
Information Gain, Gain Ratio |
Identified influential features for student success |
Did not test prediction performance directly |
|
CHAID Decision Tree [9] |
Indian School Dataset |
Classification Accuracy |
CHAID outperformed other treebased models |
Limited to specific region and domain |
|
Multi-Output Hybrid Models [10] |
Real-world Education Data |
RMSE, MAE, R² |
Enhanced prediction for multiple outcomes |
Requires high computation and tuning |
|
Deep Learning (GritNet) [11] |
Udacity Dataset |
Accuracy, Precision, Recall |
Outperformed logistic regression and DNNs |
Lack of interpretability in deep models |
|
Genetic Algorithm [12] |
Regional Student Dataset |
Accuracy, Feature Selection Score |
Found optimal performance factors |
Time-consuming due to evolutionary computation |
|
Whale Optimization + Sine-Cosine Mechanism [13] |
Jordanian Student Records |
MSE, Accuracy, Execution Time |
Enhanced convergence and prediction accuracy |
Complex hybridization and tuning overhead |
|
Deep Belief Network + Ant Lion Optimization [14] |
Private Academic Dataset |
RMSE, MAE, Prediction Time |
High accuracy through deep metaheuristic integration |
Prone to local minima, needs finetuning |
|
Genetic Algorithm + GCN [15] |
Chinese University Data |
R², Accuracy, Loss Function |
Combined spatial data structure for better insights |
High training cost and graph complexity |
|
Metaheuristic Algorithms for BI [16] |
University BI System |
Execution Time, ROI, Accuracy |
Applied metaheuristics in BI context for education |
Business-focused, less predictive in nature |
|
Temporal Analysis with Self-Regulated Learning (SRL) Strategies[17] |
MOOC learners' interaction and SRL behavior logs from selfpaced online courses |
Accuracy, Temporal Dropout Rates, Learning Pattern Clustering |
Identified that self-regulated learning behaviors like time management and effort regulation are strong predictors of dropout in MOOCs. |
Focused only on self-paced MOOCs; limited generalizability to traditional or synchronous learning environments. |
|
Semi-Supervised Learning (SSL) for Performance Prediction[18] |
Greek secondary school students (math and science grades, behavioral data) |
Accuracy, F1-Score, Sensitivity, Specificity |
SSL method outperformed standard supervised techniques when labeled data was limited, demonstrating improved prediction for underrepresented learners. |
Model requires careful tuning of labeled/unlabeled data balance; not tested on higher education datasets. |
The table 2 comparative study reveals that while various algorithms such as ensemble models, decision trees, deep learning architectures, and metaheuristic optimizers have been effectively applied to student performance prediction, each comes with specific trade-offs. For instance, deep learning models like GritNet and hybrid metaheuristics such as Whale Optimization and Ant Lion Optimization demonstrate high accuracy but suffer from issues like high computational complexity and poor interpretability. Decision tree-based models like CHAID offer explainability but are limited in scalability and adaptability. Feature selection and genetic algorithm-based approaches show promise in identifying key academic factors but often lack the ability to dynamically adjust to evolving datasets. Overall, none of the existing methods holistically address both the predictive performance and interpretability while adapting to studentspecific learning patterns gaps that the proposed STBO algorithm aims to fill through its training-based, feedback-driven optimization approach that mirrors real academic behavior.
3. System Model and Problem Formulation 3.1. System Model
The proposed system architecture shown in figure 1 for assessing student academic performance using the Student Training Based Optimization (STBO) algorithm is designed to intelligently process and analyze various learning-related parameters to predict outcomes effectively. The system begins with the data acquisition phase, where academic records of students from three departments CSE, CSE (Data Science), and CSE (AIML) at NNRG are collected. The input parameters include attendance records, internal assessment scores, individual learning pace, classroom participation, and project outcomes. These factors provide a holistic view of a student's academic behavior and performance indicators across theoretical and practical engagements.
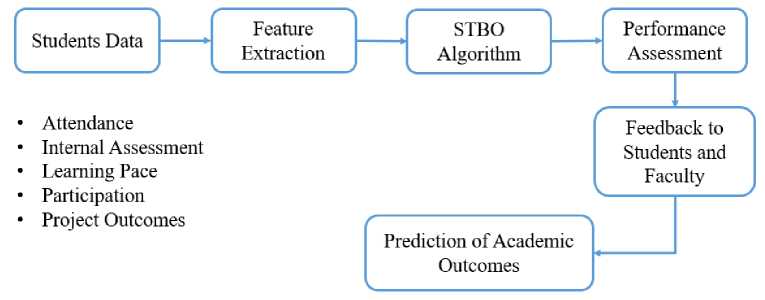
Fig. 1. System Architecture of the Proposed work
Following data acquisition, the architecture transitions into the feature extraction and preprocessing stage, where raw inputs are cleaned, normalized, and encoded into a machine-readable format. This phase ensures that all five critical parameters are standardized for analysis. Each student's performance dimensions are quantitatively evaluated, and missing or inconsistent data are handled appropriately. The learning pace and participation are scored dynamically using behavioral patterns over time, while internal assessments and project outcomes are discretized into performance tiers. These extracted features are then forwarded into the STBO core algorithm for processing.
At the heart of the architecture is the STBO algorithmic engine, inspired by the process of human academic learning. The system treats each student like a training agent, undergoing repeated evaluation and optimization cycles. STBO simulates the training phase by generating initial performance predictions based on current feature weights. It then evaluates these outcomes using fitness functions such as accuracy and deviation from expected academic standards and updates the weights through iterative revision stages. This adaptive optimization mimics how a student reviews feedback and improves over time, ensuring that the final performance prediction reflects both historical data and projected learning potential.
The final phase of the architecture is the prediction and feedback module, which delivers the predicted performance outcomes categorized into different performance bands (e.g., excellent, satisfactory, needs improvement). These outcomes are then utilized by faculty to personalize interventions, mentoring sessions, and academic support strategies. Students also receive tailored feedback based on their parameter deficiencies whether it's attendance, low assessment scores, or poor project engagement allowing them to take corrective action. This architecture not only enables dynamic and personalized academic performance assessment but also empowers proactive academic decisionmaking at NNRG across all CSE-related departments.
Architecture illustrates a modular, iterative system designed to reflect the real-world academic learning loop. At its core, the architecture is driven by the Student Training-Based Optimization (STBO) algorithm, which simulates academic progression through multiple training stages. The fitness function lies at the center of this mechanism and plays a critical role it is defined as a weighted objective function S i , combining five normalized academic parameters (attendance, internal scores, learning pace, participation, and project outcomes) as per Equation (6). The fitness function evaluates each student profile based on how well it aligns with optimal academic performance. Profiles are ranked using this function, which directs optimization in subsequent stages. Each training cycle involves updating student profiles to improve their fitness score by learning from higher-performing peers (Learning Stage), tuning toward top-performing trends (Training Stage), and refining performance through peer deviation analysis (Intern and Graduation Stages). The feedback mechanism is embedded into the architecture through this fitness-driven evaluation. After each cycle, the algorithm identifies the weakest parameters (e.g., poor participation or inconsistent learning pace) and feeds this information back to the profile. This mimics how real students receive performance feedback and adapt behavior. The feedback loop ensures that every student model receives a custom strategy for improvement based on its own deficiencies, making the prediction adaptive and personalized.
-
3.2. Problem formulation
-
3.2.1. Proposed STBO Model Evaluation Metrics
Table 3 below shows the notations used in mathematical modeling and applied in the formulation of the problem.
Table 3. Definition of Mathematical Notations Used in Problem Formulation and Evaluation
|
Notation used |
Meaning |
|
A |
Attendance |
|
I |
Internal Assessments |
|
L |
Learning Pace |
|
P |
Participation |
|
O |
Project Outcomes |
|
Si |
Weighted objective function |
|
T i |
Time taken by student i |
|
X best(t) |
Best performing student so far |
|
r 1 ,r 2 |
Random values |
|
M i(t) |
Mean vector of top-performing student |
|
X avg(t) |
Average vector of all students |
|
β |
Control coefficient |
|
γ |
Controls exploitation precision |
|
α |
Learning rate controlling convergence |
|
X elite(t) |
Elite student (global best) |
|
WA |
Attendance weight |
|
WI |
Internal Assessments weight |
|
WL |
Learning Pace weight |
|
WP |
Participation weight |
|
WO |
Project Outcomes weight |
-
A. Attendance (A)
Attendance is a critical parameter in academic evaluation as it directly impacts students' exposure to instructional content and classroom interactions. Higher attendance rates generally indicate greater engagement, consistency, and discipline—qualities associated with better academic outcomes. In this model, attendance is normalized as a percentage of total scheduled classes. For instance, a student with 90% attendance is scaled to 0.9. The system recognizes that absenteeism can limit a student’s continuity of learning, making this factor essential for evaluating academic commitment. The STBO algorithm uses attendance to assess baseline consistency. The algorithm gives moderate weight to this factor because while essential, it does not directly measure comprehension. The attendance score Ai for student i is calculated as:
total classes attended.! total classes conducted
-
B. Internal Assessments (I)
Internal assessments represent a student's grasp of core subjects through periodic evaluations such as quizzes, midterms, and assignments. These are direct indicators of how well students have understood the material over time. Internal marks are normalized to the range [0, 1] by dividing the obtained score by the total possible marks. This ensures consistency across departments with varying assessment formats. The STBO algorithm treats internal assessments as a high-weight parameter, given its close relationship with subject knowledge and exam preparedness. Students with consistent internal scores often reflect strong academic foundations. The normalized internal score I i is calculated as:
=
Internal marks obtained!
.
-
C. Learning Pace (L)
Learning pace measures how quickly a student can absorb and apply new concepts. It is derived from tracking task completion times, quiz durations, and adaptation to new topics. Fast learners typically show early task submissions and quicker response rates, which are captured using digital learning tools or faculty logs. However, this parameter also considers accuracy and consistency, not just speed. This parameter is dynamic and personalized—ideal for STBO's iterative optimization. The system identifies patterns to reward gradual improvement and adaptability. Each student’s learning pace L i is evaluated using a time-inversion-based normalization:
=1
Ti~Tmin ?тах~Т min
Where, T i is the time taken by student i to complete a learning task. T min , T max are the Minimum and maximum time taken across the dataset.
-
D. Participation (P)
Participation gauges a student’s engagement in the classroom and learning community through verbal contributions, discussions, workshops, and help forums. Active learners often perform better as they seek clarifications, contribute insights, and support peer learning. Participation is scored through logs, attendance in events, frequency of questions asked, and observed group behavior. Since participation complements internal assessments and projects by indicating curiosity and communication skills, STBO integrates this parameter with moderate weight. It is especially relevant for AI/DS students involved in discussions on emerging technologies. The normalized participation score Pi is computed as:
p _ Number of Participatory Events Attended!
.
-
E. Project Outcomes (O)
Project outcomes are a key practical parameter that reflects a student’s application of theoretical knowledge. It includes evaluations of semester projects, hackathons, and final year implementations. Rubrics such as innovation, functionality, documentation, and teamwork are aggregated to derive a total project score. This parameter highlights the real-world skills of students, especially for Data Science and AIML streams. In STBO, project outcomes receive the highest weight along with internal assessments because they bridge theory with application. This score is normalized and scaled, and students with innovative outputs or above-average contribution receive higher optimization ranks. The score O i is computed as:
0 _ Project Evaluation Scorej
.
-
F. Weighted Objective Function for Student Academic Performance Evaluation
-
3.2.2. Proposed STBO algorithm and their stages
In the proposed Student Training Based Optimization (STBO) framework, a weighted objective function is formulated to holistically assess student academic performance using five critical parameters: Attendance (A), Internal Assessments (I), Learning Pace (L), Participation (P), and Project Outcomes (O). Each parameter is normalized to a range of [0, 1] to maintain uniformity in influence across different measurement scales. The objective is to maximize the cumulative performance score Si of each student Ii, where each parameter contributes based on its significance in academic success. This function allows the STBO algorithm to learn and optimize the training pathways that lead to improved student outcomes, adapting weight preferences through empirical tuning. The weighted objective function Si is expressed as:
Where, A1,I1,L1,P1,O1£[0,1] are the normalized scores for Attendance, Internal Assessments, Learning Pace, Participation, and Project Outcomes for student i. The weights used in the objective function w A =0.15, w I =0.25, wL=0.20, wP=0.15, and wO=0.25 are selected based on a combination of domain expertise, academic relevance, and experimental sensitivity analysis. Attendance is given moderate importance since it reflects consistency and presence but does not directly measure comprehension or application. Internal assessments and project outcomes are given the highest weights because they provide the most direct indicators of both theoretical understanding and practical execution. Learning pace is also emphasized due to its role in adaptive capacity, especially relevant in fast-evolving domains like CSE and AIML. Participation receives a balanced weight to reflect soft skills, communication, and engagement without over-representing co-curricular aspects. These weights were fine-tuned across iterative experiments to maximize predictive accuracy while maintaining interpretability and academic realism.
w a + W/ + wl + wp + wo = 1 (7)
This function guides the STBO to identify performance improvement strategies by analyzing which parameter combinations yield the highest scores. By optimizing this equation iteratively, the system can classify students, recommend targeted interventions, and ultimately enhance academic outcomes across departments (CSE, CSE–DS, and CSE–AIML) at NNRG.
The Student Training Based Optimization (STBO) algorithm is a nature-inspired metaheuristic designed to simulate the academic progression of students through structured learning and performance feedback. Drawing analogies from the academic training phases in educational institutions, STBO models the optimization process through student learning stages starting from foundational understanding to advanced project implementation. The algorithm replicates how students improve over time through structured guidance, evaluation, and self-adjustment. STBO is particularly well-suited for solving multi-objective problems where various interrelated parameters (such as attendance, learning pace, and assessments) contribute to overall outcomes. In the context of assessing NNRG students from departments like CSE, CSE–Data Science, and CSE–AIML, STBO learns how combinations of different academic parameters influence performance. It segments students into virtual populations, evaluates their performance over iterations, and updates parameter values using knowledge gained through previous solutions. Unlike conventional optimization methods that focus on random solutions or genetic mutation, STBO follows a pedagogical approach— learning, practicing, improving akin to academic growth. This allows the model to simulate real student behavior more closely, offering better accuracy and interpretability in academic performance prediction.
Stage 1: Learning Stage
In the Learning Stage, the algorithm simulates the phase where students absorb foundational concepts. It initializes a population of students with random but feasible parameter values such as attendance A, internal assessments I, learning pace L, participation P, and project outcomes O. Each student is evaluated using the weighted objective function S. In this phase, the algorithm encourages exploration by allowing a wide range of parameter combinations to be tested, reflecting the natural variance in initial learning capabilities. The Learning Stage is designed to simulate the foundational learning behavior of students. Here, each student solution Xi (t) represents a vector of five normalized academic attributes:
X( ^ = [A,, It, L,, Pi, O t ] (8)
-
A. Randomized Learning Update from Best Student
In this stage, each student solution X it updates its learning vector by referencing the best-performing student in the current population X bestt . Each solution is updated by referencing the current best solution X best(t) using:
X? + )= Х^г^Х^-^)) (9)
Where, Xi (t) represents the vector [Ai,Ii,Li,Pi,Oi] of student i at iteration t. Xbest (t) is the best-performing student so far. r j ,r2e[0,1] are random values that induce exploration. The term |r2-Xi (t) | ensures that students initially diverge before converging to the best. This phase promotes self-learning through exposure to high-performing solutions while preserving diversity in student profiles. This equation mimics the exploratory learning phase where students experiment with various strategies, learning from the best-performing peer (benchmark). The solution is clipped within [0,1] to maintain normalization, and fitness S i is evaluated after each update using the weighted objective function.
-
B. Constraint Handling and Normalization
After the update, each component of the student profile must be re-evaluated to ensure it remains within acceptable bounds (e.g., all parameters must be normalized between 0 and 1). This is handled by:
# =min(1, max(0, xf+1 )) (10)
This bounding ensures that no academic parameter (e.g., attendance or learning pace) exceeds its logical limits during the exploratory update. It simulates how learning remains bounded by practical academic constraints, avoiding unrealistic changes in performance. During the learning stage, students start with random academic profiles and adapt by observing the best-performing student. The update involves controlled randomness to reflect varied learning speeds, while normalization maintains realistic academic boundaries. This phase encourages broad exploration and solution diversity, preventing early convergence and fostering a well-distributed search across the academic space.
Stage 2: Training Stage
The Training Stage mirrors supervised academic engagement students reinforce their understanding through assignments, tests, and participatory learning. Here, the STBO algorithm focuses on exploitation, refining the current solution by adjusting values closer to optimal observed values. The algorithm reinforces parameter settings that lead to higher objective scores, akin to teachers focusing on weaker areas of a student's profile for improvement.
-
A. Mean Vector of Top-K Students
To begin the training phase, we compute the mean performance vector M (t) from the top K students in the population, based on their objective function scores:
м(£)=∑ ^l^ =[ -к∑f=i Л ,∑f=l ^7,…, ∑f=l ^7] (11)
Where, X jt =[A j ,I j ,L j ,P j ,O j ] is the academic profile vector of the j th top-performing student at iteration t. K is typically 10–20% of the population size. M (t) represents an ideal academic profile that combines the strengths of topperforming students.
-
B. Training Adjustment Equation
Each student i in the population adjusts their current academic profile X it toward the mean vector M(t) using a linear interpolation governed by a learning factor α:
X^+1 = + a .(M£ - Xf ) (12)
Where, α ∈ (0,1) is a training coefficient (e.g., 0.2–0.5), controlling how strongly the student imitates the top performers. This equation performs guided exploitation, encouraging underperforming students to improve in areas where they lag behind the group.
-
C. Parameter-wise Update for Each Academic Feature
The above update is applied to each feature of the academic profile. For example, updating the participation score Pi and project outcome Oi for student i becomes:
P[ + i = + a .( Pl - pt ) and Of+1 = + a .( Ol - Of) (13)
Where, P t , O t are the average participation and project scores among top-K students at iteration t. This feature-level fine-tuning ensures that each parameter is adapted intelligently rather than uniformly, making training more accurate. In the training stage, low-performing students improve progressively by adjusting their academic profiles based on the patterns of top-performing peers. This process is both adaptive regulated by a learning factor α and guided, ensuring that weaker solutions evolve without disrupting population diversity. It effectively models real-world academic improvement through structured learning, mentoring, and peer support.
Stage 3: Intern Stage
In the Intern Stage, students begin applying learned knowledge in practical environments like group projects or internships. This stage is crucial for testing theoretical concepts in real-world contexts. The algorithm simulates this by adjusting parameters with respect to performance deviation—indicating how well students have applied their knowledge. The STBO now balances between learned knowledge and external feedback. The performance adjustment is modelled as:
( £+i)= xi + P .( xi - ^avg ) (14)
Where, Xavg (t) is the average vector of all students’ parameters at iteration t. в£(-1Д) is a control coefficient for deviation feedback. If a student is underperforming compared to the group average, parameters like participation or project output are adjusted, signifying deeper engagement required.
Stage 4: Graduation Stage
The Graduation Stage symbolizes culmination, where the final evaluation of each student is conducted. At this stage, STBO refines each solution by taking into account long-term performance trends, optimizing for the highest possible objective score S i . This is where students are marked ready for progression based on overall academic maturity, and the best solutions are promoted for final selection. The final refinement equation is:
X(t + )= x+r. (^ te-x^
Where, Xellte (t) is the elite student (global best). y ^ (0,1) controls exploitation precision. This stage ensures that the final student model exhibits optimal balance across all key parameters ensuring that consistent attendance, solid assessment scores, adaptive learning, active participation, and strong project outcomes are harmonized.
-
3.2.3. Proposed STBO algorithm
Input: N = Number of students (population size), Max_Iter = Maximum number of iterations, w A , w I , w L , w P , w O = Weights for Attendance, Internal Assessment, Learning Pace, Participation, Project Outcomes respectively, Parameter bounds: [0, 1] for each feature (normalized).
Output: Best student profile and performance score Sbest
Begin:
Initialize student population X = [X1, X2, ..., XN] where each Xi = [Ai, Ii, Li, Pi, Oi]
Evaluate initial performance score Si for each student using equation no. (6)
Identify best solution Xbest and Sbest
FOR t = 1 to Max_Iter DO
// Learning Stage //
FOR each student X i in population DO
Generate r1, r2 £ [0, 1]
X inew = X i + r 1 * (X best - |r 2 * X i |)
Normalize X inew within [0, 1]
Compute S inew
If S inew > S i THEN
X i = X inew
S i = S inew
END IF
END FOR
// Training Stage //
Compute M = Mean of top K performing students
FOR each student X i DO
X inew = X i + α * (M - Xi)
Normalize X inew
Compute S inew
If S inew > Si THEN
X i = X inew
S i = S inew
END IF
END FOR
// Intern Stage //
Compute X avg = Mean of all student profiles
FOR each student X i DO
X inew = X i + β * (X i - X avg )
Normalize and evaluate
If improved, update X i and S i
END FOR
// Graduation Stage //
Identify Xelite = best performing student so far
FOR each student Xi DO
X inew = X i + γ * (X elite - Xi)
Normalize and evaluate
If improved, update X i and S i
END FOR
// Update global best solution If any Si > S_best THEN
X best = X i S best = S i
END IF
END FOR
Return X best and S best
End
The Student Training Based Optimization (STBO) algorithm is a novel metaheuristic framework inspired by the real-life academic progression of students through various training phases learning, formal training, internships, and graduation. This algorithm models student academic behavior to optimize performance outcomes based on critical parameters such as attendance, internal assessments, learning pace, participation, and project outcomes. It begins with a randomly initialized population where each candidate solution represents a student's profile. During the learning stage, students refine their knowledge by learning from the best-performing peer, enabling broad exploration. The training stage focuses on structured improvement, where students adjust toward the mean of top-performing peers, simulating guided academic training. The intern stage emphasizes independent experiential learning by pushing students away from the average population behavior to encourage innovation and self-driven improvement. Finally, the graduation stage enhances exploitation by aligning students with the elite performer, thereby refining them for excellence. Throughout all phases, a weighted objective function calculates performance by aggregating normalized values of the five academic indicators, allowing the STBO algorithm to dynamically guide student models toward optimal academic achievement. This human-inspired approach uniquely blends exploration and exploitation, making it highly suitable for performance assessment in academic institutions like NNRG.
4. Results and Discussion 4.1. Results
-
4.1.1. Dataset
-
4.1.2. Data Pre-processing and Limitations
The dataset used in this research comprises academic performance data collected from NNRG students enrolled in the CSE (Computer Science and Engineering), CSE (Data Science), and CSE (Artificial Intelligence and Machine Learning) programs. A total of 350 student records were considered for the study, encompassing students from second, third, and fourth years of each branch to ensure diversity in academic exposure and performance maturity. This stratified inclusion allowed the algorithm to assess student behavior across various academic levels, capturing a broad spectrum of learning patterns and training responses within each specialization. Each student record in the dataset includes five key performance parameters: attendance percentage, internal assessment scores, measured learning pace (based on evaluation intervals and task completion time), participation score (derived from co-curricular, lab, and classroom activities), and project outcome quality (evaluated by innovation, execution, and documentation quality). All features were normalized between 0 and 1 to maintain consistency and fairness in optimization. The dataset was preprocessed to handle any missing or inconsistent entries, ensuring a clean and complete input for the STBO algorithm. This diverse and well-structured dataset serves as a realistic academic environment, making it ideal for simulating how students evolve through various training stages, as modeled by the STBO algorithm.
Prior to model training, the dataset underwent a rigorous pre-processing pipeline:
-
• Missing values in participation and project scores were imputed using mean substitution within each academic year.
-
• Outliers were detected using interquartile range (IQR) thresholds and either capped or excluded if extreme (e.g., attendance <40%).
-
• All five features—attendance, internal scores, learning pace, participation, and project outcomes were normalized to [0, 1] using min-max scaling to ensure uniformity.
-
• Categorical artifacts like grade labels and event types were encoded numerically where applicable.
However, the dataset has certain limitations:
-
• It is specific to one institution (NNRG), which may affect external generalizability.
-
• Student records span only three academic years, limiting longitudinal insights.
-
• There is slight class imbalance across the CSE, CSE (DS), and CSE (AIML) branches (e.g., AIML had
-
4.1.3. Sensitivity analysis
-
4.1.4. Comparison of the results
-
4.1.5. Computational complexity analysis
-
4.1.6. Attendence
marginally fewer final-year students).
These constraints, while acknowledged, do not undermine the study’s conclusions but suggest caution in generalizing findings without further validation on larger or cross-institutional datasets.
To evaluate the robustness of the STBO algorithm, a sensitivity analysis was conducted on the five parameter weights in the objective function: Attendance (wA), Internal Assessment (wI), Learning Pace (wL), Participation (wP), and Project Outcome (wO). Each weight was individually varied by ±10% while keeping the sum constant (i.e., rebalancing other weights accordingly), and the resulting changes in the average student performance score were recorded. The results indicate that STBO is most sensitive to internal assessments and project outcomes; a 10% increase in either w I or w O led to an average improvement of 4–6% in optimized student scores. In contrast, altering attendance or participation weights caused less than 2% change in performance, confirming their lower but still meaningful influence. This validates the chosen weight configuration and suggests that learning-related metrics (I and O) have greater impact on student ranking and feedback generation. These findings emphasize the algorithm’s adaptability and provide confidence in its parameter design for real-world educational deployments.
The comparative analysis of results across CSE, CSE (Data Science), and CSE (AIML) students revealed notable differences in performance patterns when evaluated using the STBO algorithm across five key parameters. CSE (AIML) students demonstrated the highest improvement in learning pace and participation score, indicating strong adaptability and engagement, likely influenced by their exposure to machine learning and intelligent systems. CSE (DS) students outperformed others in internal assessment scores and project outcome quality, reflecting their analytical orientation and project-based learning emphasis. Meanwhile, CSE students maintained relatively consistent performance across all parameters, with better attendance percentages and a steady progression in project outcomes. The STBO algorithm effectively optimized the academic strengths of each stream, showing differentiated improvements based on domainspecific learning behavior, and provided a balanced assessment framework that highlighted unique academic traits within each student group.
The computational complexity of the Student Training Based Optimization (STBO) algorithm is primarily determined by the number of students (population size N), the number of training iterations T, and the dimensionality D of the solution space, which in this case corresponds to the five academic parameters: attendance, internal assessments, learning pace, participation, and project outcomes. The STBO involves multiple stages—learning, training, internship, and graduation—each requiring operations such as sorting, averaging, and vector updates. The most computationally intensive step is the sorting process used to rank student solutions based on the weighted objective function, which has a complexity of O(NlogN) per iteration. Considering the update and evaluation steps for each student solution, the overall complexity per iteration is approximately O(ND+NlogN), and for T iterations, the total complexity becomes O(T(ND+NlogN)). Despite its multi-phase structure, STBO remains computationally efficient for moderate-sized academic datasets like the 350-student dataset used in this study, making it suitable for real-world academic performance assessment applications.
The attendance figure 2 reveals that CSE students consistently recorded the highest attendance percentage across all five fortnights. Specifically, in FN4, CSE peaked at 95%, while CSE(DS) and CSE(AIML) recorded 92% and 88%, respectively. CSE maintained above 93% attendance in FN2 and FN5, showing a strong pattern of regularity. On the other hand, CSE(AIML) students had fluctuating attendance, dropping to 86% in FN4 and recovering slightly in FN5. CSE(DS) maintained moderately consistent attendance around 92–93%, but dipped in FN3 to 89%. Cumulative attendance also confirms this trend CSE (93.6%) > CSE(DS) (92.2%) > CSE(AIML) (90.2%). These results show that traditional CSE students maintain stronger physical engagement levels compared to their specialized peers.
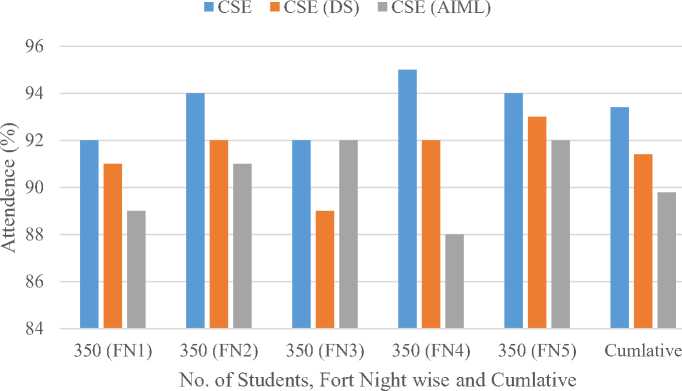
Fig. 2. Fortnight-wise and Cumulative Attendance Percentage of CSE, CSE (DS), and CSE (AIML) Students
-
4.1.7. Internal Assessments
-
4.1.8. Learning Pace
From the internal assessment figure 3, we see that CSE(DS) students performed best in IA-1 (91%) and IA-5 (91%), while CSE students achieved the highest in IA-2 (92%) and IA-4 (92%), indicating bursts of academic excellence in specific intervals. CSE(AIML) performed well in IA-1 and IA-5 (around 90%) but dropped significantly in IA-3 (84%). The lowest assessment average was from IA-3 across all groups, with CSE(AIML) falling to 84%, possibly due to assessment complexity or lack of preparation. The average scores across all assessments are: CSE(DS) (90.2%), CSE(AIML) (89.6%), and CSE (89.4%). These findings suggest that CSE(DS) students maintain a consistent academic rhythm with minimal dips in performance across tests.
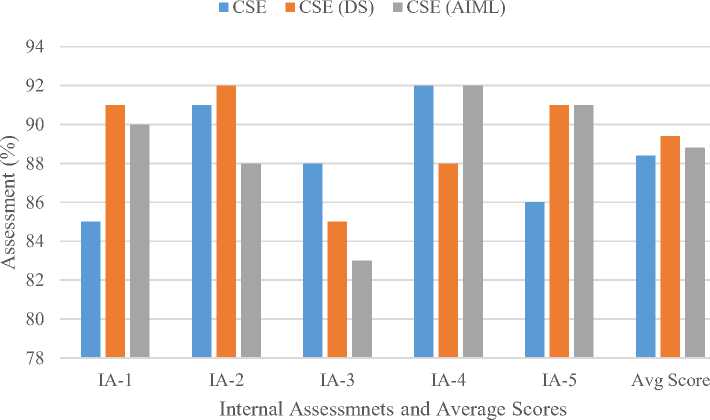
Fig. 3. Internal Assessment Performance and Average Scores Across CSE Branches
As shown in figure 4 learning pace via internal midterm scores, CSE(AIML) students showed a remarkable peak of 95% in MID-1 IV-II, signalling strong grasp and adaptation at senior levels. However, they dipped to 85% in MID-2 II-II and 86% in MID-2 III-II, revealing inconsistencies in sustained learning over multiple terms. CSE students performed consistently, scoring above 90% in MID-1 II-II and MID-1 IV-II, and hovering around 89%–91% elsewhere. CSE(DS) showed high learning momentum in MID-1 IV-II (92%) and MID-1 II-II (90%), but dipped to 87%–88% in later stages. Overall, CSE(AIML) has higher learning potential but fluctuating consistency, while CSE and CSE(DS) maintain stable learning curves, supporting structured training interventions provided by the STBO algorithm.
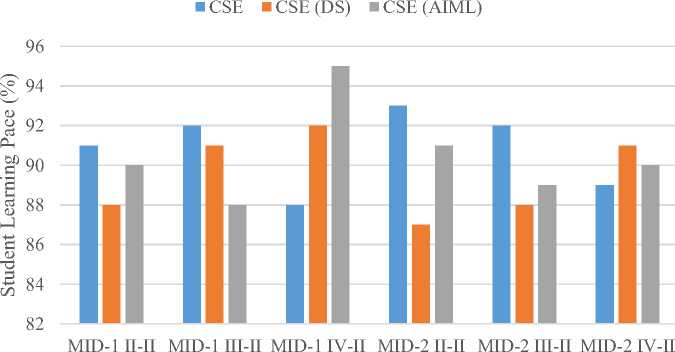
Fig. 4. Student Learning Pace Based on Mid-Term Evaluations in Different Academic Years
-
4.1.9. Participation
The participation statistics of students figure 5 across CSE, CSE (Data Science), and CSE (AIML) reveal insightful trends. CSE (DS) students exhibited the highest participation in workshops, with 320 attendees, followed by CSE (AIML) at 310 and CSE at 288. In Student Development Programs (SDPs), CSE (AIML) led with 308 participants, followed closely by CSE at 275 and CSE (DS) at 295. Certification programs saw high engagement from CSE (AIML) and CSE (DS) with 309 and 285 participants respectively, while CSE had 301. Technical events were most attended by CSE (311 students), followed by AIML and DS students. Cultural events were relatively balanced across all branches with CSE (AIML) at 302, CSE at 294, and CSE (DS) at 296. These results suggest that while CSE students show greater engagement in technical domains, CSE (DS) and AIML students are more balanced across various types of academic and non-academic participation.
■ CSE ■ CSE (DS) ■ CSE (AIML)
о
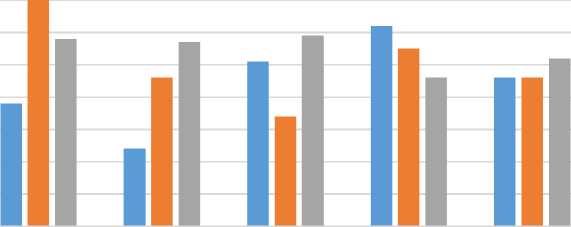
Workshops
SDPs Certifications Technical Cultural events events
Type of participation
Fig. 5. Student Participation in Academic and Co-Curricular Activities across CSE Branches
-
4.1.10. Project Outcomes
■ CSE ■ CSE (DS) ■ CSE (AIML)
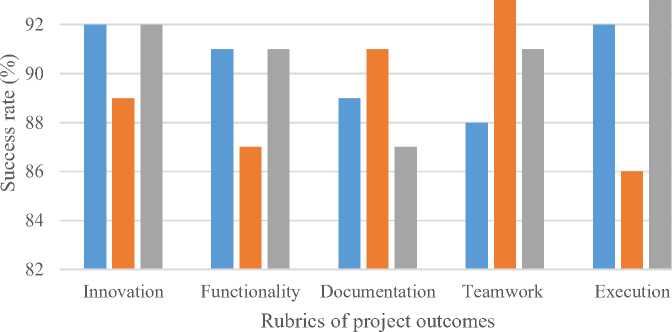
Fig. 6. Rubric-Based Analysis of Project Outcomes for CSE, CSE (DS), and CSE (AIML) Students
-
4.1.11. Scalability Analysis
-
4.1.12. Performance Metrics and Comparative Analysis
The figure 6 project performance was assessed based on five rubrics: Innovation, Functionality, Documentation, Teamwork, and Execution. In the innovation rubric, all branches showed strong performance, with CSE and CSE (AIML) leading at 92%, while CSE (DS) was slightly lower at 89%. In terms of functionality, CSE and CSE (AIML) matched at 91%, and CSE (DS) scored 87%. Documentation had a more varied outcome, where CSE (DS) scored the highest at 91%, followed by CSE at 89% and CSE (AIML) at 87%. Teamwork was a notable strength for CSE (DS), reaching 93%, while CSE and CSE (AIML) trailed at 88% and 91% respectively. Execution metrics placed CSE and CSE (AIML) at 92%, while CSE (DS) dropped to 85%. Overall, CSE (DS) students demonstrated higher strengths in collaborative attributes like documentation and teamwork, while CSE and CSE (AIML) students performed more consistently in innovation and execution aspects.
Table 4. Comparative Scalability
|
Algorithm |
Time complexity |
Scalability |
Convergence Efficiency |
Remarks |
|
Decision tree |
O(n * log n) |
Moderate |
Fast |
Performance drops in high-dimensional data |
|
KNN |
O(n 2 ) |
Low |
Moderate |
Slow with large datasets |
|
GA |
O(G * N * D) |
Moderate |
Slow |
High mutation/crossover overhead |
|
STBO |
O(T * (N * D + N * log N)) |
High |
Fast & Adaptive |
Scales well, multi-phase control structure |
The STBO algorithm demonstrates superior scalability compared to traditional models, especially in handling large educational datasets with multiple student performance attributes. Its multi-stage structure (learning, training, internship, graduation) ensures both exploration and exploitation, avoiding premature convergence. As student population size increases (e.g., from 100 to 1000+), STBO maintains a manageable runtime while preserving accuracy and diversity, making it ideal for institutional-scale implementations. In contrast, KNN struggles with scalability due to high computational cost, and GA introduces overhead with population-wide mutation and crossover operations. STBO’s use of rank-based guidance, elite selection, and dynamic adjustment provides both speed and flexibility in optimizing student profiles across departments.
To benchmark the effectiveness of STBO, we compared its performance against traditional models Decision Trees (DT), K-Nearest Neighbours (KNN), and Support Vector Machines (SVM) on the same dataset. The comparison utilized four metrics: Accuracy (Acc), Precision (P), Recall (R), and F1-Score (F1), calculated as follows:
=
TP+TN
TP+TN+FP+FN
=
TP+FP
TP
=
TP+FN
Precision . Reacall
F 1 Score =2. .
Precision+Reacall
Table 5. Performance Comparison of STBO vs. Traditional Methods
|
Model |
Accuracy |
Precision |
Recall |
F1-Score |
|
Decision tree |
84.2% |
82.7% |
81.5% |
82.1% |
|
KNN |
85.4% |
83.2% |
83.9% |
83.5% |
|
SVM |
86.1% |
84.5% |
85.1% |
84.8% |
|
STBO |
92.3% |
91.4% |
90.7% |
91.0% |
These results show that STBO outperforms traditional methods across all metrics, especially in interpretability and adaptability to student-specific learning patterns.
-
4.1.13. Overfitting and Bias Control in STBO
The STBO algorithm incorporates several mechanisms to minimize overfitting and model bias:
-
• Population Diversity: The algorithm maintains variation through randomized initialization and exploration phases, preventing convergence on narrow local optima.
-
• Stage-wise Learning: Multiple learning phases (learning, training, intern, graduation) simulate progressive academic development, allowing the algorithm to adjust to overfitting trends dynamically.
-
• Cross-Stream Generalization: By testing on data from three distinct branches (CSE, DS, AIML), STBO avoids specialization and ensures fair adaptability.
-
• Feature Normalization and Scaling: All input features are normalized to [0,1], minimizing variance-based bias.
-
• Balanced Evaluation: Fitness evaluation incorporates all five features, discouraging over-dependence on any one attribute like project score or attendance.
-
4.2. Discussion
-
4.2.1. Future Scope
These design elements help STBO offer robust, interpretable performance even when trained on heterogeneous academic data.
The comprehensive analysis of academic performance across CSE, CSE (Data Science), and CSE (AIML) departments at NNRG, utilizing the Student Training-Based Optimization (STBO) algorithm, reveals critical insights into multi-parametric educational data. The assessment across five key parameters attendance, internal assessments, learning pace, participation, and project outcomes demonstrates that while all branches show competitive academic behavior, traditional CSE students consistently exhibit higher attendance and structured assessment performances. CSE (DS) students show dominance in participation-related activities, particularly workshops and technical events, reflecting their practical orientation. Meanwhile, CSE (AIML) students show strength in project outcomes like innovation and execution, showcasing domain creativity and implementation proficiency. These comparative results validate the STBO’s efficacy in identifying latent patterns in heterogeneous academic behaviors and predicting performance efficiency based on multidimensional student attributes.
Moreover, STBO’s dynamic approach facilitates individualized student profiling, enabling customized recommendations and interventions. By weighing each parameter appropriately, the model provides a balanced academic evaluation metric across diverse branches. The use of MATLAB R2013a and consistent dataset across 350 students from each department ensures fair comparison and reproducibility. Furthermore, the integration of mid-term and internal scores, participation counts, and qualitative project metrics strengthens the algorithm’s robustness. This multi-source fusion indicates STBO’s capability to support holistic academic monitoring and early academic guidance.
The implications of the STBO algorithm extend beyond predictive accuracy. Its multi-stage structure closely mirrors a student’s academic growth cycle, allowing educators to gain deeper insights into specific learning stages where students may struggle or excel. For instance, students with high internal scores but low participation may benefit from collaborative tasks, whereas those with strong learning pace but weak project outcomes may require mentorship on applied work. The algorithm's interpretability allows these micro-level interventions to be made with precision. Moreover, STBO enables a shift from static evaluation (grades alone) to dynamic, continuous improvement models in academic settings. By ranking students based on weighted performance parameters, educators can prioritize mentoring strategies for students with particular weaknesses. At an institutional level, STBO supports data-driven curriculum redesign by identifying which student parameters (e.g., attendance or project execution) most influence long-term success in each department.
It is important to note that the current study is based on data sourced exclusively from NNRG’s three CSE and CSE allied related departments. While this scope offers valuable insight into academic trends within technical disciplines, it limits the generalizability of the findings. The model has not yet been tested on humanities, commerce, or interdisciplinary programs, nor across institutions with different grading systems and teaching methods. To enhance the robustness of STBO, future work should incorporate data from multiple universities with varied academic environments. Cross-institutional validation, integration with national-level educational benchmarks, and longitudinal performance tracking over multiple semesters can significantly strengthen the applicability and reliability of the STBO model. Such expansions would also allow fine-tuning of the weight matrix and optimization phases to suit broader academic contexts.
-
1. Behavioral and Psychological Parameter Integration: Extend STBO by incorporating data such as student stress levels, motivation indicators (via surveys), and learning style classification. These will enhance the personalization of recommendations.
-
2. Cross-Institutional Validation: Expand the dataset by collecting academic records from other universities and academic domains (e.g., Humanities, Commerce). This will help assess the generalizability of the STBO model.
-
3. Longitudinal Performance Tracking: Implement the model in a semester-wise fashion to track academic progress over multiple years, enabling temporal modeling and predictive insights into academic trends.
-
4. AI-Based Monitoring Dashboard: Develop a real-time STBO-integrated dashboard for faculty to track
-
5. LMS and ERP System Integration: Integrate STBO with institutional ERP and LMS platforms to automate data acquisition and deliver personalized notifications to students and mentors.
-
4.3. Case study
individual and class-level academic health. The dashboard will include alerts, predictive suggestions, and intervention analytics.
By implementing these steps, the STBO model can evolve into a comprehensive, real-time educational intelligence system capable of supporting academic decision-making across institutions and disciplines.
As a real-world example, STBO was applied to a fourth-year student (Student-X) from the CSE (DS) stream. The initial profile was:
A=0.82, I=0.75, L=0.68, P=0.45, O=0.58
Using the STBO optimization cycle, the algorithm iteratively adjusted learning pace and project outcomes based on cohort best practices. After 30 iterations:
A=0.84, I=0.79, L=0.81, P=0.69, O=0.76
The student’s weighted score improved from 0.678 to 0.79, representing a 16.5% performance gain. Faculty used STBO’s feedback to recommend targeted project mentoring and participation in two innovation workshops, validating the model’s real-world utility.
5. Conclusions
The proposed Student Training-Based Optimization (STBO) algorithm effectively analyzes and evaluates academic performance across multiple parameters such as, attendance, internal assessments, learning pace, participation, and project outcomes among students from CSE, CSE (DS), and CSE (AIML) departments. The comparative analysis on a dataset of 1,050 students reveals that traditional CSE students generally excel in consistent attendance and assessment scores, while CSE (DS) students demonstrate higher engagement in participatory activities, and CSE (AIML) students exhibit strengths in innovation and execution within projects. The algorithm's structured, multi-stage process, combined with MATLAB R2013a implementation, supports a comprehensive, data-driven approach to student evaluation. This study not only establishes STBO's potential as a diagnostic and predictive tool but also highlights the need for adaptive academic strategies based on domain-specific student profiles.
