Entailment and spectral clustering based single and multiple document summarization

Author: Anand Gupta, Manpreet Kaur, Ahsaas Bajaj, Ansh Khanna
Journal: International Journal of Intelligent Systems and Applications @ijisa
Article in issue: 4 vol.11, 2019.
Free access
Text connectedness is an important feature for content selection in text summarization methods. Recently, Textual Entailment (TE) has been successfully employed to measure sentence connectedness in order to determine sentence salience in single document text summarization. In literature, Analog Textual Entailment and Spectral Clustering (ATESC) is one such method which has used TE to compute inter-sentence connectedness scores. These scores are used to compute salience of sentences and are further utilized by Spectral Clustering algorithm to create segments of sentences. Finally, the most salient sentences are extracted from the most salient segments for inclusion in the final summary. The method has shown good performance earlier. But the authors observe that TE has never been employed for the task of multi-document summarization. Therefore, this paper has proposed ATESC based new methods for the same task. The experiments conducted on DUC 2003 and 2004 datasets reveal that the notion of Textual Entailment along with Spectral Clustering algorithm proves to be an effective duo for redundancy removal and generating informative summaries in multi-document summarization. Moreover, the proposed methods have exhibited faster execution times.
Automatic Summarization, Textual Entailment, Spectral Clustering, Information Retrieval, Extractive Techniques, Natural Language Processing
Short address: https://sciup.org/15016586
IDR: 15016586 | DOI: 10.5815/ijisa.2019.04.04
Text of the scientific article Entailment and spectral clustering based single and multiple document summarization
Published Online April 2019 in MECS
The technological advancements in the ever-growing digital world have brought a flood of information in the present society. This flow of superfluous information is adversely affecting the efficiency of a human brain. The stress induced by the reception of more information than a brain can comprehend directly interferes with its decision-making capabilities. It causes reading fatigue and wastage of time, thus adversely affecting the productivity of an individual. At an organizational level, where time and employee brain is an expensive resource, this situation has a negative impact on end results ultimately. This phenomenon of information overload has led to the need for information extraction tools which can provide the user with the relevant information without the need of going through the whole pool of information. The automatic text summarization seems to be a good and viable solution to this problem.
Automatic text summarization is an important task of condensing a single text document or multiple text documents into a short excerpt of sentences conveying the gist of the whole text. This condensed version of the original document is called summary. A summary should cover maximum significant information of the source document so that it would be worthwhile for a reader to go through it. Moreover, it should cover all the sub-topics of the source document.
At the outset, it is required to capture connectivitybased relationships among sentences of the source document so that those related under common sub-topics could be brought together.
In literature, ATESC [1] is one such method which has been well utilized for the same purpose. The paper has reported the effectiveness of the ATESC method in the task of single document text summarization. The method has performed well on Essay type and long articles. The essence of ATESC lies in creating a summary which covers all the significant themes. The sentence salience detection criteria and sentence clustering method used beneath the ATESC method are based on the concept of text connectedness which facilitates to cluster sentences that are connected under relevant themes. However, the authors have observed some limitations in ATESC method regarding determining entailment scores and sentence scoring, which need to be addressed in order to produce better summaries. Therefore, the authors have reintroduced ATESC method with new criteria for determining entailment scores and improved formula for sentence score calculation. Further, the evaluation of modified ATESC has been carried out in this paper on a standard dataset containing only news articles so that its performance can be evaluated and analyzed in comparison to other methods in the literature. It is expected to give more insights into the behavior of ATESC.
Although ATESC has been originally developed for single document summarization only, the authors feel that ATESC possesses the characteristics which make it suitable to deal with the task of multi-document summarization. There are a number of issues to be dealt with to create a summary from multiple documents. Redundancy is a major issue [2] which needs to be minimized in order to have a highly informative summary. The authors believe that the clustering method used at the core of ATESC is capable to handle the issue of redundancy in an efficient manner.
Therefore, this paper is an attempt to extend the modified ATESC method for multi-document summarization. The authors propose to apply ATESC in two ways: one step summarization (ATESC1-step) and two-step summarization (ATESC 2-step ). In ATESC 1-step , all the input documents are pooled into a single document before ATESC is applied to generate a summary. In ATESC 2-step , ATESC is applied onto every single input document from the set of documents to create an equal number of summaries. The summaries are pooled into one document which is further summarized using ATESC method to generate a final summary. This paper experiments with both the methods on standard datasets to find the most suitable method for multi-document summarization.
The rest of the paper is outlined as follows. Section II briefs the related work, Section III discusses the reasons for choosing TE and also how it is utilized in the proposed methods. Section IV explains the role of the spectral clustering algorithm to form relevant clusters of sentences. Section V-A discusses the improvements in ATESC method and Section V-B further elaborates modified ATESC based methods proposed for the task of multi-document summarization. Finally, the experiments are conducted to analyze the performance of the proposed methods in Section VI and the results are discussed in Section VII. Finally, Section VIII concludes this paper and discusses future work.
-
II. Related Work
The process of text summarization involves identifying significant text units (words, phrases, sentences, paragraphs) and then collecting those significant text units into a summary. A text summarization method has been proposed in [1] that used text connectedness criteria to identify salient content. They have used a recent paradigm of Textual Entailment which established textual inference relationships between two text units. Textual entailment (TE) is defined in [3] as a directional relationship between a pair of text expressions, denoted T, the entailing ‘text’, and H, the entailed ‘Hypothesis’. T entails H if the meaning of H can be inferred from that of T, as a human would typically interpret. An example below shows such a T- H pair to understand the meaning of TE more clearly.
TEXT: Saudi Arabia, the biggest oil producer in the world, was once a supporter of Osama bin Laden and his associates who led attacks against the United States.
HYPOTHESIS: Saudi Arabia is the world’s biggest oil exporter.
TE is basically used to determine semantic inference relationship between two text units. The research work in [1] is an attempt to overcome the shortcomings associated with the Logic Text Tiling (LTT) method [4]. In LTT, entailment between two sentences is checked in a binary fashion (either 0 or 1). It means either a sentence fully entails the other sentence or it doesn’t entail at all. However, this concept of inference doesn’t comply with a human way of understanding relationships between two text expressions. Thus, an analog way of quantifying entailment relationship between two text expressions has been introduced that would be measured in terms of a numeric score lying between 0 and 1 [1]. This score denotes the extent of entailment being exhibited between two text expressions. This analog way of quantifying the extent of entailment between two text expressions is closer to the way a human mind would infer some knowledge from a big chunk of text. This facilitated ATESC to determine sentence salience in a more accurate way. Also, LTT generates linear segments of text producing a new segment whenever there is a change in the logic structure of text. This change is marked by a sudden shift in salience scores of sentences. ATESC has proposed to break this monotony of producing segments from near vicinity by choosing sentences all over the document. This segmentation is performed by introducing Spectral Clustering method for the same purpose. Also, ATESC has proposed to assign relative importance to segments before selecting sentences from them to create a summary.
ATESC has shown a better performance over LTT as reported in [1]. Thus, the strengths of ATESC attracted the authors to extend the same work to summarization. But the authors observe certain limitations in ATESC method also which if improved may produce better summaries. The tool which has been used for calculating entailment scores in the same work is slow which makes the whole summarization method also slow. Moreover, this tool also makes it infeasible to experiment the summarization method on a large dataset. As the need of the hour is a quick generation of summary in real time, the authors propose to use a directional measure of entailment to replace the tool. Moreover, the previous sentence scoring formula has partially complied with the entailment logic which results in inaccurate sentence salience determination. Now, an improved sentence scoring formula is proposed which fully complies with the entailment logic and is expected to measure salience accurately so that only potential candidates constitute the summary.
After incorporating above changes, modified ATESC has been adapted to the task of multi-document summarization. Although single and multiple document summarization share the same goal but multi-document summarization has altogether a different set of issues to deal to create a summary. Redundancy of information is one of the issues which should be tackled while creating a summary from multiple documents so as to provide maximum information coverage in a summary. The authors feel that spectral clustering may play a good role in identifying similar and redundant sentences into a cluster so as to maximize information coverage and minimize redundancy in summary. The spectral clustering algorithm uses the entailment scores between every pair of sentences to form clusters. The calculation of entailment scores and its use in calculating sentence salience are discussed in the following sections. Section IV describes the use of spectral clustering to form sentence clusters using entailment scores as the input.
-
III. Using Analog Textual Entailment For Determining Sentence Salience
The work determines the salience of a sentence on the basis of text connectedness criterion. A sentence which is connected to many other sentences is considered to be highly informative, thus a salient one.
In order to quantify informativeness of a sentence, the authors used the mathematical formulation from [8] which computes an entailment score between two text expressions. It is based on a familiar similarity measure of inverse document frequency ( idf ) in information retrieval. The entailment score of two sentences T and H (TEsco re TjH ) is computed in (1) by comparing the sum of weights of the words appearing in both T and H to the sum of the weights of all words in H where the weight is calculated using (explained later).
TEs с о re T ,H
Г w кe (ТпИ) i ffk
Г w k e H t f fk
where denotes the kth word and is the inverse document frequency of each word . The is assigned to each word using:
i dfk = I о g( ^
where N is the total number of sentences and is the number of sentences in which term occurs. The rationale behind using idf score is that words with higher score are considered as more informative words and thus, are better suited for discriminating the content of one sentence from the other.
The entailment formula in Equation (1) approximates the extent of information in H which is covered in T. The formula returns a score between 0 and 1. A higher value means higher entailment relationship which in turn indicates higher connectedness between the sentences and vice versa. All the entailment scores are stored in an entailment matrix (EM) of size n × n, where n is the number of sentences in an input document. It is further used to determine the salience of a sentence Si. We present a modified formula to calculate the salience score of a sentence using the EM matrix. This score is calculated as:
5 елtелceSс0re = £^ t EM [ i,j ] (3)
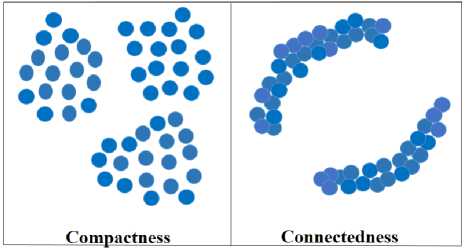
Fig.1. Clustering based on Compactness vs Connectedness attributes
The entailment matrix EM is further used by Spectral Clustering algorithm for the purpose of creating clusters of sentences. It is explained in the next section.
-
IV. Using Spectral Clustering For Sentence Clusters Formation
Clustering is defined in [9] as a task of separating the given data points in maximally homogeneous groups (clusters) using the given measure of similarity. The clusters generated should be such that they have maximum intra-cluster similarity and minimum similarity among points of different clusters. Hence, we need a suitable clustering algorithm to cluster related sentences under sub-topics. To choose a suitable clustering algorithm, it is important to know what attributes of data points are under consideration. The data attributes can be either compactness or connectedness [10]. The basic difference between clustering methods based on compactness and connectedness is given as follows.
Clustering based on compactness : The clustering of data points is based on the criteria of spatial proximity between each other. For example, k-means [11], agglomerative average link clustering [9] and modelbased clustering [12] approaches are based on compactness. The outcome of this clustering algorithm is clusters that tend to be spherical or well-separated as shown in Fig. 1.
Clustering based on Connectedness: The clustering of data points is based on finding some connected regions in data such as single link clustering [9] and spectral clustering [13]. The outcome of this kind of clustering algorithm is clusters that tend to be arbitrarily shaped as shown in Fig. 1. In text summarization, the aim of the clustering task is to find clusters of sentences where sentences in each cluster are connected to each other and each cluster represent a different sub-topic.
Thus, the chosen clustering algorithm should comply with the prime intuition of the text summarization method i.e. to identify clusters of sentences connected under different sub-topics. Many of the different clustering algorithms have been used in the task of summarization [14, 15] but we don’t find any of these algorithms to comply with the basic intuition of summarization method under consideration. As this paper views summarization task as a problem to be solved using the notion of connectedness among sentences, spectral clustering seems to be an apt choice. This algorithm uses eigenvectors of the similarity matrix to find the clusters and has recently emerged as a popular clustering method (based on connectedness).
-
A. About Spectral Clustering
Spectral Clustering is a method of embedding the similarity matrix between data points followed by clustering in low dimensional space. It is one such clustering technique that does not make any assumptions based on the form of clusters, rather views the problem as a case of graph partitioning [16]. It is very successful in cases where the structure of individual clusters is highly non-convex and clustering is to be done on the basis of connectedness rather than compactness. It is used in wide range of applications including the fields of automatic circuit placement for VLSI [17], image clustering [18], shape clustering [19], motion clustering [20], document classification based on semantic association of words [21], text categorization based on reader similarity [22] and collaborative recommendation [23]. It has been exploited for clustering sentences in text summarization domain earlier also in [24] but their intention is to exploit linear ordering of sentences to form clusters from near vicinity only. This approach may not be feasible for multidocument summarization where clusters need to be formed with the sentences scattered over the multiple documents. But ATESC possesses this virtue of selecting similar sentences from all over the documents breaking the monotony of picking the sentences from close vicinity.
The algorithm for Spectral clustering has been given as following: It maps data to low dimensional space which is separated and can be easily clustered using algorithms such as k-Means or discretization.
When applied to the entailment matrix (EM), this clustering algorithm creates the clusters of sentences of the source document where each cluster represents a different theme. Thus, the method implicitly prevents redundancy for multi-document summarization by bringing together similar sentences together in a cluster. Only, most relevant sentences are picked from each cluster to create a summary. Thus, chances of getting redundant information in a summary are considerably reduced.
Finally, the authors employ above-mentioned concepts of Textual Entailment and Spectral Clustering to propose a novel method of text summarization ATESC, which is explained in the next Section.
-
V. Analog Textual Entailment and Spectral Clustering Based Methods
This section reintroduces the ATESC method [1] and proposes significant modifications for its use in single document summarization. The section also elaborates the proposed methods for multi-document summarization: ATESC 1-step and ATESC 2-step in subsection V-B.
-
A. ATESC method for Single Document Text
Summarization
This subsection elaborates on some points discussed in section II and the steps of ATESC for single document text summarization are outlined as below:
-
1) Entailment Scores Calculation
-
2) Sentence Scores Calculation
-
3) Clusters Formation using Spectral Clustering
-
4) Clusters Scoring and Sorting
-
5) Sentence Extraction to form Summary
Fig. 2 shows the block diagram of the ATESC method. We use a sample article from DUC 2002 dataset (shown in Table 1) to illustrate the ATESC method for single document summarization. DUC 2002 1 dataset is a collection of newswire articles. The article used here is AP880662-184 of cluster D072f.
-
1) Entailment Scores Calculation: This step
calculates entailment scores between every pair of sentences in the source document. The scores are then stored in Entailment Matrix (EM) of size N×N, where N is the number of sentences in the source document (d). This matrix is computed using a directional measure of entailment that is formulated in (1) as discussed in Section III. It is to be noted that this matrix is not symmetric i.e. EM[i, j] != EM[j, i] as implied by the definition of Textual Entailment in [3]. The entailment matrix of the sample article under consideration is shown in Table 2.
-
2) Sentence Connection Scores Calculation: It is done to determine the salience of a sentence. It is assumed that the salience of a sentence is directly related to its connectedness with other sentences. Therefore, the sentence connection scores for all the sentences are calculated using the sentence entailment matrix. The connection score of sentence Si is calculated as the sum of the entailment scores of all sentences as entailed by Si:
ComScore [i] = £^ г MM[jj] (4)
It generates an array of connection scores, ConnScore[1: N] where ConnScore[i] represents the score of the ith sentence. Table 3 shows the sentence connection scores of 10 sentences of the sample document.
-
3) Clusters Formation using Spectral Clustering: The sentences are grouped into clusters by applying Spectral Clustering on the sentence entailment matrix as discussed in Section IV. The number of clusters is to be fixed beforehand since Spectral Clustering is an unsupervised clustering algorithm. As mentioned earlier, spectral clustering is based
on the concept of connectedness, henceforth, each cluster (or clusters) gives a set of sentences which are mostly related to each other under particular sub-theme of the source document. The clusters which get created for the sample document are shown in Table 4.
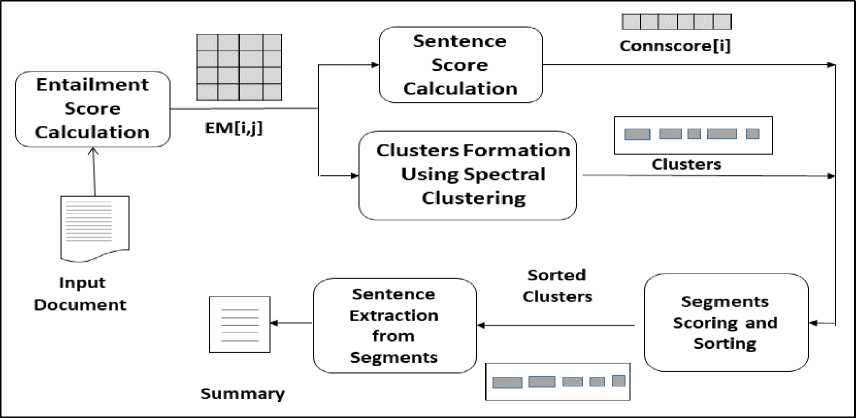
Fig.2. Outline of ATESC method
Table 1. The sentence array of article AP880662-184 of cluster D072f in the DUC’02 dataset .
|
Id |
Sentence |
|
S 1 |
Beverly Sills, Lauren Bacall, Betty Comden and Phyllis Newman are among performers who will sing, act and make guest appearances at a birthday bash in August for conductor Leonard Bernstein. |
|
S 2 |
The Leonard Bernstein Gala Birthday Performance is a benefit concert scheduled for the composer’s 70th birthday, Aug. 25, to raise money for the Tanglewood Music Center, where Bernstein got his conducting start. |
|
S 3 |
Sills will be host. |
|
S 4 |
Performances will include the Boston Symphony Orchestra, the Boston Pops Orchestra and the Tanglewood Festival Chorus under the direction of some of the many conductors whose careers have been guided by Bernstein. |
|
S 5 |
Bacall and soprano Barbara Hendricks will perform a movement from Bernstein’s Symphony No. |
|
S 6 |
Bacall and soprano Barbara Hendricks will perform a movement from Bernstein’s Symphony No. |
|
S 7 |
Violin soloist Midori will play two movements from his “Serenade.” |
|
S 8 |
The concert will celebrate Bernstein’s accomplishments in popular music with excerpts from “West Side Story,” “On the Town” and others. |
|
S 9 |
Dame Gwyneth Jones and Frederica von Stade will be among those performing highlights from “Fidelio,” “Tristan und Isolde” and other works to honor Bernstein’s landmark opera recordings. |
|
S 10 |
Tickets start at 20 for as poton the lawn and run upto 5,000 for benefactors, who get a seat in the open-air auditorium. |
Table 2. Sentence Entailment matrix (EM)
|
Id |
S 1 |
S 2 |
S 3 |
S 4 |
S 5 |
S 6 |
S 7 |
S 8 |
S 9 |
S 10 |
|
S 1 |
0.000 |
0.108 |
0.040 |
0.056 |
0.071 |
0.019 |
0.006 |
0.059 |
0.090 |
0.105 |
|
S 2 |
0.098 |
0.000 |
0.000 |
0.094 |
0.036 |
0.017 |
0.031 |
0.143 |
0.063 |
0.103 |
|
S 3 |
0.402 |
0.000 |
0.000 |
0.062 |
0.062 |
0.000 |
0.062 |
0.062 |
0.206 |
0.000 |
|
S 4 |
0.047 |
0.086 |
0.005 |
0.000 |
0.051 |
0.005 |
0.005 |
0.089 |
0.027 |
0.075 |
|
S 5 |
0.187 |
0.105 |
0.016 |
0.161 |
0.000 |
0.000 |
0.068 |
0.174 |
0.174 |
0.026 |
|
S 6 |
0.138 |
0.138 |
0.000 |
0.046 |
0.000 |
0.000 |
0.287 |
0.333 |
0.333 |
0.046 |
|
S 7 |
0.051 |
0.081 |
0.015 |
0.015 |
0.062 |
0.093 |
0.000 |
0.155 |
0.155 |
0.000 |
|
S 8 |
0.074 |
0.199 |
0.008 |
0.134 |
0.083 |
0.058 |
0.083 |
0.000 |
0.192 |
0.043 |
|
S 9 |
0.084 |
0.064 |
0.019 |
0.030 |
0.061 |
0.042 |
0.061 |
0.141 |
0.000 |
0.034 |
|
S 10 |
0.128 |
0.138 |
0.000 |
0.109 |
0.012 |
0.007 |
0.000 |
0.041 |
0.045 |
0.000 |
Table 3. Sentence Connection Scores for the sample article
|
S 1 |
S 2 |
S 3 |
S 4 |
S 5 |
S 6 |
S 7 |
S 8 |
S 9 |
S 10 |
|
1.737 |
1.514 |
0.966 |
1.105 |
1.360 |
1.568 |
1.201 |
2.080 |
1.933 |
0.920 |
Table 4. The sentences in different clusters after spectral clustering
|
Clusters |
Sentences In Clusters |
|
Clus 1 |
S 2, S 10 |
|
Clus 2 |
S 6, S 7, S 8, S 9 |
|
Clus 3 |
S 4, S 5 |
|
Clus 4 |
S 1, S 3 |
Table 5. Sorted clusters with sorted sentences
|
Clusters |
Cluster Salience Score |
Sentence within clusters (sorted in order of decreasing salience) |
|
Clus 1 |
6.7 |
composer’s 70th birthday, Aug. 25, to raise money for the Tanglewood Music Center, where Bernstein got his conducting start.
open-air auditorium. |
|
Clus 2 |
2.7 |
No.
the Tanglewood Festival Chorus under the direction of some of the many conductors whose careers have been guided by Bernstein. |
|
Clus 3 |
2.5 |
No.3, Kaddish.
“West Side Story,” “On the Town” and others.
from “Fidelio,” “Tristanund Isolde” and other works to honor Bernstein’s landmark opera recordings. |
|
Clus 4 |
2.4 |
will sing, act and make guest appearances at a birthday bash in August for conductor Leonard Bernstein.
|
4) Clusters Scoring and Sorting: Once the clusters are obtained, it is required to determine their salience also. Their scoring is done so that sentences are extracted from highly salient clusters first for a better summary.
Each cluster is assigned a salient score that is equal to the mean score of its constituent sentences. Let SegScore[1:k] represent the array of cluster scores where k is the total number of clusters formed. The score of cluster i given by SegScore[i] is calculated using Equation 5:
SegScore [i] = (1/m ЭЕ™^ OonsCoreeVi ] (5)
where ms is the total number of sentences in cluster i. After computing the scores for each cluster, they are sorted in descending order of their scores to form a set of clusters as SortedSeg[1:k]. The sentences within each individual cluster are also sorted according to the values of ConnScore for each participating sentences. The clusters which get created after applying Spectral clustering followed by scoring and sorting techniques on the sample document are shown in Table 5.
Table 6. The final Summary of the sample document
The Leonard Bernstein Gala Birthday Performance is a benefit concert scheduled for the composer’s 70th birthday, Aug.25, to raise money for the Tanglewood Music Center, where Bernstein got his conducting start. Beverly Sills, Lauren Bacall, Betty Comden and Phyllis Newman are among performers who will sing, act and make guest appearances at a birthday bash in August for conductor Leonard Bernstein. Bacall and soprano Barbara Hendricks will perform a movement from Bernstein’s Symphony No. The concert will celebrate Bernstein’s accomplishments in popular music with excerpts from “West Side Story,” “On the Town” and others.
-
5) Sentence Extraction: The selection of the
sentences for the final summary is done in the following way: the sentences with the highest ConnScore value from each of the sorted clusters beginning from the first cluster in SortedSeg[1:k] array are included into the summary until the length of the summary being created becomes equal to the target length. If the current length after a complete iteration on the SortedSeg array, is still less than the desired length then the sentence with the second highest ConnScore value is selected from each cluster, beginning from the first cluster. The process is repeated until the length of the generated summary reaches the desired length. After the sentences are extracted from the clusters, they are re-arranged according to their original order in the source document to build the final summary. The final summary of the sample document is shown in Table 6. This extraction process is designed in such a way that the redundant sentences are avoided from inclusion into the final summary. The selection of sentences is done from different clusters rather than selecting higher scored sentences from the same cluster. Since different clusters represent a different idea about the text, by following this process, various ideas can be covered in the summary by avoiding redundancy.
-
B. ATESC for Multi-Document Summarization
This Section proposes two summarization methods for multiple documents: ATESC 1-step and ATESC 2-step . Both employ ATESC for carrying out the task with a difference that the first method performs summarization in one step (designated as ATESC 1-step ) whereas the second method performs summarization in two steps (designated as ATESC2-step). Fig. 3 shows the block diagram of the proposed methods for multi-document summarization.
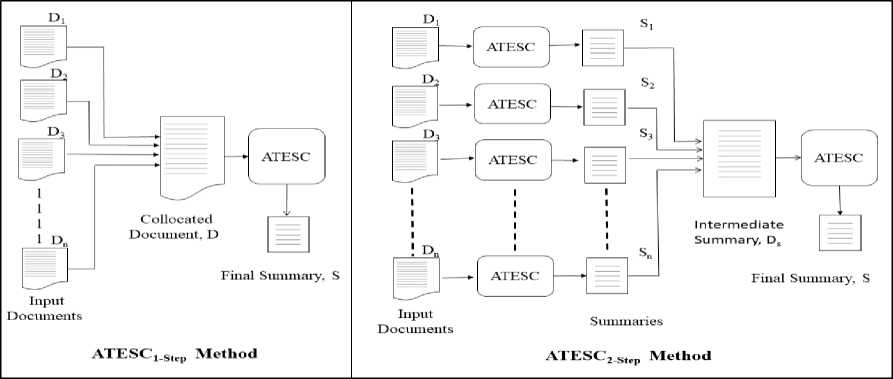
Fig.3. ATESC 1-step vs 2-step
-
1) ATESC1-step (1-Step method): In this method, multi-document summarization is carried out in a single document summarization fashion. Firstly, all the related input documents D 1 , D 2 ,......D n
-
2) ATESC2-step (2-Step method): This method applies
ATESC at two levels, say I and II to create the final summary from multiple input documents.
Level I : At the first level, ATESC is applied to each document D i from a related set of n documents (D) to generate individual summary S i . Further, all the generated n summaries are collocated one after the other in a single document Ds.
Level II : At the second level, ATESC is applied to DS to create the final summary S.
This technique ensures that no significant data is excluded from the final summary. It also selects only important data which manages to retain through two-step summarization process. Hence the quality of the produced summary is significantly high. The algorithm is highly efficient as the dataset is largely reduced during the first step of the two-step technique and irrelevant data is ignored thus providing an efficient and effective method of summarization.
-
VI. Experiments
-
A. Dataset and Experimental Setup
The experiments are conducted on the single and multi-document summarization tasks of the DUC (Document Understanding Conference) datasets2.
-
1) Single document summarization task: The
experiments are performed on DUC 2002 dataset which includes a single document summarization task (13 systems participated). The dataset contains 59 document clusters (567 documents in total) and their reference summaries (manually created abstracts). The two manually human created reference summaries are also provided for each document for evaluation purpose. The target
summary length limit is set to 100 words in this task.
-
2) Multiple document summarization task: The experiments are performed for task 2 on DUC 2003 and DUC 2004 datasets, both of which have used newswire/paper documents. Task 2 of both DUC 2003 and 2004 involve generic summarization of news documents clusters. DUC 2003 has 30 test document sets with approximately 10 news articles in each set. The target summary length is set to 100 words. DUC 2004 has 50 document clusters sets with approximately 10 news articles in each set. The target summary length for this task is 100 words.
All the experiments are performed on Intel(R) Pentium(R) CPU, P1600@2.00 GHz with 4.00 GB RAM and Windows 7 (64 bit) Home Premium edition. Python3 has been used for implementing proposed methods in this paper. The experiments have been designed for both single and multiple document summarization tasks in this section. The multiple experiments have been conducted in this paper with the proposed summarization methods for multi-document summarization i.e. ATESC1-step and ATESC2-step. In ATESC1-step, only one parameter needs to be set i.e. the number of clusters к since the clustering method used is unsupervised. In ATESC 2-step , it is desired to study the effect of a varying number of clusters ( к ), and Intermediate Summary Length ( ISL ) on the quality of the final summary. ISL is the length of summary to be generated after level I of the ATESC2-step method. In short, all the experiments revolve around following questions:
-
1) Which is better: in terms of Quality and Execution Time: ATESC 1-step or ATESC 2-step ?
-
2) What is the effect of a varying number of clusters ( к ) on the quality of the final summary?
-
3) What is the effect of varying Intermediate
Summary Length ( ISL ) on the quality of the final summary?
-
B. Evaluation via Quality
In this paper, the quality of a summarization method is assessed in terms of informativeness of a summary. One way of measuring it is by measuring the amount of information from the reference summary preserved by the system-generated summary. It has been measured by using ROUGE toolkit4 in this paper. Another way is to measure how much information has been preserved from the source text in the summary. It has been computed using Semantic Informativeness (S.I.) defined in [25].
-
1) ROUGE: It is used to evaluate performance of the methods [30]. ROUGE stands for Recall-Oriented Understudy for Gisting Evaluation and measures
the quality of a system generated summary by comparing it to human-generated summaries. A system generated summary is evaluated against four reference summaries (for multi-document summarization). Final scores are generated in terms of n-gram Precision, Recall and F-Score. ROUGE-N is a n-gram recall between a candidate summary and a set of reference summaries. The authors have chosen ROUGE-1, ROUGE-2 and ROUGE-SU4 metrics for comparison. ROUGE-1,2 are N-gram based ROUGE, where N = 1 and 2 respectively, denoting the size of the sequence of words. ROUGE-L denotes longest common subsequence and ROUGE-SU4 refers to skipbigrams with unigrams. Specifically, it is known that ROUGE-1 achieves a high correlation with human judgments. Also, ROUGE-2 and ROUGE-SU4 have done fairly well as evaluation metrics for short summaries.
-
2) Semantic Informativeness: The Semantic
Informativeness (S.I.) measure has been defined in [25] as follows:
length ( s ) length ( T )
S . I =(1
-
. ,weight ( s ) )( weight ( T ) )
where T represents the source text as a sequence of words and S can be viewed as a subsequence of T, where weight is some numerical function to calculate the importance of text. This paper has used inverse document frequency ( idf ) to calculate the weight of words using (2). idf is the popular term weighting function [26]. Thus, (6) can be redefined as follows:
. =(1 length ( s- ) )( ∈ S tdfk )
^ length ( T ))( ztk ∈ T ldfk
Where w k denotes the kth word and ^fk is the inverse document frequency of each word Wk .
C. Evaluation via Execution Time
The authors have performed complexity analysis of the methods in order to understand its time requirements to generate a summary. The execution time is an important criterion to measure the real-time performance of summarization methods. It is measured as total time taken to generate a summary from a single document or multiple documents. The actual execution times of the methods also have been recorded during experiments and expressed in terms of No. of seconds/Summary.
D. Complexity analysis
Regarding the complexity analysis of ATESC, the most computationally expensive steps are the construction of entailment matrix (TE) and the spectral clustering algorithm. The construction of TE has time complexity of O(n2) and application of spectral clustering whose most expensive step is the computation of eigenvalues/eigenvectors of Laplacian matrix is O(n3), where n is the average number of sentences in the document. Thus, the overall complexity of ATESC for single document summarization is O(n3). Next, the complexity analysis is completed for the methods
ATESC1-step and ATESC2-step. Results are compiled in Table 7.
Table 7. Complexity Analysis
|
Method |
Time Complexity |
|
ATESC 1-STEP |
O((d x n)3) |
|
ATESC 2-STEP |
dO(n3) |
Table 8. Results of ATESC method on DUC 2002 dataset
|
k |
Rouge - 1 |
Rouge – 2 |
Rouge - SUX |
S.I |
||||||
|
R (%) |
P (%) |
F 1 (%) |
R (%) |
P (%) |
F 1 (%) |
R (%) |
P (%) |
F 1 (%) |
||
|
3 |
43.83 |
45.5 |
44.42 |
18.64 |
19.35 |
18.9 |
15.82 |
19.04 |
16.80 |
0.77 |
|
4 |
43.99 |
45.78 |
44.6 |
18.78 |
19.55 |
19.07 |
16.02 |
19.45 |
17.02 |
0.77 |
|
5 |
44.09 |
45.91 |
44.72 |
18.9 |
19.71 |
19.21 |
16.10 |
19.63 |
17.10 |
0.77 |
|
6 |
44.08 |
45.61 |
44.64 |
18.81 |
19.51 |
19.08 |
16.02 |
19.21 |
16.98 |
0.77 |
-
VII. Results and Discussions
-
A. Single document Summarization
14. It indicates the effectiveness of spectral clustering in bringing connected information under relevant themes. This, in turn, brings forth the potential of textual entailment in providing a true picture of connectedness relationship between sentences in the form of the adjacency matrix of entailment scores. Lower values of
к
tend to merge clusters and higher values tend to scatter clusters. Both the cases affect the selection of sentences, which in turn affects the final quality of a summary.
The experiments are conducted to see the effects of a varying number of clusters, к , on the quality of the final summary. It is figured out from the results collected in Table 8 that the number of clusters, к directly affects the quality of the final summary. The optimum value of к ensures that all the themes are captured successfully and relative clusters are formed accordingly. This facilitates the selection of important sentences from all the topics of a document. It finally leads to high informativeness of the summary which is evident from high S.I. values itself in Table 8. The S.I. values of ATESC method are closer to S.I. values of the reference summaries as shown in Table
The ATESC method is also compared against other popular methods using the Recall values (since they are most correlated with manual evaluations). The comparative study indicates superior performance for ATESC as shown in Table 9. Comparisons are performed with:
-
1) DUC Baseline: The baseline summaries have been provided by DUC itself (first 100 words of the document can be used).
-
2) LTT: The method is re-implemented for this experiment to collect the results for DUC 2002 dataset. Refer to Section II for further details.
-
3) TOP DUC systems: The results of the two top performing systems (S28 and S21) in DUC 2002 has been taken from [27].
Again, Table 9 shows that the performance of ATESC is competitive with the top DUC systems.
Table 9. Comparison of ATESC method for Recall Scores on DUC 2002
|
Method |
ROUGE-1 |
ROUGE-2 |
ROUGE-SU4 |
|
ATESC |
44.09 |
18.90 |
16.10 |
|
LTT |
39.02 |
14.21 |
8.43 |
|
S28 |
42.8 |
17.31 |
21.77 |
|
S21 |
41.19 |
16.55 |
21.03 |
|
DUC Baseline |
41.13 |
16.60 |
20.80 |
-
B. Multi document Summarization
First, this section presents the results of ATESC1-step method in Tables 10 and 11. Again, the optimum value of к has been decided empirically by studying the effect of a varying number of clusters ( к) on ROUGE metric, S.I. and execution time requirements of the method. The results show that к = 6 and к = 4 are the optimum values for DUC 2003 and 2004 datasets respectively. At these values, the method has the highest ROUGE and S.I. scores. The optimum value of к will vary with the length and type of article. It has been noticed that the decrease in the value of к below 6 results in low informativeness of summaries. It happens because all the themes of the document are not accurately captured by the method due to the merging of clusters at lower values of к . This affects the final selection of sentences. As the value of k moves beyond 6, main clusters tend to divide into shorter clusters which invite the redundant sentences to move into summary decreasing the informativeness of the summary. Moreover, ATESC1-step has expensive time requirements and needs approximately 170 and 210 seconds/summary for DUC 2003 and 2004 datasets respectively, making it unsuitable for real-time summary generation.
Table 10. Results of ATESC 1-step method for DUC 2003 dataset
|
k |
Rouge - 1 |
Rouge – 2 |
Rouge – SUX |
Time(s) |
S.I |
||||||
|
R (%) |
P (%) |
F 1 (%) |
R (%) |
P (%) |
F 1 (%) |
R (%) |
P (%) |
F 1 (%) |
|||
|
4 |
35.62 |
32.18 |
33.8 |
7.89 |
7.13 |
7.49 |
7.70 |
8.92 |
8.13 |
136.4 |
0.71 |
|
5 |
35.23 |
31.95 |
33.5 |
8.04 |
7.28 |
7.64 |
7.86 |
9.04 |
8.29 |
147.9 |
0.72 |
|
6 |
35.97 |
32.68 |
34.24 |
9.15 |
8.17 |
8.91 |
8.04 |
9.18 |
8.44 |
170.2 |
0.72 |
Table 11. Results of ATESC 1-step method for DUC 2004 dataset
|
k |
Rouge - 1 |
Rouge – 2 |
Rouge – SUX |
Time(s) |
S.I |
||||||
|
R (%) |
P (%) |
F 1 (%) |
R (%) |
P (%) |
F 1 (%) |
R (%) |
P (%) |
F 1 (%) |
|||
|
4 |
32.55 |
32.2 |
32.36 |
6.24 |
6.18 |
6.21 |
7.05 |
7.80 |
7.28 |
211.3 |
0.71 |
|
5 |
32.39 |
31.99 |
32.17 |
6.01 |
5.94 |
5.97 |
6.77 |
7.62 |
7.03 |
212.0 |
0.71 |
|
6 |
32.31 |
31.89 |
32.04 |
6.1 |
6.05 |
6.07 |
6.89 |
8.09 |
7.31 |
217 |
0.71 |
Table 12. Results of ATESC 2-step method for DUC 2003 dataset
|
ISL, k |
Rouge - 1 |
Rouge – 2 |
Rouge – SUX |
Time(s) |
S.I |
||||||
|
R (%) |
P (%) |
F 1 (%) |
R (%) |
P (%) |
F 1 (%) |
R (%) |
P (%) |
F 1 (%) |
|||
|
100,4 |
34.47 |
31.57 |
33.09 |
7.33 |
6.64 |
6.97 |
7.40 |
8.39 |
7.76 |
9.3 |
0.76 |
|
100,5 |
34.69 |
31.81 |
33.17 |
7.28 |
6.67 |
6.96 |
6.84 |
8.79 |
7.58 |
10.4 |
0.75 |
|
100,6 |
35.12 |
32.11 |
33.53 |
7.8 |
7.13 |
7.45 |
6.92 |
8.15 |
7.38 |
9.6 |
0.76 |
|
300,4 |
35.48 |
32.32 |
33.82 |
7.48 |
6.81 |
7.13 |
6.98 |
8.92 |
7.73 |
15.8 |
0.72 |
|
300,5 |
36.37 |
33.08 |
34.64 |
7.96 |
7.23 |
7.58 |
7.52 |
9.11 |
8.10 |
14.9 |
0.73 |
|
300,6 |
36.2 |
32.94 |
34.49 |
7.93 |
7.21 |
7.55 |
7.47 |
9.21 |
8.11 |
15.0 |
0.74 |
|
500,4 |
36.5 |
33.15 |
34.74 |
8.22 |
7.46 |
7.82 |
8.07 |
9.24 |
8.48 |
16.5 |
0.73 |
|
500,5 |
36.96 |
33.64 |
35.21 |
7.98 |
7.24 |
7.59 |
7.60 |
9.23 |
8.2 |
16.7 |
0.73 |
|
500,6 |
35.58 |
32.4 |
33.91 |
7.64 |
6.96 |
7.28 |
7.25 |
9.25 |
8.02 |
16.7 |
0.73 |
|
700,4 |
36.27 |
33.03 |
34.57 |
8.01 |
7.29 |
7.63 |
7.26 |
8.81 |
7.83 |
20.3 |
0.72 |
|
700,5 |
36.69 |
33.16 |
34.69 |
7.52 |
6.84 |
7.16 |
7.98 |
9.65 |
8.62 |
21.2 |
0.73 |
|
700,6 |
35.74 |
32.44 |
34.01 |
7.83 |
7.09 |
7.44 |
7.50 |
9.15 |
8.14 |
21.7 |
0.73 |
Table 13. Results of ATESC 2-step method for DUC 2004 dataset
|
ISL, k |
Rouge - 1 |
Rouge – 2 |
Rouge – SUX |
Time(s) |
S.I |
||||||
|
R (%) |
P (%) |
F 1 (%) |
R (%) |
P (%) |
F 1 (%) |
R (%) |
P (%) |
F 1 (%) |
|||
|
100,4 |
32.97 |
33.23 |
33.09 |
6.32 |
6.37 |
6.34 |
7.32 |
8.76 |
7.85 |
13.4 |
0.75 |
|
100,5 |
32.96 |
32.99 |
32.97 |
6.04 |
6.03 |
6.04 |
7.18 |
8.17 |
7.55 |
13.6 |
0.76 |
|
100,6 |
32.37 |
32.48 |
32.42 |
6.05 |
6.07 |
6.06 |
6.80 |
8.38 |
7.36 |
15.4 |
0.76 |
|
300,4 |
32.68 |
32.81 |
32.74 |
5.56 |
5.57 |
5.56 |
6.18 |
7.86 |
6.82 |
17.3 |
0.73 |
|
300,5 |
32.83 |
32.84 |
32.82 |
6.08 |
6.07 |
6.07 |
6.82 |
8.00 |
7.24 |
18.1 |
0.72 |
|
300,6 |
33.33 |
33.43 |
33.37 |
6.17 |
6.18 |
6.17 |
6.92 |
8.56 |
7.55 |
20.4 |
0.73 |
|
500,4 |
33.03 |
33.12 |
33.07 |
6.03 |
6.03 |
5.03 |
6.82 |
8.35 |
7.40 |
20.1 |
0.73 |
|
500,5 |
33.49 |
33.65 |
33.57 |
6.33 |
6.36 |
6.34 |
6.93 |
8.32 |
7.40 |
21.5 |
0.72 |
|
500,6 |
33.32 |
33.5 |
33.41 |
5.92 |
5.95 |
5.93 |
6.84 |
8.45 |
7.41 |
20.2 |
0.72 |
|
700,4 |
33.12 |
33.21 |
33.16 |
5.97 |
5.97 |
5.97 |
6.73 |
8.40 |
7.36 |
23.6 |
0.73 |
|
700,5 |
33.13 |
33.24 |
33.18 |
6.02 |
6.03 |
6.02 |
6.73 |
8.40 |
7.36 |
24.3 |
0.72 |
|
700,6 |
33.07 |
33.12 |
33.09 |
5.98 |
5.98 |
5.98 |
6.64 |
8.07 |
7.15 |
24.5 |
0.73 |
ATESC2-step method has outperformed ATESC1-step method significantly in terms of ROUGE metrics, S.I. and Execution times as observed from the results shown in Tables 12 and 13 (DUC 2003 and 2004 datasets). The performance of ATESC 2-step method has been evaluated by studying the effect of varying two parameters: number of clusters ( к ) and Intermediate Summary Length ( ISL ) on the quality of the final summary. As the ISL increases, quality of summary also increases along with the increase in execution time as well. A trade-off can be seen between quality vs Execution Time. The optimum value of ISL and к for which method is performing best is 500,4 for 2003 data set and 500,5 for 2004 data set. The method exhibits faster execution times with an average value of 15 seconds/summary. After the optimal value, as ISL increases further, quality starts decreasing and execution time increases. Basically, ATESC2-step method starts converging to ATESC1-step method in terms of quality and time as the value of ISL increases.
Also, the comparison of semantic informativeness (S.I.) values of all the methods with respect to S.I. values of reference summaries in Table 14 advocates that the proposed methods in this paper are capable of bringing the salient content forward into the summary.
The ATESC 2-step method (being the best performing method in this paper) is also compared against following methods using Recall values (since they are most correlated with manual evaluations) in Tables 15 and 16.
-
1) Baseline: The baseline result has been computed in [28] using extracting random sentences from the clusters. The results show the median value after 5 reruns of the same method.
-
2) Lexrank: This system is again a popular graphbased summarization system [28] where input text is represented as a graph G (V, E), where V is the sentences in the input. There is an edge etj between two nodes Vt and Vj if and only if cosine similarity between them is above a threshold. Sentence importance is calculated by running the PageRank [29] algorithm on the text graph.
-
3) Classy: This system [31] with Peer 65 entry in DUC 2004 was the best among all DUC participants for that year. It employs a Hidden Markov Model, using signature words as the feature. They didn’t participate in the DUC 2003 conference. Thus, ATESC 2-step method can’t be compared with Classy on 2003 dataset.
The results for DUC 2003 dataset using Recall values in Table 15 show that ATESC2-step surpasses the baseline and state-of-the-art systems. Even for DUC 2004, ATESC2-step results are comparable to the state-of-the-art method and beat the baselines scores.
From above discussions and experimental results, it can be seen that ATESC2-step has performed better than ATESC1-step in terms of quality. This is because redundancy is controlled at two levels which allow only salient content to move into the summary that accounts for high ROUGE and informativeness scores. This conclusion also validates and highlights the contribution of spectral clustering towards redundancy removal in the proposed method. Execution time also is considerably less because of ATESC method being applied at two levels. The Complexity analysis of both the methods also reveals about the faster execution time of ATESC2-step method as compared to ATESC1-step.
In summary, this section reveals many interesting facts about ATESC2-step method. It is a simple and language independent method which doesn’t depend on expensive linguistic resources like parsers, stemmers for its working. This enables the method to achieve faster execution times making it a suitable method for real-time summary generation. Moreover, the combination of textual entailment and spectral clustering also facilitates the method to achieve high informativeness of the summaries in terms of ROUGE and S.I. scores.
Table 14. Comparison of Semantic Informativeness of summaries (S.I)
|
Method |
Dataset |
S.I. |
|
ATESC |
2002 |
0.77 |
|
Reference Summaries |
2002 |
0.88 |
|
ATESC 1-STEP |
2003 |
0.72 |
|
2004 |
0.71 |
|
|
Reference Summaries |
2004 |
0.91 |
|
ATESC 2-STEP |
2003 |
0.73 |
|
2004 |
0.72 |
|
|
Reference Summaries |
2004 |
0.85 |
Table 15. Comparison of ATESC 2-step results with state of the art systems on DUC-2003
|
Method |
ROUGE-1 |
|
Cont.LexRank |
36.46 |
|
ATESC 2-STEP |
36.96 |
|
Baseline 1 |
35.93 |
Table 16. Comparison of ATESC 2-Step results with state of the art systems on DUC-2004
|
Method |
ROUGE-1 |
|
Classy |
37.62 |
|
Cont.LexRank |
35.95 |
|
ATESC 2-STEP |
33.49 |
|
Baseline 1 |
32.38 |
-
VIII. Conclusions and Future Work
This paper reintroduces the ATESC method for single document summarization method with improved entailment score generation and sentence connection scoring criterion for determining their salience which has performed fairly well. The notions of textual entailment and spectral clustering complement each other and are the core strengths behind the ATESC algorithm. This paper has also proposed two ATESC based methods ATESC1-step and ATESC2-step for multi-document summarization. ATESC2-step has performed quite well for summarization tasks. However, the authors strongly feel about certain limitations of this research work which if addressed are expected to improve results further. Firstly, the entailment scoring technique doesn’t involve any semantics while determining entailment relations between sentences. Thus, it may be improved by incorporating semantics into the formula with the help of Wordnet [32], Word2Vec [33] and GloVe [34]. It will help in determining accurate entailment relations between sentences which will further improve the results of spectral clustering. In turn, the quality of summaries will be improved. Secondly, the method didn’t take care of coherence while selecting sentences for the summary which is essential for the comprehensibility of the summary. A summary with even high informativeness still requires coherence among sentences so that information is properly conveyed to the user. Lastly, the performance of these methods needs to be evaluated on a different genre of articles like fiction, scientific in addition to the news article since every genre follow different kind of inherent structure which may affect the performance of the method.
References Entailment and spectral clustering based single and multiple document summarization
- Gupta A, Kathuria M, Singh A, Sachdeva A, Bhati S. Analog textual entailment and spectral clustering (atesc) based summarization. In International Conference on Big Data Analytics 2012 Dec 24 (pp. 101-110). Springer, Berlin, Heidelberg.
- Goldstein J, Mittal V, Carbonell J, Kantrowitz M. Multi-document summarization by sentence extraction. In Proceedings of the 2000 NAACL-ANLP Workshop on Automatic summarization 2000 Apr 30 (pp. 40-48). Association for Computational Linguistics.
- Dagan I, Glickman O, Magnini B. The PASCAL recognising textual entailment challenge. In Machine learning challenges. evaluating predictive uncertainty, visual object classification, and recognising textual entailment 2006 (pp. 177-190). Springer, Berlin, Heidelberg.
- Tatar D, Tamaianu-Morita E, Mihis A, Lupsa D. Summarization by logic segmentation and text entailment. Advances in Natural Language Processing and Applications. 2008;15:26.
- SKOROKHOD K. Adaptive method of automatic abstracting and indexing. Information Processing 71. 1972:1179-82.
- Hoey M. Patterns of lexis in text.
- Gupta A, Kaur M, Mirkin S, Singh A, Goyal A. Text summarization through entailment-based minimum vertex cover. In Proceedings of the Third Joint Conference on Lexical and Computational Semantics (* SEM 2014) 2014 (pp. 75-80).
- Monz C, de Rijke M. Light-weight entailment checking for computational semantics. In Proc. of the third workshop on inference in computational semantics (ICoS-3) 2001.
- Jain AK, Dubes RC. Algorithms for clustering data.
- Jin Y, editor. Multi-objective machine learning. Springer Science & Business Media; 2006 Feb 10.
- Hartigan JA, Wong MA. Algorithm AS 136: A k-means clustering algorithm. Journal of the Royal Statistical Society. Series C (Applied Statistics). 1979 Jan 1;28(1):100-8.
- Yeung KY, Fraley C, Murua A, Raftery AE, Ruzzo WL. Model-based clustering and data transformations for gene expression data. Bioinformatics. 2001 Oct 1;17(10):977-87.
- Ng AY, Jordan MI, Weiss Y. On spectral clustering: Analysis and an algorithm. In Advances in neural information processing systems 2002 (pp. 849-856).
- Sarkar K. Sentence clustering-based summarization of multiple text documents. TECHNIA–International Journal of Computing Science and Communication Technologies. 2009 Jul;2(1):325-35.
- Zhang PY, Li CH. Automatic text summarization based on sentences clustering and extraction. In Computer Science and Information Technology, 2009. ICCSIT 2009. 2nd IEEE International Conference on 2009 Aug 8 (pp. 167-170). IEEE.
- Hamad D, Biela P. Introduction to spectral clustering. In Information and Communication Technologies: From Theory to Applications, 2008. ICTTA 2008. 3rd International Conference on 2008 Apr 7 (pp. 1-6). IEEE.
- Alpert CJ, Kahng AB, Yao SZ. Spectral partitioning with multiple eigenvectors. Discrete Applied Mathematics. 1999 Jan 15;90(1-3):3-26.
- Tilton JC. Image segmentation by region growing and spectral clustering with a natural convergence criterion. In Geoscience and Remote Sensing Symposium Proceedings, 1998. IGARSS'98. 1998 IEEE International 1998 Jul 6 (Vol. 4, pp. 1766-1768). IEEE.
- Sidi O, van Kaick O, Kleiman Y, Zhang H, Cohen-Or D. Unsupervised co-segmentation of a set of shapes via descriptor-space spectral clustering. ACM; 2011 Dec 1.
- Lauer F, Schnörr C. Spectral clustering of linear subspaces for motion segmentation. In IEEE Int. Conf. on Computer Vision (ICCV'09) 2009 Sep (pp. to-appear).
- Lafon S, Lee AB. Diffusion maps and coarse-graining: A unified framework for dimensionality reduction, graph partitioning, and data set parameterization. IEEE transactions on pattern analysis and machine intelligence. 2006 Sep;28(9):1393-403.
- Kamvar K, Sepandar S, Klein K, Dan D, Manning M, Christopher C. Spectral learning. In International Joint Conference of Artificial Intelligence 2003 Apr 20. Stanford InfoLab.
- Fouss F, Pirotte A, Renders JM, Saerens M. Random-walk computation of similarities between nodes of a graph with application to collaborative recommendation. IEEE Transactions on knowledge and data engineering. 2007 Mar;19(3):355-69.
- Zha H. Generic summarization and keyphrase extraction using mutual reinforcement principle and sentence clustering. In Proceedings of the 25th annual international ACM SIGIR conference on Research and development in information retrieval 2002 Aug 11 (pp. 113-120). ACM.
- Mani I. Summarization evaluation: An overview.
- Papineni K. Why inverse document frequency?. In Proceedings of the second meeting of the North American Chapter of the Association for Computational Linguistics on Language technologies 2001 Jun 2 (pp. 1-8). Association for Computational Linguistics.
- Mihalcea R, Tarau P. Textrank: Bringing order into text. In Proceedings of the 2004 conference on empirical methods in natural language processing 2004.
- Erkan G, Radev DR. Lexrank: Graph-based lexical centrality as salience in text summarization. Journal of artificial intelligence research. 2004 Dec 1;22:457-79.
- Page L, Brin S, Motwani R, Winograd T. The PageRank citation ranking: Bringing order to the web. Stanford InfoLab; 1999 Nov 11.
- Chin-Yew L, Och FJ. Looking for a few good metrics: Rouge and its evaluation. In Proceedings of the 4th NTCIR Workshops 2004.
- Conroy JM, Schlesinger JD, Goldstein J, O’leary DP. Left-brain/right-brain multi-document summarization. In Proceedings of the Document Understanding Conference (DUC 2004) 2004 May 6.
- Miller GA. WordNet: a lexical database for English. Communications of the ACM. 1995 Nov 1;38(11):39-41.
- Mikolov T, Sutskever I, Chen K, Corrado GS, Dean J. Distributed representations of words and phrases and their compositionality. In Advances in neural information processing systems 2013 (pp. 3111-3119).
- Pennington J, Socher R, Manning C. Glove: Global vectors for word representation. In Proceedings of the 2014 conference on empirical methods in natural language processing (EMNLP) 2014 (pp. 1532-1543).
