Estimation and Statistical Analysis of Physical Task Stress on Human Speech Signal

Author: Saloni, R. K. Sharma, Anil K. Gupta
Journal: International Journal of Image, Graphics and Signal Processing(IJIGSP) @ijigsp
Article in issue: 10 vol.8, 2016.
Free access
Human speech signal is an acoustic wave, which conveys the information about the words or message being spoken, identity of the speaker, language spoken, the presence and type of speech pathologies, the physical and emotional state of the speaker. Speech under physical task stress shows variations from the speech in neutral state and thus degrades the speech system performance. In this paper we have characterized the voice samples under physical stress and the acoustic parameters are compared with the neutral state voice parameters. The traditional voice measures, glottal flow parameters, mel frequency cepstrum coefficients and energy in various frequency bands are used for this characterization. T-test is performed to check the statistical significance of parameters. Significant variations are noticed in the parameters under two states. Pitch, intensity, energy values are high for the physically stressed voice; On the other hand glottal parameter values get decreased. Cepstrum coefficients shift up from the coefficients of neutral state voice samples. Energy in lower frequency bands was more sensitive to physical stress. This study improves the performance of various speech processing applications by analyzing the unwanted effect of physical stress in voice.
Speech signal, Physical task stress, Glottal flow parameters, MFCC, Energy, speech processing
Short address: https://sciup.org/15014021
IDR: 15014021
Text of the scientific article Estimation and Statistical Analysis of Physical Task Stress on Human Speech Signal
Published Online October 2016 in MECS
Speech is the most developed mean of communication. It is ‘making the sound- that become word-the physical act of talking’. The small number of basic elements phonemes are combined to form an infinite no of words and phrases. Speech has an important role in our society and in human culture. Speech not only gives the information regarding the message but also give a lot of other information about health, emotion, gender etc of a person. Speech has become an important research goal. Speech recognition, speaker identification, disease detection, emotion recognition are the numerous applications of speech analysis[1]. When human body is under physical stress, various body organs get affected[2,3]. Speech of a person also shows various changes in this condition. During the physical exercise body muscles needs more energy. Muscles get energy from the breakdown of ATP(Adenosine Triphosphate) chemicals in the following way.
ATP ^ ADP(AdenosineDiphosphate)+energy+P(phosphat e)
and for the formation of more ATP chemical we need more oxygen, as shown in equation below
ADP+MI^ATPAO IPO (2)
Blood picks up the oxygen from the lungs. So the lungs have to work hard, with a faster breathing rate and more O2 is to be delivered to the working muscles. Therefore the breathing rate increases. Breathing rate at rest is about 12 breathing per minute and it increases to about 30 breathing per minute on exercising.To supply more oxygenated blood, the heart rate increase from 72 beats per minute to 150 beats per minute.With these above effects the vocal functioning also get affected. In the larygeal area tightness is realized because vocal folds get adducted during the inhalation and exhalation process and airway opening get restricted[4]. In physical task stress, the utterance duration decreases and the number of voiced frames decrease[5]. With linear increase in the heart rate and the breathing rate the fundamental frequency also changes but in a non linear way[6]. Fundamental frequency is elevated for physically stressed voice as compare to the neutral voice. The standard deviation of F0(fundamental frequency) doesn’t show significant changes but on other hand jitter, PPQ5, shimmer values are high[7]. Spectrum of the voice also gives idea regarding the neutral and physical stress state of the person. Spectrum of the voice shows great change at the lower frequencies and at the higher frequencies[8]. On studying the glottal waveform of phsically stressed voice, it was observed that the glottal rise gets lowered in almost 88% cases[5]. Also due to faster expiratory flow rates, the subglottic pressure increases, due to which intensity of voice increases during physical exercise.Voice becomes more louder[7]. In this paper we discuss various aspects of physically stressed speech waveform and student’s t-test is applied to check the effectiveness of the parameters. Physically stressed speech analysis is helpful in military and sports applications.This study can also make our voice recognition, speaker recognition systems more robust to this effect and efficiency of the systems can be improved.
-
II. Data
The voice database collected for this research work consists of total 240 sustained vowel phonations. Database is useful as vowels have longer duration and large energy[1]. Four persons (two male and two female) were selected in the age group of 25-30 years, with an appropiate height and weight ratio and with complete physical fitness.They are asked to do a same physical task for ten days and their voice samples are recorded three times, before and after the task. We have recorded sustained phonation of vowel /ah/ for 2-3 seconds. The blood pressure and the heart rate increases after the physical workout. Blood pressure and heart beat database of persons is shown in Table 1.Voice recordings are made in a noise free room with the Sony ICD-UX513F recorder. The frequency response of the recorder lies in the range of 50-20,000 Hz. however under physical stress subjects could not cope up with required recording duration. Voices are recorded with a sampling frequency of 44100 Hz. Middle one second section is used for further processing because of presence of the onset and offset effects.
-
III. Methodology
The methodology of this paper consist of various features calculation techniques and paired t-test to check the effectiveness of the parameters.
-
A. Voice Traditional Features
The traditional features of voice include the pitch, jitter, autocorrelation, energy, intensity and formants. Pitch of a voice describes the average rate of vibration of vocal folds in frequency domain. It is calculated by taking short time autocorrelation of speech segment. Pitch defines how low or high voice tone is. For men and women pitch values are different. It is around 120 Hz for men and around 210 Hz for women. This is because of size differences of the vocal folds, reflecting male female larynx size. Most of the speakers show increase in their pitch under physical task stress [5]. Jitter is defined as small fluctuations in glottal cycle duration. As it is period perturbation, thus calculated by averaging the absolute difference between the successive periods of fundamental frequency and divided by the average period.
Jitter =
1 N -1
X T - T +J N -1 tf1 1 ' +11
N 1 T N ^ '
A formant is a particular frequency around which acoustic energy concentrates. Formants are because of joint resonance effect of vocal cavities. Formants depend on the shape of vocal tract. So, as the tongue moves to different positions, the shape of the vocal tract changes, and thus the formant frequencies change. Formants locations get shifted under physical stress from the locations in neutral state [5]. All these traditional features have been evaluated using PRAAT software [9]. These features play an important role in speech processing and are used for a large number of applications.
-
B. Glottal Flow Parameters
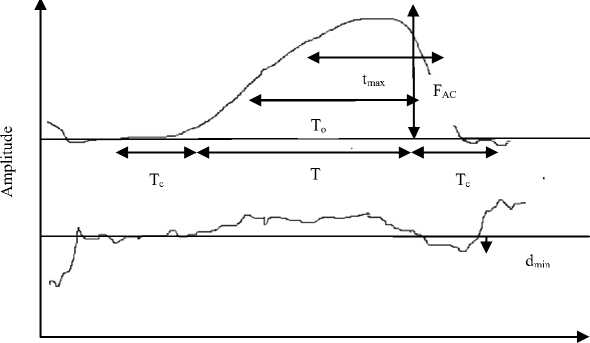
Our lungs generate airflow to make vocal folds to vibrate. So, this air flow is modulated in the larynx and a quasi periodic waveform, known as glottal flow is generated. Measurement of glottal flow is very difficult because of vocal folds position. However in recent decades, some invasive methods like video stroboscopy, kymography have been developed. These methods are very painful and expensive. Several non-invasive methods are also available for the estimation of glottal flow. GIF (Glottal Inverse Filtering) method is one such method in which the glottal waveform is obtained when speech signal is known, by the inverse filtering of speech signal, to remove the effects of vocal tract and lip radiation. So, the various parameters can be obtained from the glottal flow in the time domain. The time domain parameters are based on instants of glottal closure and opening, also the amplitudes on some specific points as shown in Fig.1. The open quotients OQ1 and OQ2 are the ratios of relative portions of open phase and total cycle duration. CIQ (closing quotient) is the measure of closing phase. AQ (amplitude quotient) and NAQ (normalized amplitude quotient) are the amplitude parameters. AQ is the ratio of peak to peak flow amplitude and minimum peak of pulse derivative. This parameter is normalized by dividing it with the total cycle length and is termed as NAQ [1, 10]. The glottal parameters are also chosen to identify the voice aging process of men and women. Values of OQ1 and OQ2 parameters increase with age [11]. Deceptive speech classification is also possible with the glottal waveform features [6]. Te is the parameter that is associated with glottal flow derivative using LF model. It is the glottal closing instant where flow rate decreases maximum.
Table 1. Blood pressure(BP) and heart rate(HR) of the persons before and after physical task for ten days.
|
Person 1 |
Person 2 |
Person 3 |
Person 4 |
|||||
|
Days 1 |
Before task(BP(HR)) 124/81(77) |
After task(BP(HR)) 175/84(146) |
Before task(BP(HR)) 130/82(74) |
After task(BP(HR)) 176/86(122) |
Before task(BP(HR)) 127/83(71) |
After task(BP(HR)) 178/87(130) |
Before task(BP(HR)) 119/80(84) |
After task(BP(HR)) 166/84(142) |
|
2 |
126/83(78) |
166/85(147) |
133/82(75) |
184/86(129) |
126/82(71) |
176/86(130) |
117/80(86) |
162/83(137) |
|
3 |
121/81(77) |
171/84(145) |
129/81(74) |
175/84(122) |
127/81(72) |
173/87(124) |
118/81(85) |
158/84(141) |
|
4 |
128/82(77) |
168/84(149) |
131/82(74) |
176/87(122) |
129/83(74) |
170/85(120) |
119/80(83) |
171/82(141) |
|
5 |
124/82(75) |
175/85(139) |
128/81(77) |
174/84(120) |
127/81(70) |
178/87(130) |
122/83(85) |
175/84(142) |
|
6 |
125/81(77) |
165/84(146) |
130/82(79) |
179/87(129) |
128/82(73) |
177/86(126) |
119/80(76) |
178/84(139) |
|
7 |
129/81(77) |
179/83(149) |
131/82(74) |
176/84(122) |
127/83(71) |
178/87(130) |
120/80(82) |
169/84(142) |
|
8 |
124/81(76) |
173/87(145) |
130/82(79) |
178/86(125) |
128/83(76) |
175/85(123) |
119/82(84) |
178/86(142) |
|
9 |
126/81(77) |
180/83(146) |
133/82(80) |
176/86(122) |
127/81(71) |
178/87(130) |
122/81(84) |
177/85(141) |
|
10 |
124/81(77) |
169/84(146) |
129/81(74) |
175/85(125) |
126/82(70) |
177/87(131) |
123/80(82) |
176/84(139) |
-
C. Mel-Frequency cepstral coefficients (MFCC)
Mel frequency cepstral coefficients are used in various speech applications like speech recognition, vocal fold disease detection [12,13,14]. An MFCC calculation is a non-parametric modeling method and follows the human auditory perception system. In this method inverse fourier transform of log magnitude spectrum of the signal is done. MFCC values are not very robust in the presence of additive noise, and so it is common to normalize their values in speech recognition systems to lessen the influence of noise.
-
D. Energy in frequency bands
Energy constrained in various frequency bands is calculated using matlab algorithm and then analyzed for the two different cases. The recorded voice signal is passed through the series of Butterworth band pass filters and then the energy of the filtered signal is calculated. Series of filters used are with the following frequency responses: 10-200Hz, 200-400Hz, 400-600Hz, 600-800 Hz, 800-1000Hz, 10000-2000 Hz, 2000-3000 Hz. Main concern of this work was on the lower frequency region.
E. T-test
T-test is a statistical hypothesis test used to determine whether the datasets are significantly different from each other or not. It illustrates the null hypothesis in an easy manner. T-test is used to check the effectiveness of the parameters extracted from the voice database in neutral state and under physical stress. Mathematically, T-test is done in the following way.
t =


s
X 1 X _
and

s1s2 nn
X 1 and X 2 are the two datasets and s2 is the unbiased estimator of the variance of the samples.
Time(s)
Person 1 Person 2 Person 3 Person 4
(b)
Person 1 Person 2 Person 3 Person 4
(a)
0.8
0.6
0.4
0.2
Person 1 Person 2 Person 3 Person 4
(c)
0.99
0.98
0.97
Person 1 Person 2 Person 3 Person 4
(d)
(a)
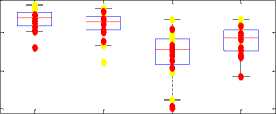
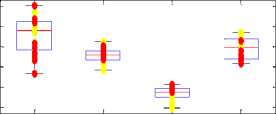
Fig.2. Pitch, SD, Jitter and A/c values Shows values under physical stress, • Shows values in neutral state
(b)
(c)
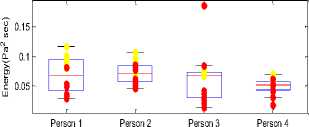
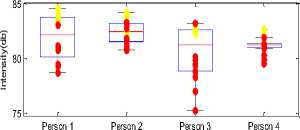
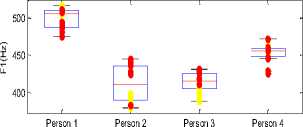
Fig.3. Energy, Intensity, 1st and 3rd Formant values
Person 1 Person 2 Person 3 Person 4
(d)
-
IV. Results
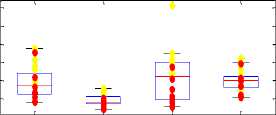
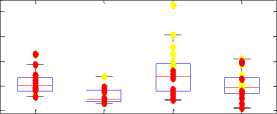
Parameters show variation in neutral state and in physical stressed state. The standard measures like jitter, pitch, standard deviation and auto-correlation are shown in Fig. 2.
The pitch value increases, when a person comes under physical stress. This increment in pitch is observed for all four persons under test. As voice become turbulent after physical workout, so the jitter and standard deviation values increase. Autocorrelation values didn’t give any significant result. Intensity level of physically stressed person increases and therefore energy also increases. Intensity measure reflects the loudness level of voice signal.
Formants values show different variation for male and female subjects. For (male) person 1 and 4 the first formant and third formant shift up when they are under physical stress. On other hand for female persons (2 and 3) the formant values came out low when physically stressed as compared to the neutral state. Among all traditional measures the pitch, jitter, Standard deviation, intensity, energy are the good characteristics for discriminating neutral voice from physically stressed voice.
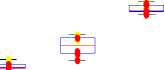
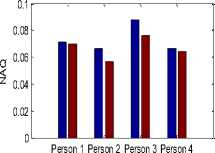
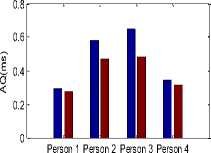
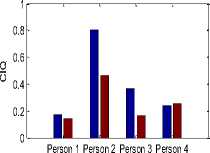
Glottal flow parameter values for physically stressed voice and neutral voice are shown in Figure 4. The values of parameters NAQ (normalized amplitude quotient), AQ (amplitude quotient), CIQ (closing quotient), OQ1 (opening quotient1), OQ2 (opening quotient 2) and Te (closing instant) get reduced for physically stressed voice. This pattern is common for all persons. In Fig. 4, average values of the parameters are shown.
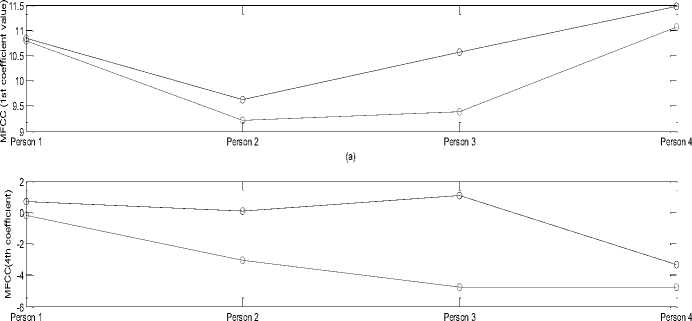
Mel frequency cepstral coefficients that are based on human auditory system also show difference in the values in two different states.1st and 4th MFCC values are high for physically stressed voice as shown in Fig. 5. The band pass filtering of voice signal is done using a series of band pass frequency sets and the energy of filtered signals is calculated. Energy of male persons is higher for physically stressed state in frequency range 10-200 Hz and 200-400 Hz. In 400-600 Hz and 600-800 Hz female voice tends to have high energy after physical work out.
(c)
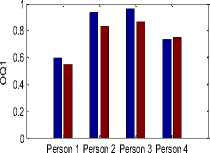
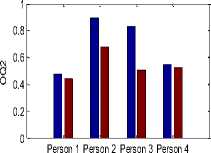
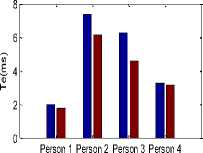
Fig.4. Glottal flow parameter values, Blue color column for neutral state parameter values and Brown color column
(b)
Fig.5. 1st and 4th MFCC values. Blue line is for physically stressed voice and red line for neutral state for parameter values under physical stress
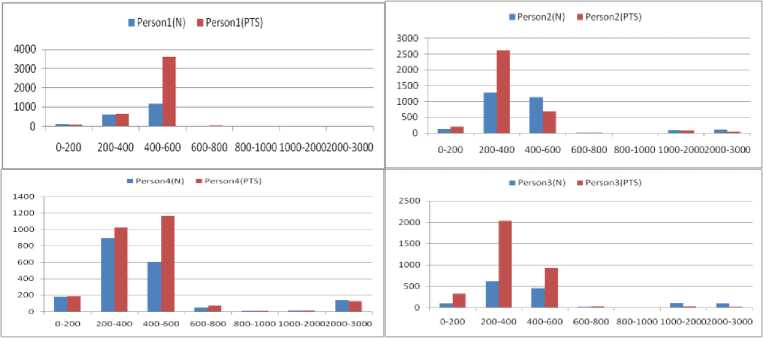
Fig.6. Energy confined in frequency bands for persons.
For all the extracted parameters, values in physically stressed state and neutral state, t-test is performed to check the statistical significance of parameters. For significant discrimination between the two states the value of T-test should be less than .05. T-test results show that the all proposed features are significant. Energies in particular frequency bands came out to be more compelling than the traditional measures.
-
V. Conclusion
Physical effort poses its effect on the voice of a person and leads to poor accuracy of speech system. So it is necessary to study the effect of physical task on the voice of a person. This study is presented in the paper. The traditional parameters, glottal flow parameters, MFCC,
Energy in frequency bands are studied for this analysis. Because of physical task stress the breathing rate and heart rate increases which imparts their influence on the voice parameters. T-test is performed to check the significance of parameters. Jitter, Standard deviation, intensity and energy in higher frequency bands are proved to be very significant parameters. In future the dataset can be enhanced and more precise classification can be done. Also, relation of intensity of physical work with parameter deviation can be experimented.
References Estimation and Statistical Analysis of Physical Task Stress on Human Speech Signal
- Alku, Paavo. "Glottal inverse filtering analysis of human voice production—A review of estimation and parameterization methods of the glottal excitation and their applications." Sadhana 36.5 (2011): 623-650.
- Haskell, William L., et al. "Physical activity and public health: updated recommendation for adults from the American College of Sports Medicine and the American Heart Association." Circulation 116.9 (2007): 1081.
- Primov-Fever, Adi, et al. "The Effect of Physical Effort on Voice Characteristics." Folia Phoniatrica et Logopaedica 65.6 (2013): 288-293.
- Mathers-Schmidt, Barbara A., and L. R. Brilla. "Inspiratory muscle training in exercise-induced paradoxical vocal fold motion." Journal of Voice 19.4 (2005): 635-644.
- Godin, Keith W., and John HL Hansen. "Analysis and perception of speech under physical task stress." INTERSPEECH. 2008.
- Johannes, Bernd, et al. "Non-linear function model of voice pitch dependency on physical and mental load." European journal of applied physiology 101.3 (2007): 267-276.
- Koblick, Heather M. Effects of Simulataneous Exercise And Speech Tasks On The Perception Of Effort And Vocal Measures In Aerobic Instructors. Diss. University of Central Florida Orlando, Florida, 2004.
- Godin, Keith W., and John HL Hansen. "Analysis of the effects of physical task stress on the speech signal." The Journal of the Acoustical Society of America 130.6 (2011): 3992-3998.
- Styler, Will. "Using Praat for linguistic research." University of Colorado at Boulder Phonetics Lab (2013).
- Airas, Matti. "TKK Aparat: An environment for voice inverse filtering and parameterization." Logopedics Phoniatrics Vocology 33.1 (2008): 49-64.
- Mendoza, Leonardo Alfredo Forero, et al. "Classification of voice aging using ANN and glottal signal parameters." ANDESCON, 2010 IEEE. IEEE, 2010.
- Chadawan Ittichaichareon, Siwat Suksri and Thaweesak Yingthawornsuk,"Speech Recognition using MFCC", International Conference on Computer Graphics, Simulation and Modeling (ICGSM'2012) , (2012),135-138.
- Saldanha, Jennifer C., T. Ananthakrishna, and Rohan Pinto. "Vocal fold pathology assessment using mel-frequency cepstral coefficients and linear predictive cepstral coefficients features." Journal of Medical Imaging and Health Informatics 4.2 (2014): 168-173.
- Zulfiqar, Ali, Aslam Muhammad, and AM Martinez Enriquez. "A speaker identification system using MFCC features with VQ technique." Intelligent Information Technology Application, 2009. IITA 2009. Third International Symposium on. Vol. 3. IEEE, 2009.
- Torres, Juan F., Elliot Moore, and Ernest Bryant. "A study of Glottal waveform features for deceptive speech classification." Acoustics, Speech and Signal Processing, 2008. ICASSP 2008. IEEE International Conference on. IEEE, 2008.
