Estimation of the Frocini criteria and omega square criteria statistics by the statistical tests method for a mixture of normal distributions
Автор: Ushanov S.V., Ogurtsov D.A.
Журнал: Сибирский аэрокосмический журнал @vestnik-sibsau
Рубрика: Информатика, вычислительная техника и управление
Статья в выпуске: 1 т.20, 2019 года.
Бесплатный доступ
A lot of sets of subjects and objects in biology, industry, management can be divided into a number of classes, each of which corresponds to a certain distribution component. When analyzing a mixture of distributions, it is necessary to estimate its parameters (task 1) and to assess the correspondence of empirical and theoretical distribution functions (task 2). To solve the first problem, numerical algorithms that implement the method of moments and the maximum likelihood method are used. In this paper, the problem of estimating the distribution parameters is solved by minimizing the good- ness measure by the Quasi-Newton method. The second problem is solved by comparing the empirical and theoretical distribution functions by one or several statistical goodness measures. Statistics of the distribution of these measures depends on the sample size, the method of forming data and estimating distribution parameters. The paper examines the goodness measure between Frocini and omega-square (Kramer - Mises - Smirnov). The evaluation of the statistics of the goodness measure was carried out by the simulation method based on the results of 50000 statistical tests. In each of the tests, the distribution parameters were estimated by minimizing the calculated value of the corresponding goodness measure. The results of simulation modeling allow estimating the statistics of the parameters of a mixture of distributions. The results of solving the considered problems for a mixture of two normal distributions of size 240 are pre- sented.
Frocini statistics, omega-square statistics, statistical tests, mixture of distributions
Короткий адрес: https://sciup.org/148321893
IDR: 148321893 | УДК: 519.23+519.245 | DOI: 10.31772/2587-6066-2019-20-1-28-34
Текст научной статьи Estimation of the Frocini criteria and omega square criteria statistics by the statistical tests method for a mixture of normal distributions
Introduction. One of the tasks of the initial processing of experimental observations is the choice of the distribution law, which adequately describes the random variable for the observed sample. A great number of sets of subjects and objects in biology, industry, management can be divided into a number of classes, each of which corresponds to a specific component of the distribution mix. In biological populations, it is possible to distinguish objects with average values of indicators, objects – indicators which are higher than average (“leaders”) and objects – indicators that are lower than average (“outsiders”) [1]. The dynamics of mass transfer processes of chemical technology depends on the size distribution of the raw materials, which is also determined by a mixture of distributions [2–4].
When analyzing a mixture of distributions, it is necessary to estimate its parameters (task 1) and to evaluate the compliance of empirical and theoretical distribution functions (task 2).
To solve the first problem, usually numerical algorithms are used that implement the method of moments [5] and the maximum likelihood method [6–8]. The peculiarity of this problem solution by the maximum likelihood method for a mixture of distributions is the presence of several local extrema. In this paper, the problem of estimating the distribution parameters is solved by minimizing the agreement criterion by QuasiNewton methods in MathCad [9] and MATLAB [10] environments.
The second problem is solved by comparing the empirical and theoretical distribution functions by one or several statistical criteria of agreement [5; 11]. Statistics of the distribution of these criteria depends on the sample size, the method of forming data and estimating distribution parameters [12]. The paper examines the criteria of consent Frocini [13; 14]
1 n
Fr( Xv , a ) = -/=• £ F ( XVj , a ) n = 1
i — 0.5
n
and omega square (Kramer – Mises – Smirnov) [15; 16]
KMC( Xv , a ) = — + У f F ( Xv, a ) — ——) , 12 n *=1 V n )
where Xv – variational series of random variable Х ; n – sample size; i – number of the element of the variation series; а – distribution parameters; F ( Xvi , a ) – the value of the integral distribution function for the element of a variational series Xv i .
The probability density function for a mixture of distributions consisting of K components has the form:
f ( , , a , ц ) = f , f, ( x , a, ), £ И , = 1, j = 1 j = 1
where x - random value; а, ц - distribution parameters; H j - the proportion of the j -th component in the mixture.
For a mixture of normal distributions, the probability density of the j -th component is determined by the expression
-
1 1 x — a , o
f(x,a,) =-----=■ exp -- ----, a,-0 ■ ^2u V 21 a,,1 ) )
where a j ,0 , a j ,1 – estimates of expected value and standard deviation.
The computer approach developed in the works of B. Yu. Lemeshko makes it possible to evaluate the statistics of the compliance criteria when testing various complex hypotheses [10; 16].
When conducting statistical tests, it is necessary to take into account the repetition period of the generated pseudo-random numbers. In the MathCad system, this period for a generator of normally distributed random variables is 784.4∙106 [17]. For sample size n = 1000, this allows to conduct 7 ∙ 105 statistical tests. At the level of significance a e [0.001; 0.999], the maximum error in estimating the statistics of the criteria under consideration does not exceed 0.0005 [14].
Results of computational experiments. The paper discusses the application of the Frocini criteria [18] and omega-square in estimating the distribution parameters for the analyzed sample by minimizing the calculated value of the corresponding criterion. In each computational experiment for evaluating the statistics of the compliance criteria, 50000 statistical tests were conducted.
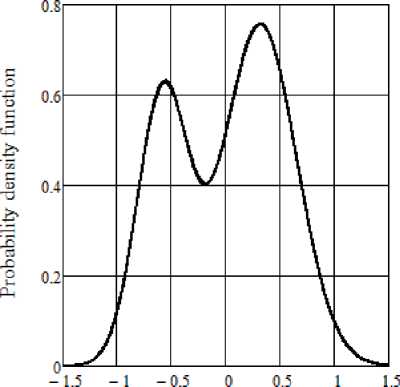
In fig. 1 the experimental errors in determining the hydrodynamic quality of the whip beams with a limited buoyancy margin are shown [19] (sample size n = 240), in fig. 2 distribution functions that approximate the empirical data with a mixture of two normal distributions are presented; in tab. 1, estimates of distribution parameters obtained by minimizing the Frocini criterion and omega-square are presented.
The maximum deviation between the integral functions of the mixture of distributions, the parameters of which are obtained by minimizing the Frocini criteria and the omega-square is 0.001 for x = –0.13, and between the probability density functions is 0.0078 for x = 0.10.
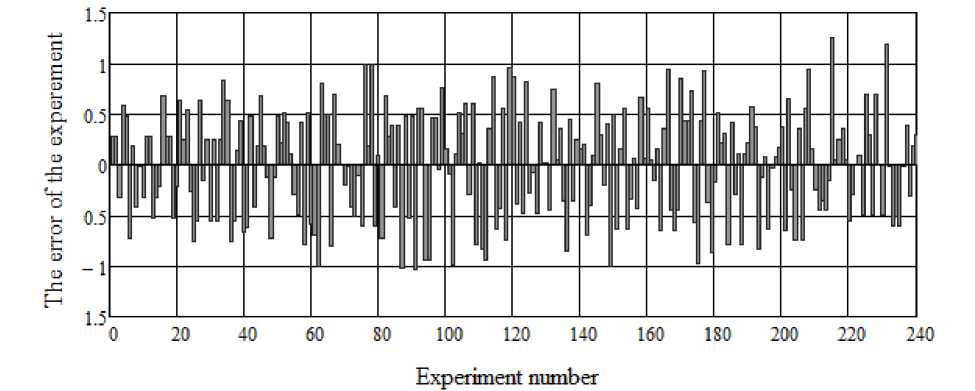
Fig. 1. Experimental errors in determining the hydrodynamic quality of whip beams with a limited buoyancy margin [19]
Рис. 1. Ошибки экспериментов при определении гидродинамического качества хлыстовых пучков с ограниченным запасом плавучести [19]

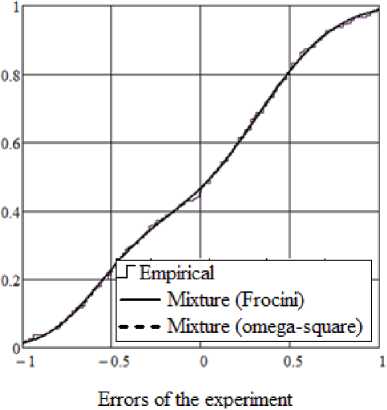
Fig. 2. Empirical and theoretical function of normal distributions mixture
Errors of the exoeriment
Рис. 2. Эмпирическая и теоретическая функции смеси нормальных распределений
Table 1
The optimal values of the parameters of the mixture of distributions and their estimates obtained by statistical testing (M = 5000, n = 240) by minimizing the Frocini criterion and omega-square
|
Parameter |
Optimal value |
Expected value |
Median |
Borders of 95 % Confidence Interval |
||
|
lower |
upper |
|||||
|
a 1.0 |
* |
–0.574 |
–0.569 |
–0.575 |
–0.672 |
–0.437 |
|
** |
–0.576 |
–0.574 |
–0.580 |
–0.671 |
–0.450 |
|
|
* |
0.0566 |
0.0588 |
0.0556 |
0.0279 |
0.112 |
|
|
a 1.12 |
** |
0.0549 |
0.0545 |
0.0510 |
0.0249 |
0.105 |
|
a 2.0 |
* |
0.322 |
0.318 |
0.320 |
0.198 |
0.438 |
|
** |
0.318 |
0.317 |
0.318 |
0.199 |
0.434 |
|
|
* |
0.104 |
0.119 |
0.116 |
0.067 |
0.191 |
|
|
a 2.12 |
** |
0.103 |
0.118 |
0.116 |
0.068 |
0.188 |
|
* |
0.361 |
0.367 |
0.366 |
0.243 |
0.514 |
|
|
µ 1 |
** |
0.357 |
0.353 |
0.349 |
0.231 |
0.483 |
*Calculations by Frocini criterion; **calculations based on the omega-square test.
Table 2
Calculated and critical values of the Frocini and omega-square criteria for a mixture of 2 normal distributions with a sample size of n = 240
|
Goodness measure |
Calculated values |
Critical value at significance level α |
|||||
|
0.05 |
0.10 |
0.15 |
0.20 |
0.25 |
0.30 |
||
|
* Frocini ** |
0.0776 0.0785 |
0.146 |
0.136 |
0.130 |
0.125 |
0.121 |
0.118 |
|
* Omega-square ** |
0.0104 0.0102 |
0.0348 |
0.0301 |
0.0277 |
0.0257 |
0.0241 |
0.0229 |
Distribution parameters obtained by minimizing the criteria: * Frocini; **omega-square.
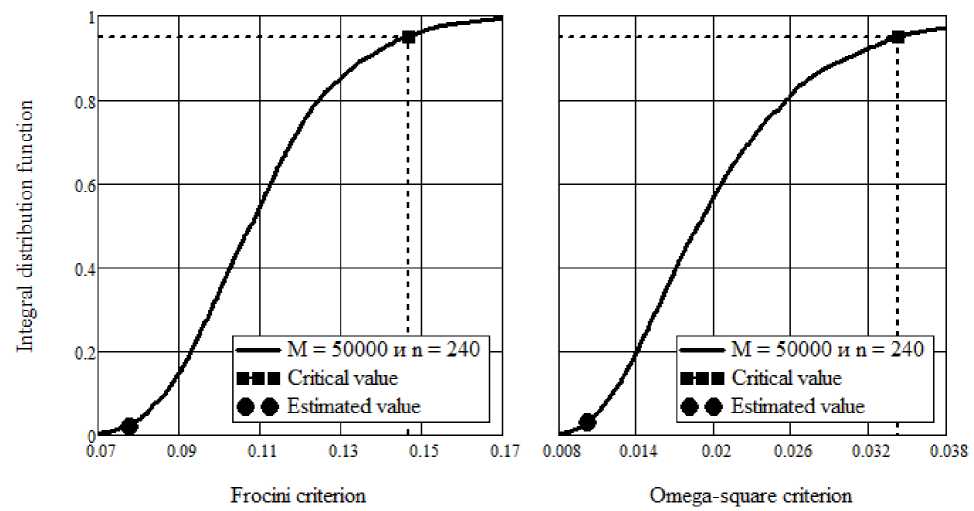
Fig. 3. The results of testing the hypothesis of compliance with the empirical distribution function and the mixture function of two normal distributions by Frocini and omega-square criteria
Рис. 3. Результаты проверки гипотезы соответствия эмпирической функции распределения и функции смеси двух нормальных распределений по критериям Фроцини и омега-квадрат
The calculated and critical values of the Frocini and omega-square criteria for a mixture of 2 normal distributions with a sample size of n = 240 are presented in tab. 2.
The visualization of the results of testing the hypothesis of compliance with the empirical distribution function with the mixture function of two normal distributions according to the Frocini and omega-square criteria is presented in fig. 3.
The simulation modeling results allow to evaluate the statistics of the parameters of the distributions mixture. In fig. 4–6 the results of the evaluation of the distribution of the parameters of the first and second components of the mixture, obtained from the results of statistical tests for the Frocini and omega-square agreement criteria, are presented.
Conclusion. The results of computational experiments allow to conclude about the effectiveness of obtaining estimates of distributions mixture parameters, minimizing the calculated values of the goodness measures. The use of different goodness measures allows improving the quality of the found estimates. The differences in the estimates of the parameters of the mixture of two normal distributions, obtained by minimizing the Frocini and omega-square criteria for experimental samples, did not exceed 1 %.
Evaluation of the distribution parameters in combination with the simulation method for evaluating the statistics of the goodness measure allows to test the complex hypothesis of consistency between the empirical and theoretical distribution functions. A related result of this task is an assessment of the statistics of the distribution parameters and confidence intervals of their change.
The choice of the minimum number of components of a distributions mixture is determined by the condition of accepting the hypothesis of compliance with the empirical and theoretical distribution functions.
Distribution function
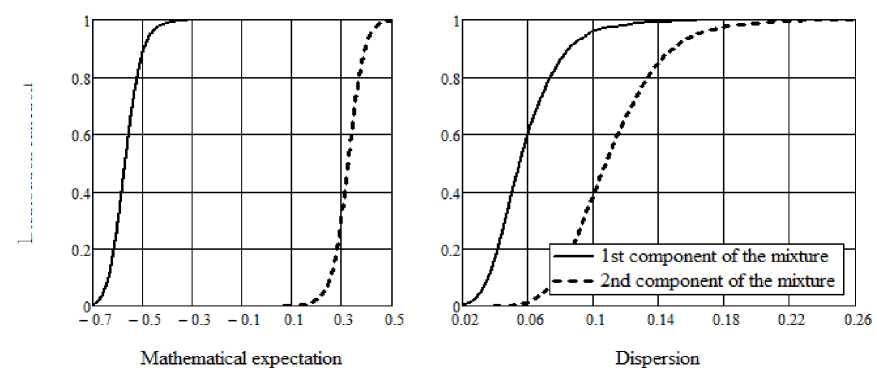
Fig. 4. Estimates of the distribution functions of expected values and dispersions of the mixture components
Рис. 4. Оценки функций распределения математических ожиданий и дисперсий компонентов смеси
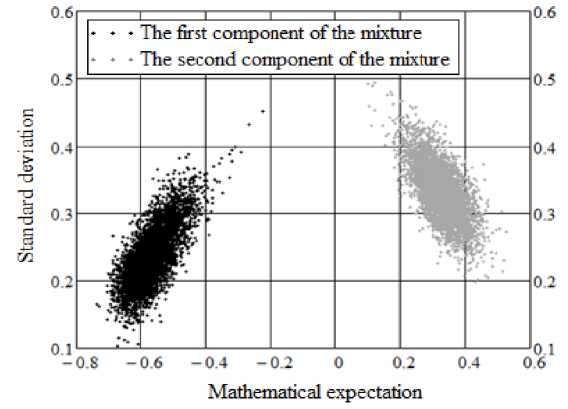
Fig. 5. Estimates of the distribution of the parameters of the first and second components of the mixture
Рис. 5. Оценки распределения параметров первой и второй компоненты смеси

The proportion of the first component in the mixture
The proportion of the first component in the mixture
Fig. 6. Estimates of the distribution of the mathematical expectation of the first and the second components and the proportion of the first component in the mixture
Рис. 6. Оценки распределения математических ожиданий первой и второй компоненты и доли первой компоненты смеси
Список литературы Estimation of the Frocini criteria and omega square criteria statistics by the statistical tests method for a mixture of normal distributions
- Павлов И. Н., Ушанов С. В. Исследование распределения деревьев сосны по диаметру методами анализа смесей распределений // Вестник СибГТУ. 2005. № 1. С. 38-46.
- Ушанова В. М. Комплексная переработка древесной зелени и коры пихты сибирской с получением продуктов, обладающих биологической активностью: автореф. дисс. … докт. тех. наук. Красноярск: СибГТУ, 2012. 34 с.
- Ушанова В. М., Ушанов С. В. Исследование процесса экстрагирования коры пихты сибирской сжиженным диоксидом углерода // Вестник КрасГАУ. 2009. № 12 (39). С. 39-44.
- Ушанова В. М., Ушанов С. В. Экстрагирование древесной зелени и коры пихты сибирской сжиженным диоксидом углерода и водно-спиртовыми растворами. Красноярск, 2009. 191 с.
- Кобзарь А. И. Прикладная математическая статистика. Для инженеров и научных работников. М.: Физматлит, 2006. 816 с.

