Evaluating and comparing size, complexity and coupling metrics as web applications vulnerabilities predictors

Author: Mohammed Zagane, Mustapha Kamel Abdi
Journal: International Journal of Information Technology and Computer Science @ijitcs
Article in issue: 7 Vol. 11, 2019.
Free access
Most security and privacy issues in software are related to exploiting code vulnerabilities. Many studies have tried to find the correlation between the software characteristics (complexity, coupling, etc.) quantified by corresponding code metrics and its vulnerabilities and to propose automatic prediction models that help developers locate vulnerable components to minimize maintenance costs. The results obtained by these studies cannot be applied directly to web applications because a web application differs in many ways from a non-web application: development, use, etc. and a lot of evaluation of these conclusions has to be made. The purpose of this study is to evaluate and compare the vulnerabilities prediction power of three types of code metrics in web applications. There are a few similar studies that targeted non-web application and to the best of our knowledge, there are no similar studies that targeted web applications. The results obtained show that unlike non-web applications where complexity metrics have better vulnerability prediction power, in web applications the metrics that give better prediction are the coupling metrics with high recall (> 75%) and fewer costs in terms of inspection (<25%).
Software Vulnerability, Web Application Security, Information Privacy, Code Metrics, Prediction Models, Machine Learning, Software Engineering
Short address: https://sciup.org/15016372
IDR: 15016372 | DOI: 10.5815/ijitcs.2019.07.05
Text of the scientific article Evaluating and comparing size, complexity and coupling metrics as web applications vulnerabilities predictors
Published Online July 2019 in MECS
Automatic software vulnerabilities prediction minimizes costs and time related to finding and fixing vulnerabilities. It allows developers to focus their efforts on most likely vulnerable components. The utility of this type of prediction becomes necessary when working on web application, because of its massive use and its online availability which facilitates the exploitation of its vulnerabilities.
A software vulnerability is a specific type of software defect that affects the information security of a software system. Therefore, defect prediction methods and approaches are also used to predict vulnerabilities, one of these methods is using software metrics as indicators of vulnerabilities, a largely used approach consists in dealing with the prediction problem as a binary classification problem where software metrics are used as training data to build prediction models based on supervised classification algorithms.
Code metrics are used to quantify some software features such as size, coupling, and complexity. Analyzing these code metrics and other categories of software metrics such as project, process and developer metrics, allows developers to control the development process as well as the quality of the software. Several research works [1-5] have proven through empirical studies the correlation between code metrics and vulnerabilities and reported that prediction models built using code metrics can perfectly indicate vulnerable components in software projects.
Datasets used to build and evaluate these prediction models are collected from previous versions of the studied software; they contain code metrics of each source file and information about its vulnerabilities if there are any. In cross-project prediction approach [3,6,7], datasets collected from other software are used; this type of prediction is useful when studying new software that does not have earlier versions or sufficient data on their vulnerabilities.
Knowing which type of code metrics that give good prediction results is very necessary to improve the quality of learning data and consequently the performance of the prediction models, it also helps to minimize the size of datasets by leaving only the useful metrics that give good prediction results. In the field of defect prediction, many studies targeted this problem and compared the prediction power of a wide range of software metrics such as [8] where researchers found that even after having removed 85% of the studied metrics, the performance of the prediction models was not affected.
In the field of vulnerabilities prediction, a few studies began comparing models built using different code and software metrics types. To the best of our knowledge, all of these studies have addressed non-web applications which differ in many ways from web applications. Therefore, the conclusions of these studies cannot be applied to the web application without further investigation, and many studies have to be carried out in this topic that still remains under-researched.
In this empirical study, we aim to fill the gap in this topic. We evaluate and compare the vulnerability prediction power of three major types of code metrics (size, complexity and coupling) in web application written in PHP which represents the most used programming language in developing this type of application. We use a high-quality dataset collected from three well-known and open source projects, several machine learning algorithms and a different comparison approach.
This paper is organized around the following sections: Section 2 presents the related work, Section 3 presents the research questions and hypotheses, Section 4 describes the approach adopted and the methodology followed to carry out the study, Section 5 presents the experimentations and discusses the obtained results, Section 6 presents the limitations and threat to validity, Section 7 summarizes the work done in this study and indicates some perspectives.
-
II. Related Works
A software vulnerability is a specific type of software defect that affects information security and privacy in a software system after successful exploitation by attackers. Therefore, techniques used for defect prediction are also used for vulnerability prediction.
Studying vulnerability prediction cannot be made without addressing the defect prediction. In this section, we begin by presenting related works on the defect prediction and then present the works on vulnerability prediction.
The number of related study on defect and vulnerability prediction is very large. For the sake of brevity, we only refer to the most relevant related studies that used code and software metrics as defect and vulnerability indicators.
-
A. Defects Prediction
Many research works have used code metrics for defects prediction. In [9] researchers used classic code metrics: Line of code metrics, McCabe metrics [10] and Halstead metrics [11] for defect prediction. To train and evaluate prediction models, they used NASA's MDP (Metrics Data Program) available with other datasets of other projects in the PCR (Promise Code Repository) [12], the predictors used were: OneR, J48 and naive Bayes. Researchers reported that they were able to predict over 71% of vulnerable files with less than 25% of negative prediction.
In [7] authors addressed several aspects of defect prediction, they did two types of analysis, the first one was a cross-project prediction, where the MDP dataset was used to learn a k-nearest neighbour predictor, which was then validated using data collected from 25 major software projects of a telecommunication company. In addition to classic code metrics available in the MDP dataset, they also studied call graphs based metrics CGBR (Call Graph-Based Rankin) [13], FanIn, FanOut and other metrics. They reported that the positive prediction rate was 15% using classic metrics and 70% using call graph based metrics. In the second analysis they studied defect prediction using decision rules based on recommended intervals for each metric, authors reported that the results obtained by this second analysis were 14% of positive prediction.
Authors in [8] studied the selection of metrics to define a relevant set of metrics that give a better defects prediction. They did a comparative study to evaluate their proposed selection approach. In that hybrid approach, they started by reducing the search space using feature ranking techniques. Then used several sub-feature selection techniques. Algorithms of both methods were evaluated and compared. Authors reported that even after removing 85% of studied metrics, the performances of the defect prediction models were not affected.
-
B. Vulnerabilities Prediction
The success of prediction methods that use code metrics as defects indicators has encouraged researchers to use these approaches for vulnerabilities prediction. Authors in [13] did a study to determine if VPMs (Vulnerability Prediction Models) are accurate and provide relevant recommendations when allocating maintenance resources. They used several statistical learning models: LR, NB, RF, RP, SVM, TB, applied on two versions of the Windows operating system (Windows 7 and Windows 8). Based on the obtained results, the authors concluded that VPMs need to be refined by using security-specific metrics.
Authors in [1] also reported that it is difficult to build good VPMs using limited data on vulnerabilities, in their study they used a dataset extracted from the NVD (National Vulnerability Database).
This lack of data on vulnerabilities, motivated researchers to provide datasets that can be used to develop and test VPMs. Authors in [2] proposed a public dataset contains data (code metrics and text mining data) of 223 vulnerabilities found in three major open source web applications: Moodle, Drupal and PHPMyAdmin. They also used this dataset to compare and evaluate VPMs based on code metrics and text mining. They reported that models built using text mining are better than models built using code metrics. They invited the research community to use this dataset to evaluate more VPMs. Indeed, Alenezi and Abunadi in [3,4] used the dataset proposed in [2] to evaluate several VPMs based on code metrics and cross-project prediction, they reported that code metrics are good indicators of web application vulnerabilities.
Authors in [14] also used this dataset to develop a software vulnerability prediction web service based on deep learning. In this study, we used a dataset extracted from this dataset to compare the vulnerabilities prediction power of three types of code metrics (size, complexity and coupling).
In [15] authors compared the vulnerability prediction power of complexity, code churn, and developer activity metrics; they used data from two open source project: Mozilla Firefox and Linux kernel. Authors in [5] compared the predictability power of complexity, coupling and a newly proposed set of coupling metrics, they used data collected from several open source software: Apache Tomcat, Eclipse, Mozilla Firefox and Linux kernel. In both studies [5, 15] that compared vulnerabilities prediction power of several code metrics types and focused on non-web applications, it was concluded that complexity metrics have better correlation with vulnerabilities than other types of code metrics. To the best of our knowledge, there are no similar studies that compared the predictability power of code metrics types in web application written in PHP and the study presented in this paper is the first study that focuses on this subject.
Authors in [16] and as part of their study, they theoretically examined and reviewed the most significant attempts in the vulnerability prediction models (VPMs) mechanisms. The work done, represents a good reference to gain a solid understanding of existing solutions in the field of vulnerabilities prediction.
-
III. Research Questions and Hypotheses
In this section, we present the research questions related to our study and propose the hypotheses.
-
A. Research Questions
Researchers who did similar studies that compared the predictability power of code metrics types in non-web application [5,15,17] validated the hypothesis according to which the complexity of the code is the cause of most security problems in software. They concluded that complexity metrics are stronger vulnerability predictors than other types of metrics.
Based on the results reported in these studies and the fact that web applications are different in many ways from non-web applications: online availability, programming languages, the execution context, etc.
We formulate the following research questions:
-
• Question 1: Like non-web applications, are complexity metrics the best indicators of vulnerabilities in web applications written in PHP than other metrics types?
-
• Question 2: If not, what is the metrics type (Size or Coupling) that can give a better vulnerability prediction in web applications written in PHP?
-
B. Hypothesises
-
• Hypothesis 1: As in non-web applications, code complexity is the major cause of vulnerabilities in web applications written in PHP, and complexity metrics are the best indicators of web applications vulnerabilities than coupling and size metrics.
-
• Hypothesis 2: Large modules are more likely to be vulnerable and size metrics are the most powerful in predicting vulnerabilities in web applications written in PHP.
-
• Hypothesis 3: High coupling is the source of the vulnerabilities and the coupling metrics are the best indicators of vulnerabilities in web applications written in PHP.
-
IV. Approach and Methodology
To answer the research question, we did an empirical study. This section present the approach adopted and the methodology followed to carry out this study.
-
A. Approach
To carry out this study and answer the research questions asked in the previous section, we have adopted an approach widely used in the previous works in the field of defects and vulnerabilities prediction. In this approach, the prediction problem is treated as a problem of supervised binary classification [18].
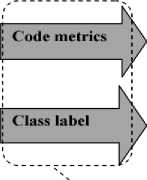
For each of the three applications: Drupal, PHPMyAdmin and Moodle, all files containing PHP source code were retained and labelled as either “vulnerable” or “clean”. The vulnerability status of a file is the dependent variable. Independent variables are the code metrics (fan-in, fan-out, lines of code,...) [2]. All these information were collected in a dataset witch it’s used to train and validate prediction models based on supervised classification algorithms(Figure 1).
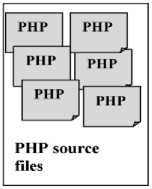
; Extracting code metrics
I and vulnerability
; information from each
; source file
Construction of the prediction model using a supervised classification algorithm
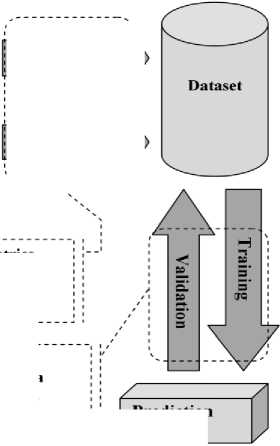
Prediction model
Fig.1. Approach adopted.
-
a. Comparison Approach
Previous vulnerabilities prediction studies [2-4, 14]
that targeted web applications and used the same dataset, evaluated models built using a single type of data (metrics) and different machine learning algorithms and techniques.
In this paper, we propose a different comparison approach. In our approach, we focus on comparing models built using several types of data (metrics). For completeness, we use several machine learning algorithms. However, this is not used to draw conclusions in the comparison.
To the best of our knowledge, we are the first to investigate this comparison approach in the field of web application vulnerabilities prediction.
-
B. Methodology
In this subsection, we present the methodology followed to carry out the study:
-
• Preparation of the data set,
-
• Construction of the prediction models,
-
• Evaluation of the prediction power of each model.
-
a. Preparation of the Dataset
To learn and validate the prediction models, we extracted a dataset from the dataset developed by [2], this dataset was already used in several previous studies [2–4,14]. It is a hand-curated dataset with a size of over than 3480 instances. It is built from three large open source web applications: Moodle, Drupal and
PHPMyAdmin. A well known and largely used set of code metrics were added to this dataset :
-
V Lines of code,
-
V Lines of code non-HTML,
-
V Number of functions,
-
V Cyclomatic complexity,
-
V Maximum nesting complexity,
-
V Halstead’s volume,
-
V Total external calls,
-
V Fan-in,
-
V Fan-out,
-
V Internal functions or methods called,
-
V External functions or methods called,
-
V External calls to functions or methods .
The nature of this comparative study has forced us to modify this dataset to prepare a version that meets our needs. For this, we have done the steps shown in Figure 2 and described in the following paragraphs.
-
• Combination of all projects data: To increase the number of instances, which give the models a lot to learn about the characteristics of PHP files [3], we combined the data of the three projects into one set.
-
• Reorganization of Data: this step consists of reorganizing and distributing the data in three parts (files). Each part contains data for a particular type of metrics: size, complexity, and coupling as shown in Table1.


Original Dataset
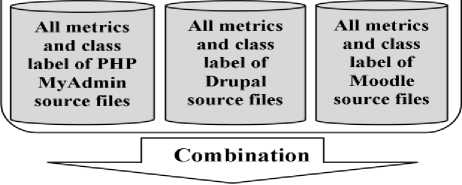
Combined Data
All metrics and class label of the three projects source files
Reorganisation
Our Dataset
Size metrics and class label of all projects source files
Coupling metrics and class label of all projects source files
Complexity metrics and class label of all projects source files
Fig.2. Preparation of the dataset
Table 1. Code metrics types
To construct prediction models, we used and compared three well-known algorithms: KNN, Random forest and Decision Trees. We used the cross-validation technique used and well described in [2] to learn and validate the prediction models. In this standard technique, instances are randomly divided into folds of equal size. Iteratively, each fold is retained as the testing set. That is, a prediction model is built starting from the samples in the other folds (training set), and the model is used to predict the class of the files in the testing set.
-
c. Performance Evaluation
The prediction result of a model can be one of four cases: True Positive (if a vulnerable file is predicted as vulnerable by the model), True Negative (if a clean file is predicted as clean by the model), False Positive (if a clean file is predicted as vulnerable by the model), False Negative (if a vulnerable file is predicted as clean by the model).
From the TP, TN, FP, and FN we can calculate several measures that can be used to evaluate the prediction performance of each model. We used four well-known performance indicators and widely used in the field of security [2]:
-
• Recall: this indicator gives the percentage of vulnerable files that are correctly classified by the model.
TP
Recall= TP *100
TP+FN
-
• Inspection: Provides an indication of the cost of the percentage of files that must be inspected to find the TPs identified by the model.
Inspection=
TP+FP TP+TN+FP+FN
*100
-
• FP Rate: The false positive rate measures the percentage of misclassification positive among the real negatives.
„ FP .
FP Rate = *100
FP+TN
-
• FN Rate: The false negative rate measures the percentage of negatives that are falsely classified as real positives.
FN
FN Rate = *100
FN+TP
-
V. Experiments and Results Discussion
In this section, we present the experiments carried out as part of this study and discuss the obtained results.
-
A. Experiments
The objective of this study is to compare the vulnerabilities prediction power of three types of code metrics: size, complexity, and coupling in web application. Experiments were performed as follow: we built three prediction models, the first using size metrics, the second using complexity metrics and the third using coupling metrics. Then, the performances of these models are compared considering four performance indicators: recall, inspection, FP rate and FN rate. We repeated this using three well-known classification algorithms: KNN, Random forest and Decision Trees.
The experiments are carried out using Weka [18, 19] version 3.8.1 for building and validating the prediction models and R [20] version 3.4.3 for calculating the performance indicators. We took shell scripts (.sh files) provided in the replication dataset available in [21] and provided by [2]. We modified these scripts, to adapt them to the objectives of our study.
-
B. Results and Discussion
Table 2 shows a comparison of the results of the three types of code metrics (size, complexity and coupling) using three different classification algorithms (RF, TREE and KNN). The comparison can be made considering four performance indicators (Recall: the higher the better, while Inspection, FP rate and FN rate: the lower the better).
As can be seen and contrary to what we expected in hypothesis 1 and hypothesis 2, the best prediction performances were not given by the complexity metrics, nor by the size metrics. In fact, coupling metrics achieved the best performance in all performance indicators using RF and KNN, the Recall was higher (RF: +8%, +11%; KNN: +4%, +7%) compared to the complexity metrics and size metrics respectively. The Inspection was lower (RF: -12%, -10%; KNN: -9%, -3%) and the same for the two other indicators : lower FP Rate (RF: -12%, -10%; KNN: -8%, -3%), lower FN Rate (RF: -8%, -11%; KNN: -4%, -7%). Coupling metrics also achieved the best value in Inspection, FP Rate and FN Rate using TREE.
Complexity metrics achieved the best value only in metrics, and in some other cases compared to the size
Recall using TREE (+5) compared to the coupling metrics.
Table 2. Results obtained (Performance indicators)
|
Metrics |
Recall (%) |
Inspection (%) |
FPR (%) |
FNR (%) |
|
|
Random Forest |
Size |
67 |
34 |
33 |
33 |
|
Complexity |
70 |
36 |
35 |
30 |
|
|
Coupling |
78 |
24 |
23 |
22 |
|
|
Decision Tree |
Size |
63 |
25 |
24 |
37 |
|
Complexity |
78 |
39 |
38 |
22 |
|
|
Coupling |
73 |
25 |
24 |
27 |
|
|
KNN |
Size |
65 |
27 |
26 |
35 |
|
Complexity |
68 |
33 |
31 |
32 |
|
|
Coupling |
72 |
24 |
23 |
28 |
Table 3. Additional performance indicators
|
Metrics |
Precision (%) |
Accuracy (%) |
|
|
Random Forest |
Size |
6 |
67 |
|
Complexity |
6 |
66 |
|
|
Coupling |
10 |
77 |
|
|
Decision Tree |
Size |
8 |
75 |
|
Complexity |
7 |
63 |
|
|
Coupling |
10 |
76 |
|
|
KNN |
Size |
8 |
74 |
|
Complexity |
7 |
69 |
|
|
Coupling |
10 |
77 |
In related work, often additional performance indicators (precision, accuracy) are reported. For the sake of completeness, in Table 3 these two additional indicators are reported. As can be seen, coupling metrics also achieved the best values in precision and accuracy with the three used classifiers. On average, we did not observe major differences between the values obtained by complexity metrics and size metrics in precision. In the accuracy, size metrics did better than complexity metrics.
We also tested the potential for using a model built using data combined from complexity and size metrics. The results obtained by this model are reported in Table 4. We can observe an improvement in performance compared to complexity metrics or size metrics alone. However, its performance still low than the performance of coupling metrics alone.
Table 4. Results obtained by combinng complexity and size metrics
|
Metrics |
Recall |
Inspection |
FP Rate |
FN Rate |
|
|
Random Forest |
Complexity + Size |
72% |
31% |
30% |
28% |
|
Decision Tree |
Complexity + Size |
70% |
34% |
33% |
30% |
|
KNN |
Complexity + Size |
68% |
30% |
29% |
32% |
The results obtained in this empirical study that used a dataset collected from three popular and open source web applications, allow us to validate hypothesis 3 and conclude that: coupling metrics are the best indicators of vulnerabilities in web applications written in PHP than complexity and size metrics.
We can interpret these results as follows: web applications differ in many ways from other types of applications: online availability, programming languages, execution context, etc., that's why a type of metrics cannot give the same prediction performance in web applications as in other types of applications. The dynamic nature of dependencies in PHP and a high coupling increase the complexity of the code which is the enemy of security in software as it reported in previous studies; it also increases the effect of vulnerable code and its execution potential. In addition, a lot of vulnerabilities in web applications written in PHP are related to the misuse of inclusion statements like include, which is also a sign of coupling.
-
VI. Limitations and Threats to Validity
In this study, we used a dataset extracted from a dataset proposed by [2] and already used in several previous studies [2-4, 14]. Since all the steps of experiments and especially the steps of preparing the modified dataset were well-explained and the original dataset is publicly available [21] we believe that our results are credible and can be reproduced.
This study concerned web application written in the PHP programming language. We cannot say whether these results generalize outside of all web application (including those which are written in other languages).
In this study, we explored three well-known and major types of code metrics: complexity, size and coupling. However, other types of code and software metrics should be considered in future work.
-
VII. Conclusions
In this study, we evaluated and compared the vulnerabilities prediction power of three types of code metrics (size, complexity, and coupling) in web applications written in PHP. We used a dataset collected from three major and open source applications (Moodle, Drupal and PHPMyAdmin). We treated the prediction problem as a binary supervised classification problem. Three well-known classifiers (RF, TREE and KNN) are used to build prediction models, which evaluated using cross-validation technique and considering several performance indicators.
The results showed that unlike other types of applications where complexity metrics are the best indicators of vulnerabilities, the coupling metrics achieved the best performance than complexity metrics and size metrics.
As we said in limitation and threats to validity section, we used a well-known and widely used set of code metrics in this empirical study. However, the future work will be devoted to other similar studies on other systems considering other types of metrics and using advanced techniques of deep learning.
References Evaluating and comparing size, complexity and coupling metrics as web applications vulnerabilities predictors
- S. Zhang, D. Caragea, and X. Ou, “An empirical study on using the national vulnerability database to predict software vulnerabilities,” Lect. Notes Comput. Sci. (including Subser. Lect. Notes Artif. Intell. Lect. Notes Bioinformatics), vol. 6860 LNCS, no. PART 1, pp. 217–231, 2011.
- J. Walden, J. Stuckman, and R. Scandariato, “Predicting vulnerable components: Software metrics vs text mining,” Proc. - Int. Symp. Softw. Reliab. Eng. ISSRE, pp. 23–33, 2014.
- M. Alenezi and I. Abunadi, “Evaluating software metrics as predictors of software vulnerabilities,” Int. J. Secur. its Appl., vol. 9, no. 10, pp. 231–240, 2015.
- I. Abunadi and M. Alenezi, “Towards Cross Project Vulnerability Prediction in Open Source Web Applications,” in Proceedings of the The International Conference on Engineering & MIS 2015 - ICEMIS ’15, 2015, pp. 1–5.
- S. Moshtari and A. Sami, “Evaluating and comparing complexity, coupling and a new proposed set of coupling metrics in cross-project vulnerability prediction,” in Proceedings of the 31st Annual ACM Symposium on Applied Computing - SAC ’16, 2016, pp. 1415–1421.
- B. Turhan, A. Bener, and T. Menzies, “Nearest neighbor sampling for cross company defect predictors,” in Proceedings of the 1st International Workshop on Defects in Large Software Systems (DEFECTS’08), 2008, p. 26.
- B. Turhan, G. Kocak, and A. Bener, “Data mining source code for locating software bugs: A case study in telecommunication industry,” Expert Syst. Appl., vol. 36, no. 6, pp. 9986–9990, 2009.
- K. Gao, T. M. Khoshgoftaar, H. Wang, and N. Seliya, “Choosing software metrics for defect prediction: an investigation on feature selection techniques,” Softw. Pract. Exp., vol. 41, no. 5, pp. 579–606, Apr. 2011.
- T. Menzies, J. Greenwald, and A. Frank, “Data Mining Static Code Attributes to Learn Defect Predictors,” IEEE Trans. Softw. Eng., vol. 33, no. 1, pp. 2–14, 2007.
- H. Watson, T. J. McCabe, and D. R. Wallace, “Structured Testing: A Testing Methodology Using the Cyclomatic Complexity Metric,” NIST Spec. Publ., pp. 1–114, 1996.
- V. Y. Shen, S. D. Conte, and H. E. Dunsmore, “Software Science Revisited: A Critical Analysis of the Theory and Its Empirical Support,” IEEE Trans. Softw. Eng., vol. SE-9, no. 2, pp. 155–165, 1983.
- “Promise software engineering repository.” [online]http://promise.site.uottawa.ca/SERepository/datasets-page.html (Accessed 20 July 2018).
- P. Morrison, K. Herzig, B. Murphy, and L. Williams, “Challenges with applying vulnerability prediction models,” in Proceedings of the 2015 Symposium and Bootcamp on the Science of Security - HotSoS ’15, 2015, vol. 14, no. 2, pp. 1–9.
- C. Catal, A. Akbulut, E. Ekenoglu, and M. Alemdaroglu, “Development of a Software Vulnerability Prediction Web Service Based on Artificial Neural Networks,” in Pacific-Asia Conference on Knowledge Discovery and Data Mining, 2017, pp. 59–67.
- Y. Shin, A. Meneely, L. Williams, and J. A. Osborne, “Evaluating complexity, code churn, and developer activity metrics as indicators of software vulnerabilities,” IEEE Trans. Softw. Eng., vol. 37, no. 6, pp. 772–787, 2011.
- M. Siavvas, E. Gelenbe, D. Kehagias, and D. Tzovaras, “Static analysis-based approaches for secure software development,” Commun. Comput. Inf. Sci., vol. 821, no. April, pp. 142–157, 2018.
- Y. Shin and L. Williams, “An empirical model to predict security vulnerabilities using code complexity metrics,” in Proceedings of the Second ACM-IEEE international symposium on Empirical software engineering and measurement - ESEM ’08, 2008, p. 315.
- A. Nakra, “Comparative Analysis of Bayes Net Classifier , Naive Bayes Classifier and Combination of both Classifiers using WEKA,” I.J. Inf. Technol. Comput. Sci., vol. 11, no. March, pp. 38–45, 2019.
- G. Holmes, A. Donkin, and I. H. Witten, “WEKA: a machine learning workbench,” in Proceedings of ANZIIS ’94 - Australian New Zealnd Intelligent Information Systems Conference, pp. 357–361.
- R. Ihaka and R. Gentleman, “R: A Language for Data Analysis and Graphics,” J. Comput. Graph. Stat., vol. 5, no. 3, p. 299, Sep. 1996.
- “Vulnerability dataset.” [online] http://seam.cs.umd.edu/webvuldata (Accessed 01 July 2018).
