Evaluation of a damping coefficient influence made by notch filters on efficiency of ECG signals processing

Author: Yeldos A. Altay, Pavel A. Kulagin
Journal: Cardiometry @cardiometry
Article in issue: 19, 2021.
Free access
Introduction. The aim of this study is to evaluate the effect of damping coefficient ξ provided by narrow-band notch filters on the quality indicators of the ECG signal processing accompanied by development of a special software package for experimental testing of the cascade filtering system of natural electrical noise and its harmonics. Materials and Methods. For the formation of additive components of signal and noise, test ECG signals from the Massachusetts Institute of Technology were selected as a model, and electrical noise was synthesized taking into account their harmonic nature. The transfer function of the notch filtering system was tuned and calculated. Quantitative quality metrics was used to determine the processing efficiency at the input and output of the signal filtering system. To assess the effect of damping coefficients made on the ECG signal processing system, the method of the linear regression analysis was applied. Methods of structural and procedural programming were used to create a software package for processing a full-scale noisy signal recording. Results. An increase in the efficiency of the ECG signal processing system was revealed when calculating quantitative indicators characterizing the quality solution to the signal filtering problem. It has been found that at values of the damping coefficient ξ = 0.1, the efficiency of the analysis of ECG signal processing in terms of accuracy and noise resistance increases, and the filtering error decreases due to the improvement of the selectivity of the notch filter at the resonant frequency. The effect of the damping coefficient on the quality indicators of ECG signal processing was established, and regression equations were obtained to characterize the adequacy of the designed model for the confidence interval (P = 0.99) at p <0.01. The performance of the developed software package has been demonstrated, which combines a cascade filtering system with a damping coefficient ξ = 0.1, to eliminate the natural electrical interference of the ECG signal and its harmonics. Conclusion. The evidence data obtained in our work, both calculated (theoretical) and practical (experimental) data, confirm the efficiency of the proposed processing approach to the selection of informative components ECG signal under the influence of high-frequency electrical interference and its harmonics. The sequential incorporation of two narrow-band notch filters with a damping coefficient ξ = 0.1 to suppress interference at a frequency of 50 Hz and its harmonics at a frequency of 100 Hz opens up new possibilities for processing ECG signals.
Analysis of ECG signal processing, Test ECG signals, Notch filter, Damping coefficient, Resonant frequency, Power line interference, Regression analysis, System noise resistance, Measurement accuracy, Filter stability, Statistical data processing
Short address: https://sciup.org/148320547
IDR: 148320547 | DOI: 10.18137/cardiometry.2021.19.2037
Text of the scientific article Evaluation of a damping coefficient influence made by notch filters on efficiency of ECG signals processing
Yeldos A. Altay, Pavel A. Kulagin. Evaluation of a damping coefficient influence made by notch filters on efficiency of ECG signals processing. Cardiometry; Issue 19; August 2021; p. 2037; DOI: 10.18137/cardiometry.2021.19.2037; Available from:
To date, for the analysis of electrocardiographic (ECG) data, PC-assisted systems based on the methods of primary and secondary processing, which are important for making a diagnostic decision on the performance of the human cardiovascular system, are found in a widespread use. The accuracy and reliability of a computerized system, however, are largely influenced by additive interference arising from recording of ECG signals.
During the recording of ECG signals, the influence of low-frequency interference baseline wanders, and the appearance of movement artifacts, as well as high-frequency interference of muscle activity and electrical nature, is inevitable. A detailed analyses of the above interference cases, taking into account their spectral and statistical characteristics, duration, and the peculiarities of the occurrence, are present- ed in [1]. The presence of listed interferences in the recorded signals reduces the accuracy characteristics of the amplitude and time parameters analyzed by ECG signals and the efficiency of the computerized processing systems. To reduce the influence made by the above the sort of interference, an important task is to develop methods and algorithms for processing (filtering) ECG signals to provide resistance to interference. To ensure resistance to interference and, consequently, improve the accuracy of processing ECG signals based on algorithmic filtering tools, there is a need for their separate analysis. In this regard, in this article, an implementation of processing algorithm based on the approach to narrow-band notch filtering of electrical interference is considered.
Electrical interference is a power line interference, which is mainly formed on the signal recording path under the influence of external electrical measuring instruments and which is one of the main factors responsible for a reduction in the accuracy of a processing analysis. This interference has a narrow-band character of a deterministic signal, which slowly changes the harmonics of different phases with a frequency of 50 Hz and its harmonics, and is high-frequency interference. The power line interference is of a capacitive nature, as a result of which a parasitic differentiating circuit is formed, which generates the higher harmonics of this interference [2]. When recording measuring signals, multiple components of this interference are responsible for this effect, but for the ECG signal, the frequencies of 50 Hz and 100 Hz make the greatest contribution thereto [2, 3].
To date, in order to reduce the effect produced by this interference, research is underway to improve the hardware signal recording system, and in particular it is applicable in full to searching for some analog filtering tools based on operational amplifiers [3]. It is known that hardware signal processing based on active filters, due to insufficient efficiency, attenuates interference to the least extent, and, as a consequence, there is a need to use computerized methods and algorithms for the information processing.
Computerized methods for ECG signal processing to eliminate this interference are synthesized on the basis of continuous (analog) and discrete (digital) notch filters, approximated using the Butterworth polynomials, and less often, using the Chebyshev and Bessel polynomials [4-9]. The analysis of works [6, 7] shows that digital filtering copes with the task of filter- ing electrical noise much better than analog filtering. In [5], it has been found that high-order notch filters provide more significant distorting effects during signal processing, compared to low-order filters. At the same time, the distorting effect made by the high-order filters is determined by the filter ringing effect, which represents high-frequency damped oscillations [10, 11] and which affect the accuracy of the obtained ECG signal processing results.
Adaptive notch filtering of electrical noise is carried out by the above-mentioned polynomial filters tuned to the notch frequency of 50 Hz and 100 Hz. As adaptation algorithms, for such notch filters, the least-squares method (LMS) and the recurrent least squares method (RLS) [12] as well as their various modifications [13] are often used. In [13, 14], the quality of ECG signal processing is analyzed using the above adaptation algorithms. According to the results of the processing analysis, it has been found that the use of RLS for the adaptation algorithm significantly improves the quality of data processing. However, in [13,15] it is noted that the implementation of the RLS algorithm for an adaptive filter significantly reduces the rate of adaptive ECG signal processing.
The analysis [16-19] shows that adaptive filters have a significant disadvantage for processing experimental signal records, which is associated with the complexity of recording into the reference channel, which is practically unrealizable when processing field ECG signals. This problem can be viewed from different angles. First, in multichannel and single-channel systems for recording ECG signals, there are no reference channels intended for separate generation of an interference signal [4, 19]. Secondly, the interference arising from recording is additive and correlates with ECG signals [4, 19].
Wavelet filtering of electrical noise for ECG signal processing is presented in [13, 16]. For wavelet filtering, the maternal Haar wavelet functions are used [13]. However, in [20], experimental results shows that due to the ambiguity in the use of maternal wavelet functions, the complexity of their adaptation to local areas of ECG signals, and due to the presence of edge effects [21], the wavelet transform is not always able to provide the required level of the processing efficiency. At the same time, the low efficiency of eliminating interference can lead to insufficient separation of informative components in the ECG signals from the additive mixture of signal and interference.
The use of the empirical mode decomposition method for filtering electrical noise is presented in [2025]. The uniqueness of this method of filtering electrical noise is based on the decomposition of a noisy signal into empirical modes (corresponding to noise) and frequency components of a signal containing local features of an analyzed area with subsequent reconstruction of decomposed components [23,26,27]. To obtain a denoised ECG signal, empirical modes corresponding to interference are excluded during the signal reconstruction [20].
In [20], it is experimentally shown that during the reconstruction of ECG signals, with the exclusion of main empirical modes containing electrical interference components, the quality level of the interference elimination is low. It has been also found that the use of this method leads to noticeable distortions in the amplitude and time parameters of ECG signals. In [28], a scheme for the development of the empirical mode decomposition method for eliminating high-frequency noise is proposed, which consists in truncating the classical algorithm. In [23] it is noted that the method of the empirical mode decomposition when filtering electrical noise leads to stronger distortion of the amplitude of informative ECG signal components, as compared to the Butterworth notch filters.
A review [16] presents a comparative analysis of effectiveness of methods for processing ECG signals when filtering electrical interference. For comparison, a Butterworth notch filter, a wavelet filter, an adaptive notch filter, and an empirical mode decomposition filter were selected. To assess the effectiveness of the listed processing methods, the signal-to-noise ratio indicator was calculated. It is shown that when using a non-adaptive notch filter, the filtered signal has better processing quality indicators than when using the adaptive filter, the wavelet filter, and the EMD filter, which is also confirmed by a number of works [16,21,23]. The low quality of filtration of electrical noise in the method of the empirical modes is explained by the fact that during the decomposition of ECG signals into empirical modes, a mode mixing effect is available, caused by “edge” effects [21] that influence the accuracy of the obtained processing results.
Thus, the above review of the methods for filtering electrical interference shows that to eliminate this interference, the notch filter is optimal for improving the quality indicators of ECG signal processing.
To eliminate electrical noise, oscillatory notch filters with a damping coefficient are also of interest. When using this sort of filters, the algorithmic means of the processing system are represented by transfer functions for separating informative components from the additive mixture of signals and noise. The main difference between an oscillatory notch filter and a polynomial notch filter is the presence of a damping coefficient, on the reliable selection of which the selectivity of the notch filters in suppressing electrical noise and the quality of signal processing depends.
In works [5,6,29], to analyze the processing data obtained at the output of the filtering system, the influence of polynomial methods on the accuracy of measuring ECG signals with suppression of electrical noise is considered again. As a result, it has been found that high-order notch filters introduce high-frequency damped oscillations, and band-pass filters and low-pass filters used to attenuate this interference change the morphology of the QRS complexes. However, there are significantly fewer publications that present those effects in the system which make narrow-band notch filters of the oscillatory type with a damping coefficient and their quantitative assessment of the impact on the quality of ECG signal processing.
To date, for experimental testing of algorithms for primary and secondary processing of the ECG data, computerized systems based on graphical user interfaces are being created [30,31]. Such interfaces offer currently an advanced, modern, and easy-to-develop and -operate solution, which provides all the necessary possibilities for analyzing the received processing of the ECG data [30, 31] and involves creating a special program for experimental testing of the processing system.
This article deals with an assessment of the influence of the damping coefficient on the efficiency of the ECG signal processing, as well as with a computerized system for experimental testing of the filtering system of natural electrical interference and its harmonics.
Aim
The purpose of this study is to assess the influence made by damping coefficient ξ of narrow-band notch filters on the quality indicators of the ECG signal processing and develop a special software package for experimental testing of a cascade filtering system of full-scale electrical noise and its harmonics.
Theory
One of the main tasks of the computerized ECG signal processing against the background influence of electrical interference is the selection of informative signal components, mainly the P, QRS, T waves, which, in the future, can be used to calculate secondary diagnostic indicators of the human cardiovascular system performance. The influence of a narrow-band electrical interference or insufficient suppression of components of this interference leads to the distorting peaks of the QRS complexes and the distortion of the P, T of the ECG signal waves, and, as a result, to the loss of the accuracy characteristics in the processed signal and the processing system as a whole.
Narrow-band noise with harmonics at 50 Hz and 100 Hz is suppressed by a cascade filter system. The cascade filter system represents a series connection (incorporation) of two notch filters with a damping coefficient, which improves the ECG signal processing at the output of each filter sequence. The notch filters, in comparison with the reject filters, are not characterized by the presence of lower and upper bands suppression of electrical noise, which determines the notch width. In this case, the necessary condition for eliminating such interference based on the application of the notch filters is the symmetry of its frequency characteristics relative to resonant frequencies in order to improve the interference suppression, as well as the stability system when two filters are connected in series for their practical application cases.
The values of the damping coefficient of the notch filters to improve the efficiency processing are in the range from 0.1 to 1 [32], since the effects occurring in the system at values of coefficient ξ <0.1 or ξ <1 can be characteristic of aperiodic and conservative members. Therefore, the selection of a value of the damping coefficient of the filters is justified precisely in the range from 0.1 to 1 with a step of 0.1. At the same time, the main requirement for a cascade filter system is the possibility of an efficient operation of the signal processing system under the influence of interference and variability of the shapes of the analyzed ECG signals.
Materials and methods
To achieve this aim, our study has been carried out to cover 4 stages, a detailed description of which is presented below herein.
Stage 1. Synthesis and tuning of notch filters parameters with damping coefficient to design a cascade filtering system. At this stage, to obtain and analyze the characteristics of the filtering members in the processing system and the transfer functions of the filters are presented. A mathematical description of characteristics of the oscillatory-type filters to design a cascade processing system is possible using a com- plex transfer function, which is written in the form (1)
below [33]
W ( s ) =
2 2
s + ОД
s +2^©c + toc
where s is a complex variable, ωс is a filter cutoff frequency, ξ is a filter damping coefficient. To obtain a cascade system, the cutoff frequencies of the filters in the normalized range are calculated in the following form [34]:
to e
С - У2л ’
V h )
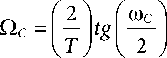
where ωс is a continuous filter cutoff frequency, Ωс is a discrete filter cutoff frequency and Т is a sampling interval. The cascade filtration system has been designed by sequentially incorporation of each sequence of the filters of the form (3)
W i ( s ) -
W 2 ( s ) =
2 . 2
s I© 1
s 2 + 2 ^© 1 + © 2
s I © 2
s 2 + 2 ^©2 + © 2
where ω1,2 are the notch filter cutoff frequencies. The calculation of the general transfer function of the cascade system of the notch filters has been carried out by the product of the transfer functions of the form (3). The general transfer function of the calculated cascade filter system can be written in the form (4).
W ( ) = ( s 2 + m 2 )( s 2 + m 2 ) ^
„^„de ( s 2 + 2 ^Ю 1 +ю 2 )( s 2 + 2 ^Ю 2 + ю 2 )
s 4 + ( m 2 1^ 2 ) s2 I^^o 2
s 4 + (2 ^to i + 2 ^« 2 ) s 3 + ( m 2 + 4 ^ 2 to i to a + m 2 ) s 2 + (2 4m 2 m 2 + 2 ^m i m 2 ) s + m 2 m 2
Transfer functions W(s) of the filtering members of the filters for the design of a digital cascade processing system W(z) are calculated by bilinear transformation with the Matlab software using function the bilinear ()
(developed by Math Works). The symmetry of the frequency response by the filters relative to the resonant frequencies and the stability of the filtering system with damping coefficients are investigated on the basis of the amplitude-frequency response and pole-zeros plot.
Stage 2. Quantification of the effect made by filter damping coefficients on the parameters in the ECG signal processing system . At this stage, quantitative indicators characterizing the quality of signal processing are analyzed to assess the influence produced by damping coefficient ξ (obtained at the output of the processing system, according to the result of stage 1). Our analysis of the ECG signal processing to assess the effect produced by ξ of the filters was carried out using additive a priori test models of signals and electrical noise, in the form (5)
x ( q ) = s ( q ) + n ( q ) (5) where q refers to the ECG signal measurement samples, x ( q ) is the noisy ESF signal, s ( q ) is a test ECG signal, and n(q) is interference.
In this study, to assess the influence of ξ on signal processing, we have selected 3 types of test signal models from the database of Massachusetts Institute of Technology (MIT). The received signal records differed between themselves in morphology and location of the P, QRS, T waves and consisted of more than 60 cardiac cycles with n = 10000 measurements and a sampling rate of 250 Hz [35].
The high-frequency power line electrical interference n(q) models are based on normally distributed harmonic interference limited to a specific frequency signal band. The noise models were synthesized using the Matlab software product. To assess the quality of processing, the test signals were subjected to noise by power line noise interference (PLI) model, taking into account the harmonic nature (6) for 50 Hz, 100 Hz, and the additive multiharmonic nature of this noise (7).
f- nPL Aq) = A sin(2n — k + ф) (6) fd where А is noise amplitude, fξ is an interference frequency, fd is a PLI sampling rate, k is the order number of interference signal samples, and φ is the initial phase.
mf nPLi(q) = E Aism(2n E k + Фi) (7) i=1 fd where m is the number of PLI harmonics, Аi is amplitude of the i-th PLI harmonic, fi is an interference frequency, fd is a PLI sampling rate, k is the order num-
24 | Cardiometry | Issue 19. August 2021
ber of interference signal samples, and φ i is the initial phase of the i -th PLI harmonic.
The ECG signal filtering system efficiency is assessed by qualitative and quantitative indicators. Our analysis of the processing quality has been carried out visually [21]. The analysis of the quantitative results of processing is assessed by several criteria. The following indicators have been selected as these criteria: the signal-to-noise ratio (SNR) before (8) and after (9) processing, as well as the improved signal-to-noise ratio (10) [21]; mean square error (MSE) before processing (11) between the noisy and test signal and after processing (12) between the reference and the filtered signal [10, 21]; the correlation coefficient between the reference filtered and the test signal (13) by the Pearson method [36], as well as the root-mean-square (RMS) error of the processing system (14) [37].
|
_N. Z s ( q ) |
||
|
SNR before = 10lg |
q = 1 N Z ( x ( q ) - s ( q )) _ q = 1 |
, (8) |
|
N Z S ( q ) 2 |
||
|
SNR after = 10lg |
q =i _______________ N Z ( S ( q ) - s ( q )) 2 _ q = 1 |
, (9) |
|
MSE before = |
-1 Z ( s ( q ) - x ( q ))2, N q = 1 |
(11) |
|
MSE after = |
-1 Z ( s ( q ) - ^( q ))2, N q = 1 |
(12) |
|
N E ( S ( q ) |
- S ( q ) • ( s i ( q ) - s ( q ) |
|
|
q = 1 |
, (13) |
|
|
N |
N |
|
|
A E( s i ( q ) - |
S ( q )) 2 " E ( s i ( q ) - s ( q )) 2 |
|
|
V q = 1 |
q = 1 |
N
RMS = < vE( s i - S i )2 (14)
V N q =1
where N is the number of the measurement samples, s(q) indicates the signal filtered samples, s, refers to the actual samples of the filtered signal, sˆ refers to the filtered signal samples mean value, si indicates the actual test signal samples, and s refers to test signal samples mean value.
At the same time, the selected indicators (8) - (14) for assessing the influence of the damping coefficient on the processing quality is justified by the fact that it allows one to evaluate the efficiency of ECG signal processing in terms of accuracy and noise resistance, as well as the similarity of the shape of the test signals to the filtered signals. At present, they are the indicators that are generally accepted for the analysis and assessment of the efficiency of ECG signal processing when testing the filtering system for its proper quality. The graphical presentation of the calculated indicators depending on the damping coefficients, namely in the form of a bar graph with measurement error bars, has been carried out using the Plotly graphical module in the Python program [38].
Stage 3. Statistical processing of the influence made by a filter damping coefficient on the ECG signal processing system parameters . At this stage, the statistical assessment of the influence made by the damping coefficient of the notch filters on the quantitative indicators characterizing the quality of the ECG signal processing (according to the results of stage 2) is considered. The stage represents a regression analysis of the quality indicators of the ECG signal processing depending on the coefficient ξ of the notch filters. The results of assessing the influence produced by coefficient ξ on the processing system obtained by the regression analysis are presented using the correlation coefficients, determination coefficients, p -values, and regression equations characterizing the dependence between the estimated variables. When processing the obtained data by the regression analysis, the differences are considered significant at a significance level of p < 0.05, taking into account the fact that in engineering and biomedical research this level is the most common and accepted as a threshold value [39.40]. At this stage of the study, the statistical processing of the results has been carried out using the STATISTICA 10.0 software package developed by Dell, StatSoft [41].
Stage 4. Experimental testing of the ECG signal processing cascade system. At this stage, we consider the development of a special software interface for experimental testing of the proposed processing algorithm based on the approach to the cascade filtering of power line interference noise and its harmonics (based on the results of stages 1-3). In the developed software package, the possibilities are treated to assess the frequency composition of a noisy and a processed field recording of an ECG signal, as well as to analyze quantitative indicators characterizing the quality of signal processing. The es- timation of the noisy signal frequency composition for visual analysis of the spectrum before and after filtering has been carried out using the discrete Fourier transform, which for a discrete signal with a certain number of samples can be represented as [42]
N - 1
X (k ) = £ x ( q )e 'N ) qk n = 0
where x(q) refers to the discrete signal measurement samples, N is the number of samples, k = 0,1, … , N -1 is frequency components number. Similarly to stage 2, at this stage, our analysis of the obtained processing of natural records of ECG signals has been carried out visually, and for the quantitative assessment, the indices of the standard deviation of the mean values
(SDMV,σ) [37] of the signal samples before and after processing (15) and (16) have been calculated:
Ф before

N
I (X (q) Цbefore ) , q=1
1 N

N q = 1

N
^ (5 (q) Ц after ) , q=1
1 N
Ц after E 5 ( q )
N q = 1
where μ is the mean value of samples before and after filtering of interference.
Evaluation of the filtering error of the full-scale ECG signal recordings at the output cascade in the filtering system is determined based on the values of experimental SDMV in accordance with the confidence intervals. For a confidence estimate of the filtering error, a confidence interval P = 0.95 is selected at a significance level of α = 0.05, respectively.
At this stage, the material of research for experimental testing processing system has covered the real noisy samples of single-lead channel recordings of the ECG signals obtained using the multifunctional measuring system of bio-signals “Mitsar-EEG 202”, produced by MITSAR-DIAGNOSTICS-SOLUTIONS. The uniqueness of this instrumentation system implies that during the signal recording, electric power is supplied via an USB port of a computer, and it is portable. For the experimental testing processing system, taking into account all the recommendations for recording ECG signal on the channel sensitivity [43, 44], digitizing [35] and disposable measuring electrodes [45], when all available filtering software algorithms are turned off, a noisy signal is recorded for importing into the software interface and assessing the quality processing.
At the same time, the signal has been recorded in a human individual aged twenty-nine in the absence of any physical loading and orthostatic tests in an upright position. To increase the reliability of the obtained samples and prevent the erroneous recording signal parameters, due to the high electrical resistance of the contact conductive substances in the measuring electrodes, a silver chloride electrode with a solid contact material has been used, intended for long-term monitoring [45].
Results
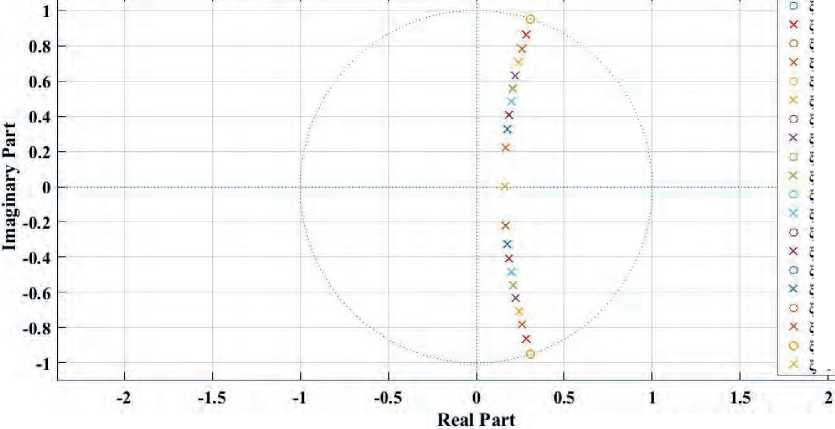
Using expression (2) for a system of form (3), the notch filters with damping coefficient ξ from 0.1 to 1 are tuned and a bilinear transformation is obtained using the Matlab program to form a digital system. To analyze the characteristics of the digital filters, the results of the frequency response and stability of the filters have been obtained based on the pole-zero plots, which are presented in Figures 1 and 2 herein.
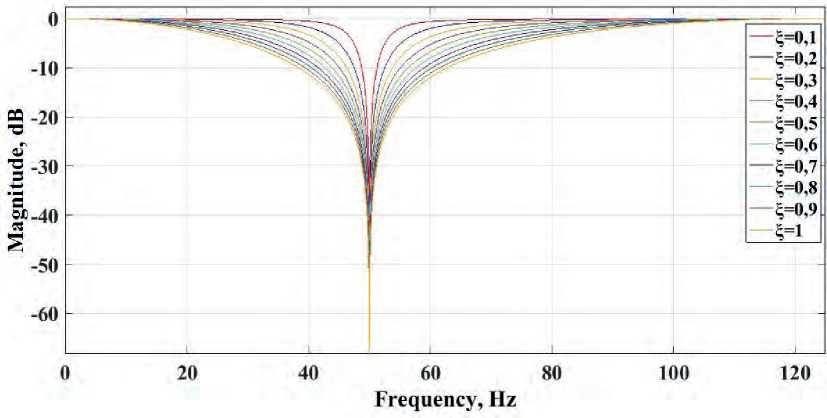
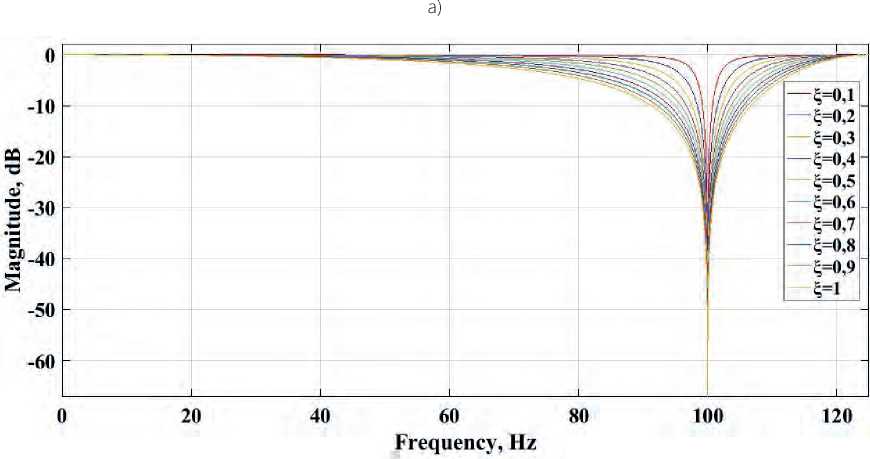
The obtained results of the frequency response produced by the filters depending on the tuned cutoff frequency interference of 50 Hz, 100 Hz, the sampling frequency of 250 Hz, and damping coefficient ξ from 0.1 to 1 show that the symmetry of the narrow-band notch filters is maintained relative to the resonance frequency. However, due to the increase in the damping coefficient system, the shape of the frequency response made by the filters becomes flatter for frequencies of 50 Hz (Figure 1a) and 100 Hz (Figure 1b herein). Our analysis of the pole-zero plots demonstrates that all tuned notch filters of the oscillatory
b)
Figure 1. Frequency response by the notch filtering system with coefficient ξ: a) a notch filter tuned to a cutoff frequency of 50 Hz; b) a notch filter tuned to a cutoff frequency of 100 Hz.
Real Part
a)
|
о £=0.1: Zero x £=0.1: Pole 6- £=0.2: Zero |
|
|
X |
£-0.2: Pole |
|
£-0.3: Zero |
|
|
£=0.3: Pole |
|
|
о |
£=0.4: Zero |
|
X |
£=0.4: Pole |
|
о |
£=0.5: Zero |
|
X |
£=0.5: Pole |
|
£=0.6: Zero |
|
|
£=0.6: Pole |
|
|
о |
£=0.7: Zero |
|
X |
£=0.7: Pole |
|
о |
£=0.8: Zero |
|
X |
£=0.8: Pole |
|
о |
£=0.9: Zero |
|
X |
£=0.9: Pole |
|
о |
£,=1: Zero |
|
X |
£=1: Pole |
£=0.1: Zero £=0.1: Pole £=0.2: Zero £-0.2: Pole
£=0.3: Zero
£=0.3: Pole
£=0.4: Zero
£=0.4: Pole
£=0.5: Zero
£=0.5: Pole
£=0.6: Zero
£=0.6: Pole
£=0.7: Zero
£=0.7: Pole
£=0.8: Zero
£=0.8: Pole
£=0.9: Zero £=0.9: Pole £—1: Zero
£=1 : Pole
b)
Figure 2. Notch filtering system pole-zero plots with coefficient ξ: a) a notch filter tuned to a cutoff frequency of 50 Hz; b) a notch
filter tuned to a cutoff frequency of 100 Hz.
type at reso nance frequencies of 50 Hz and 100 Hz, with damping coefficient values from 0.1 to 1, are stable, that is, the roots of the system transfer function are located inside a circle of a unit radius on complex plane z. Using the method of computer modeling, numerical indicators of the influence made by damping coefficient ξ on the ECG signal processing have been obtained for three test signals, a detailed assessment of which is presented in Tables 1 and 2 herein.
Our analysis of the obtained results shows that at some values of the damping coefficient, namely ξ = 0.1, the ECG signal processing system efficiency in terms of accuracy (MSE), noise resistance (SNR), and the correlation coefficient (R) value between the test and filtered signals increases due to improved selectivity of the notch filters. The obtained values of the correlation analysis allow us stating that there is a high positive correlation relationship available. The high correlation relationship is due to minimal distortions of the informative components of the ECG signal, which determines the similarity of the filtered signals to the test signals. In addition to improving of the listed indicators, the least value of the root mean square error (RMS) of the signal difference between the test and filtered signals are also observed that characterizes a decrease in the error results upon ECG signal processing under the influence of interference.
Table 1
The influences of ξ on filtering of interference with a frequency of 50 Hz
|
Indicator |
Damping coefficient, ξ |
|||||||||
|
0,1 |
0,2 |
0,3 |
0,4 |
0,5 |
0,6 |
0,7 |
0,8 |
0,9 |
1 |
|
|
Test ECG signal 1 |
||||||||||
|
SNR before , dB |
0,5467 |
|||||||||
|
SNR after , dB |
23,7759 |
21,0376 |
18,340 |
15,9134 |
14,1885 |
12,8029 |
11,6580 |
10,6903 |
9,8578 |
9,1309 |
|
SNR improve , dB |
23,2292 |
20,4908 |
17,5872 |
15,3666 |
13,6417 |
12,2562 |
11,1112 |
10,1436 |
9,3110 |
8,5841 |
|
MSE before , mV |
0,5000 |
|||||||||
|
MSE after , mV |
0,0002 |
0,0005 |
0,0010 |
0,0017 |
0,0025 |
0,0033 |
0,0040 |
0,0053 |
0,0063 |
0,0073 |
|
R , r.u |
0,9979 |
0,9961 |
0,9924 |
0,9874 |
0,9814 |
0,9747 |
0,9675 |
0,9599 |
0,9520 |
0,9440 |
|
RMS , mV |
0,0168 |
0,0229 |
0,0319 |
0,0410 |
0,0497 |
0,0578 |
0,0655 |
0,0726 |
0,0793 |
0,0855 |
|
Test ECG signal 2 |
||||||||||
|
SNR before , dB |
1,4124 |
|||||||||
|
SNR after , dB |
27,0497 |
23,3222 |
20,1918 |
17,8798 |
16,0955 |
14,6622 |
13,4759 |
12,4712 |
11,6051 |
10,8476 |
|
SNR improve , dB |
25,6372 |
21,9097 |
18,7793 |
16,4673 |
14,6830 |
13,2498 |
12,0635 |
11,0588 |
10,1927 |
9,4352 |
|
MSE before , mV |
0,2156 |
|||||||||
|
MSE after , mV |
0,0003 |
0,0008 |
0,0018 |
0,0031 |
0,0046 |
0,0064 |
0,0083 |
0,0103 |
0,0124 |
0,0146 |
|
R , r.u |
0,9990 |
0,9977 |
0,9952 |
0,9919 |
0,9879 |
0,9833 |
0,9783 |
0,9728 |
0,9671 |
0,9612 |
|
RMS , mV |
0,0195 |
0,0298 |
0,0427 |
0,0555 |
0,0679 |
0,0797 |
0,0909 |
0,1015 |
0,1115 |
0,1209 |
|
Test ECG signal 3 |
||||||||||
|
SNR before , dB |
0,3256 |
|||||||||
|
SNR after , dB |
21,5473 |
19,2124 |
16,4093 |
14,1985 |
12,4572 |
11,0460 |
9,8716 |
8,8731 |
8,0092 |
7,2509 |
|
SNR improve , dB |
21,2217 |
18,8868 |
16,0837 |
13,8729 |
12,1316 |
10,7204 |
9,5460 |
8,5475 |
7,6836 |
6,9253 |
|
MSE before , mV |
0,7273 |
|||||||||
|
MSE after , mV |
0,0002 |
0,0004 |
0,0008 |
0,0014 |
0,0021 |
0,0028 |
0,0036 |
0,0045 |
0,0053 |
0,0062 |
|
R , r.u |
0,9965 |
0,9940 |
0,9887 |
0,9815 |
0,9727 |
0,9628 |
0,9521 |
0,9408 |
0,9291 |
0,9173 |
|
RMS , mV |
0,0165 |
0,0215 |
0,0295 |
0,0378 |
0,0458 |
0,0533 |
0,0603 |
0,0669 |
0,0730 |
0,0786 |
Table 2
The influences of ξ on filtering of interference with a frequency of 100 Hz
|
Indicator |
Damping coefficient, ξ |
|||||||||
|
0,1 |
0,2 1 |
0,3 |
0,4 |
0,5 |
0,6 |
0,7 |
0,8 |
0,9 |
1 |
|
|
Test ECG signal 1 |
||||||||||
|
SNR before , dB |
0,5468 |
|||||||||
|
SNR after , dB |
26,8868 |
26,5439 |
26,2384 |
25,7330 |
24,7609 |
23,7729 |
23,7125 |
22,8276 |
21,9445 |
21,1265 |
|
SNR improve , dB |
26,3400 |
25,9970 |
25,6916 |
25,1861 |
24,2140 |
23,2261 |
23,1657 |
22,2808 |
21,3977 |
20,5796 |
|
MSE before , mV |
0,4896 |
|||||||||
|
MSE after , mV |
0,00013 |
0,00014 |
0,00015 |
0,00017 |
0,00022 |
0,00028 |
0,0002 |
0,00034 |
0,00042 |
0,00051 |
|
R , r.u |
0,9990 |
0,9989 |
0,9988 |
0,9987 |
0,9983 |
0,9980 |
0,9979 |
0,9976 |
0,9974 |
0,9962 |
|
RMS , mV |
0,0112 |
0,0117 |
0,0126 |
0,0134 |
0,0150 |
0,0168 |
0,0169 |
0,0187 |
0,0206 |
0,0227 |
|
Test ECG signal 2 |
||||||||||
|
SNR before , dB |
1 |
,4126 |
||||||||
|
SNR after , dB |
30,2922 |
30,2833 |
29,3556 |
28,1750 |
28,1531 |
26,9427 |
25,8106 |
24,7756 |
23,8342 |
22,9766 |
|
SNR improve , dB |
28,8796 |
28,8707 |
27,9431 |
26,7624 |
26,7405 |
25,5301 |
24,3981 |
23,3631 |
22,4216 |
21,5640 |
|
MSE before , mV |
0,2151 |
|||||||||
|
MSE after , mV |
0,00017 |
0,00018 |
0,00022 |
0,00025 |
0,00029 |
0,00038 |
0,00050 |
0,00063 |
0,00079 |
0,00096 |
|
R , r.u |
0,9997 |
0,9995 |
0,9994 |
0,9993 |
0,9991 |
0,9990 |
0,9987 |
0,9983 |
0,9979 |
0,9975 |
|
RMS , mV |
0,0122 |
0,0134 |
0,0149 |
0,0168 |
0,0171 |
0,0197 |
0,0224 |
0,0253 |
0,0281 |
0,0310 |
|
Test ECG signal 3 |
||||||||||
|
SNR before , dB |
0,3257 |
|||||||||
|
SNR after , dB |
24,6734 |
24,4861 |
23,8980 |
23,8044 |
22,9224 |
21,9935 |
21,3356 |
21,0863 |
20,2227 |
19,4255 |
|
SNR improve , dB |
24,3477 |
24,1604 |
23,5723 |
23,4787 |
22,5967 |
21,6677 |
21,0099 |
20,7606 |
19,9020 |
19,0998 |
|
MSE before , mV |
0,5369 |
|||||||||
|
MSE after , mV |
0,00013 |
0,00014 |
0,00015 |
0,00016 |
0,00019 |
0,00024 |
0,00028 |
0,00030 |
0,00036 |
0,00044 |
|
R , r.u |
0,9986 |
0,9982 |
0,9980 |
0,9979 |
0,9975 |
0,9968 |
0,9963 |
0,9961 |
0,9953 |
0,9943 |
|
RMS , mV |
0,0115 |
0,0118 |
0,0126 |
0,0127 |
0,0141 |
0,0157 |
0,0170 |
0,0174 |
0,0191 |
0,0210 |
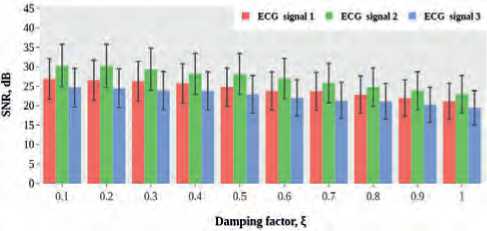
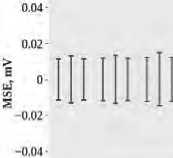
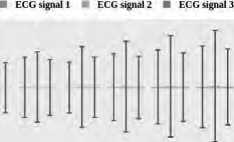
A bar graph of the quantitative results for all analyzed ECG signals in terms of the resistance to interference and the processing accuracy is depicted in Figure 3 herein for the 50 Hz interference and in Figure 4 for the 100 Hz interference, respectively.
The results presented in the bar graph (Figures 3a and 4a) herein and high values of the signal-to-noise ratio (SNR) indicator is evidence for the stability of the analyzed test signals to high-frequency electrical interference in comparison with the notch filters tuned to the damping coefficient values ξ > 0.1. Moreover, the low values of mean square measurement error (MSE) characterize the accuracy of measuring of amplitude and time parameters of the test ECG signals. Due to the increase in the values of the damping coefficient of the system, the errors caused by errors in measuring of the parameters test ECG signals also increase. The greater the value of this error, the wider the border confidence interval bars in the diagram characterizing these errors (Figures 3b and 4b herein). The results of evaluating of the regression analysis of the influence made by coefficient ξ on the quality indicators of the ECG signal processing when filtering electrical interference and its harmonics at frequencies of 50 Hz and 100 Hz are given in Tables 3 and 4 herein.
The performed regression analysis (for frequency of 50 Hz and 100 Hz) confirm a high relationship of coefficient ξ with the SNRa, MSEa, R, RMS r > 0.9 on the Chaddock scale that makes possible to establish the influence made by the damping coefficient on the ECG signal processing. It should be noted that due to the increase in the damping coefficient ξ of the notch filters, the values of the SNRa and R indices decrease, and it is the evidence, which demonstrates the negative correlation between the variables. However the negative value of this coefficient does not allow stating the fact that there is no damping effect on the ECG signal processing system and characterizes only the tendency of the relationship between the analyzed variables. The obtained coefficients are with the p value less than for p = 0.01 and considered statistically significant for the 0.99 confidence interval, that is, the associated variables are effective predictors of the influence damping coefficient ξ on the ECG signal processing system. The closer the value coefficient of determination R2 to 1, the stronger the relationship between the variables, and, as a consequence, the analyzed dependence is exactly described with the considered regression model.
Thus, following the data analysis results as obtained above, in order to increase the efficiency of the ECG signal processing, it is advisable to select the value of damping coefficient ξ = 0.1. The selection of this coefficient value is justified by the fact that it makes possible to increase the efficiency of the ECG signals processing in terms of accuracy (MSE), in terms of
• ECG signal 1 ■ ECG signal 2 ■ ECG signal 3
a)
АЙМ^Ш
0.1 02 02 04 0.5 0.6 0.7 0.8 OS I
Damping factor, (
a)
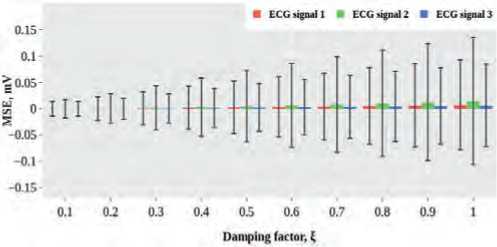
Figure 3. Bar diagram illustrating results of ECG signal processing for the 50 Hz interference: a) signal-to-noise ratio; b) MSE measurement error.
0.1 0.2 0.3 0.4 0.5 0.6 0.7 0.8 0.9 1
Damping factor, ( b)
Figure 4. Bar diagram illustrating results of ECG signal processing for the 100 Hz interference: a) signal-to-noise ratio; b) MSE
measurement error.
Table 3
Evaluation results of regression when filtering interference with a frequency of 50 Hz
|
Variables |
Regression analysis indicators |
|||
|
Correlation coefficient, r |
Determination coefficient, R 2 |
p- value |
Regression equation, Y |
|
|
ECG signal 1 |
||||
|
ξ:SNR after |
-0,9714 |
0,9436 |
0,000003 |
-15,8401x+23,4318 |
|
ξ:MSE after |
0,9893 |
0,9787 |
0,00000006 |
0,0081x-0,0012 |
|
ξ:R |
-0,9890 |
0,9781 |
0,00000006 |
-0,062x+1,0094 |
|
ξ:RMS |
0,9984 |
0,9969 |
0,00000001 |
0,0787x+0,0090 |
|
ECG signal 2 |
||||
|
ξ:SNR a |
-0,9642 |
0,9297 |
0,000007 |
-17,0356x+26,1297 |
|
ξ:MSE a |
0,9885 |
0,9772 |
0,00000007 |
0,0164x-0,0027 |
|
ξ:R |
-0,9869 |
0,9739 |
0,0000001 |
-0,0431x+1,0072 |
|
ξ:RMS |
0,9989 |
0,9978 |
0,00000001 |
0,1149x+0,0088 |
|
ECG signal 3 |
||||
|
ξ:SNR a |
-0,9764 |
0,9534 |
0,000001 |
-15,7068x+21,5263 |
|
ξ:MSE a |
0,9899 |
0,9799 |
0,00000005 |
0,0069x-0,0011 |
|
ξ:R |
-0,9882 |
0,9765 |
0,00000008 |
-0,0912x+1,0137 |
|
ξ:RMS |
0,9984 |
0,9969 |
0,00000001 |
0,0716x+0,0089 |
Table 4
Evaluation of results of regression when filtering interference with a frequency of 100 Hz
|
Variables |
Regression analysis indicators |
|||
|
Correlation coefficient, r |
Determination coefficient, R 2 |
p- value |
Regression equation, Y |
|
|
ECG signal 1 |
||||
|
ξ:SNR after |
-0,9904 |
0,9808 |
0,00000004 |
-6,5541х+27,9594 |
|
ξ:MSE after |
0,9166 |
0,8402 |
0,0002 |
0,0004х+0,00004 |
|
ξ:R |
-0,9417 |
0,8868 |
0,00005 |
-0,0027х+0,9996 |
|
ξ:RMS |
0,9860 |
0,9723 |
0,0000002 |
0,0126х+0,009 |
|
ECG signal 2 |
||||
|
ξ:SNR after |
-0,9907 |
0,9815 |
0,00000003 |
-8,6174х+31,7995 |
|
ξ:MSE after |
0,9501 |
0,9027 |
0,00003 |
0,0009х-0,00003 |
|
ξ:R |
-0,9664 |
0,9340 |
0,000005 |
-0,0023х+1,0001 |
|
ξ:RMS |
0,9837 |
0,9676 |
0,0000003 |
0,0208х+0,0086 |
|
ECG signal 3 |
||||
|
ξ:SNR after |
-0,9895 |
0,9792 |
0,00000005 |
-6,084х+25,7004 |
|
ξ:MSE after |
0,9620 |
0,9255 |
0,000009 |
0,0003х+0,00005 |
|
ξ:R |
-0,9743 |
0,9493 |
0,000002 |
-0,0045х+0,9994 |
|
ξ:RMS |
0,9809 |
0,9621 |
0,0000006 |
0,0106х+0,0095 |
noise resistance (SNR) under the influence made by power line interference with a frequency of 50 Hz and its harmonics at a frequency of 100 Hz.
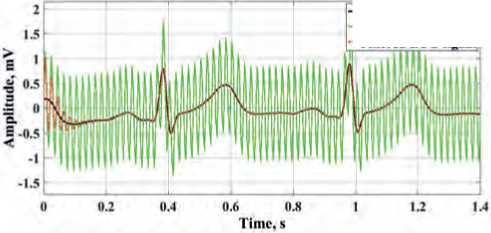
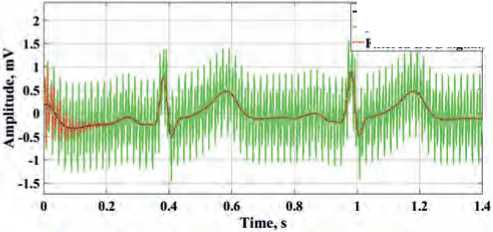
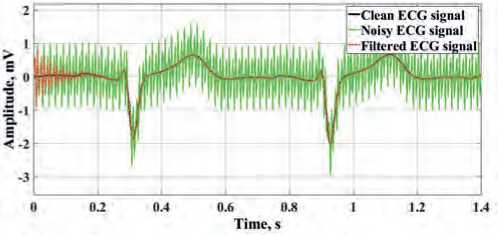
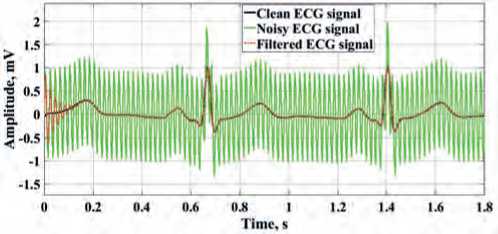
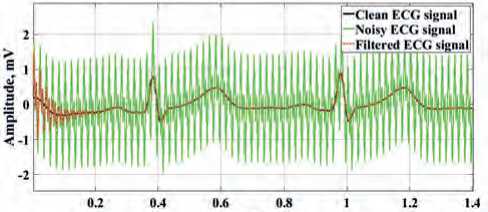
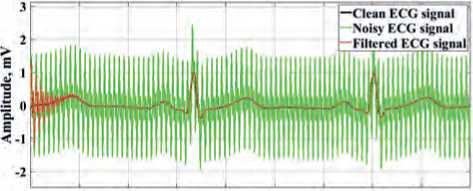
Figures 5 and 6 herein, using computer simulation for three test ECG signals, illustrate the results of notch filtering of electrical interference at cutoff frequencies of 50 Hz and 100 Hz.
30 | Cardiometry | Issue 19. August 2021
In Figures 5 and 6, the presented results of ECG signals processing allow concluding that the notch filters of the oscillatory type with a damping coefficient ξ = 0.1, tuned to a noise cutoff frequency of 50 Hz and 100 Hz, can effectively filter out synthesized electrical noise. Note that due to the presence of a transient process in the filters of this type, the beginning portion
—Clean ECG signal Noisy ECG signal
■ Filtered ECG signal
—Clean ECG signal Noisy ECG signal Filtered ECG signal
a)
a)
b)
b)
c) c)
-
Figure 5. Results of filtering of narrow-band electrical interference of ECG signals with a frequency of 50 Hz: a) for ECG signal 1; b) for ECG signal 2; c) for ECG signal 3.
of the 1st cardiac cycle of the ECG signals is distorted during processing.
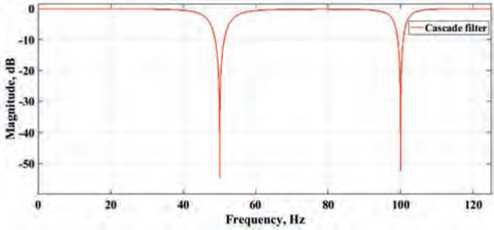
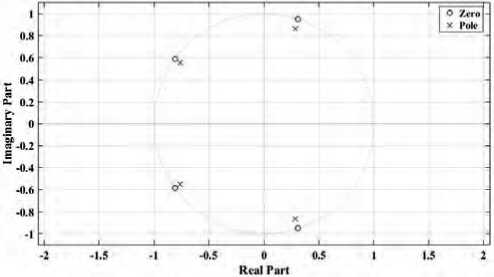
Thus, based on the results presented above, we will design a cascade filtering system to suppress electrical noise and its harmonics. Similar to the above analysis of two digital notch filters, we will demonstrate the frequency response and the pole-zero plots of the cascade system for ξ = 0.1 of the form (4), which is shown in Figure 7 herein.
Analyzing the characteristics of the cascade notch filtering system given in Figure 7 herein, it can be noted that with respect to the resonant frequencies of 50 Hz and 100 Hz, the symmetry of two series-connected narrow-band notch filters for ξ = 0.1 is maintained. The filtering system pole-zero plots are located inside a circle of a unit radius on the complex z plane, that is, the system is stable.
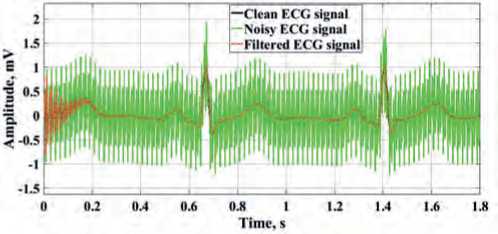
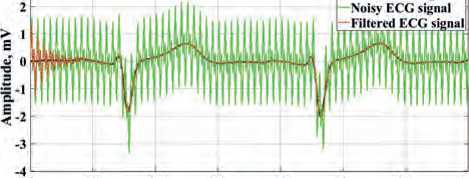
By synthesizing a model of interference of the form (7) for system (4), the test ECG signals have been sub-
-
Figure 6. Results of filtering of narrow-band electrical interference of ECG signals with a frequency of 100 Hz: a) for ECG signal 1; b) for ECG signal 2; c) for ECG signal 3.
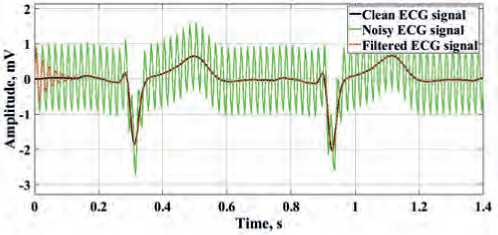
jected to noise and processing, the results of which are indicated in Figure 8 herein.
Our analysis of the results obtained at the output of the cascade system for ECG signal processing demonstrates that the series-connected narrow-band notch filters of the oscillatory type for the selected ξ = 0.1 make possible to effectively filter out the high-frequency components of the electrical interference and properly extract the informative signal components. As for the previous results, it can be seen from Figure 8 herein that, due to the presence of a transient process in the filters of this type, beginning portion 1 of the cardiac cycle is distorted during processing. In order to exclude the influence made by internal transient processes of the filter, in practice, in the secondary ECG data processing, the results of filtering of the first sections in a cardiac cycle can be discarded. The rejection of the first sections 1 in the cardiac cycle in com
a)
Time, i
a)
b)
Figure 7. Cascade notch filtering system characteristics: a) frequency response; b) pole-zero plots
—Clean ECG signal
0 0.2 0.4 0.6 0.8 1 12 Ы
Time, s
b)
0 0.2 0.4 0.6 0.8 1 12 1.4 1.6 1.8
Time, s
c)
Figure 8. Results of the cascade filtering system for the additive mixture of ECG signals and frequencies of 50 Hz and 100 Hz: a) for ECG signal 1; b) for ECG signal 2; c) for ECG signal 3.
parison with the results [46] is the least. Note that in [46], due to highly distorted sections in the processed recording, a one-minute record containing more than 40 cardiac cycles is rejected.
Thus, for a quantitative assessment of the ECG signal processing efficiency in case of cascade filtering, the indices for three test signals, characterizing the processing quality, have been calculated as presented in Table 5 herein.
Thus, systematizing the results obtained, it can be established that the developed approach to cascade filtering attenuate the effect of narrow-band electrical interference and its harmonics, confirms the similarity of the filtered test shapes of ECG signals to those of the test shape (R) that improves the processing accuracy with low distortions of amplitude and time parameters (MSE). At the same time, the high value SNR indicators at the output of the filters is due to an increase in the noise resistance of the signal processing 32 | Cardiometry | Issue 19. August 2021
Table 5
Evaluation of ECG signals processing results
The scientific novelty of our research implies that at values of the damping coefficient ξ = 0.1 of the narrow-band notch filters, an improvement in the selectivity of the system with respect to high-frequency interference has been revealed, and an increase in the efficiency for ECG signal processing system has been established. Previously, the regression analysis to assess the impact made by this coefficient and the selected value thereof on the efficiency ECG signal processing system has never been applied.
A high correlation has been revealed between the damping coefficient and the quality indicators of ECG signal processing. The relationship between the quality indicators of ECG signal processing and the filter parameters has been previously noted in [10,11] for a low-pass filter. It has been demonstrated that the accuracy of measuring the parameters ECG signal is associated with the cutoff frequencies of the filter, when the electrical noise is attenuated. In this research work, we have found that this correlation is also present for the notch filters with a damping coefficient of the system. This indicates the prospects for further use of the developed processing approach in recording devices and software systems designed for ECG signals processing.
Thus, to assess the performance of the cascade system for processing natural records of ECG signals and confirm the practical significance of the proposed filtering approach, a special algorithmic support has been developed designed to extract informative signal components.
The developed software interface allows loading a noisy ECG signal recording in the “Load” menu and then experimentally evaluating in the “Noisy ECG signal” menu the frequency composition of the loaded recording using a discrete Fourier transform at a sampling rate of 250 Hz. In the “ECG signal processing” menu, notch filtering with a damping coefficient ξ = 0.1 is carried out. To process the recording, it is possible to select the order of the filtering system, namely n = 2 n = 4. In the “Quantitative results” menu, an interval assessment of the measurement accuracy of the amplitude-time parameters of the ECG signal during filtering is carried out, and in the “Save” menu, processing record samples are saved. The latter expands the possibilities of using processed samples of recordings for importing into separate software applications or interfaces for their further analysis, for example, for analyzing heart rate variability [30], which is the task of secondary information processing, for making a diagnostic decision [30].
The software interface is equipped with the tools necessary for the analysis of the obtained processing and its visualization, the results of which are depicted in Figures 9 and 10 herein.
Comparing the signals of the noisy and the filtered recording of ECG signals and their frequency spectra, presented in Figure 9, it can be noted that the proposed approach to the cascade system minimizes the effect of full-scale high-frequency electrical interference at a frequency of 50 Hz and its harmonics at a frequency of 100 Hz. Evaluating the frequency composition of a full-scale noisy recording, we note that the amplitude of the first harmonic of the mains interference is much greater than that amplitude of the second harmonic at a frequency of 100 Hz. In the diagrams, the abscissa shows the time in seconds and the frequency in hertz, the ordinate shows the amplitude signals in relative units.
The analysis of the obtained results of processing of natural recording of the ECG signal shows that the series incorporations of two notch filters improve the processing efficiency under the influence of natural electrical noise and its harmonics. Note that if the experimental value of SDMV before the application of the cascade system is less than the SDMV value after the filter, then the proposed filtering approach attenuates the high-frequency components, which distort the amplitude-time parameters of the ECG signal.
The value of the confidence interval error in measuring the parameters of the ECG signal shows 1 discrete sampling, which allows us to consider the assessment as adequate. The quantitative results of processing, presented in Table 6 herein, have been obtained during the processing of a full-scale ECG signal recording and calculated using the developed software interface (see Figure 10 herein).
Thus, taking into account the results obtained above, we can conclude that the proposed algorithmic approach to processing an ECG signal, based on nar-
Issue 19. August 2021 | Cardiometry | 33
Table 6
Full-scale ECG signal recording processing results evaluation
|
Indicator |
Cascade sequence |
|
|
The first, n =2 |
The second, n =4 |
|
|
SDMV before filtering, σ, samples |
260,4 |
|
|
SDMV after filtering, σ, samples |
106,7 |
105,6 |
|
Mean value, μ, samples |
5,5854 |
4,4854 |
|
Confidence interval for assessing the filtering error, counts |
±0,9332 |
±0,9229 |
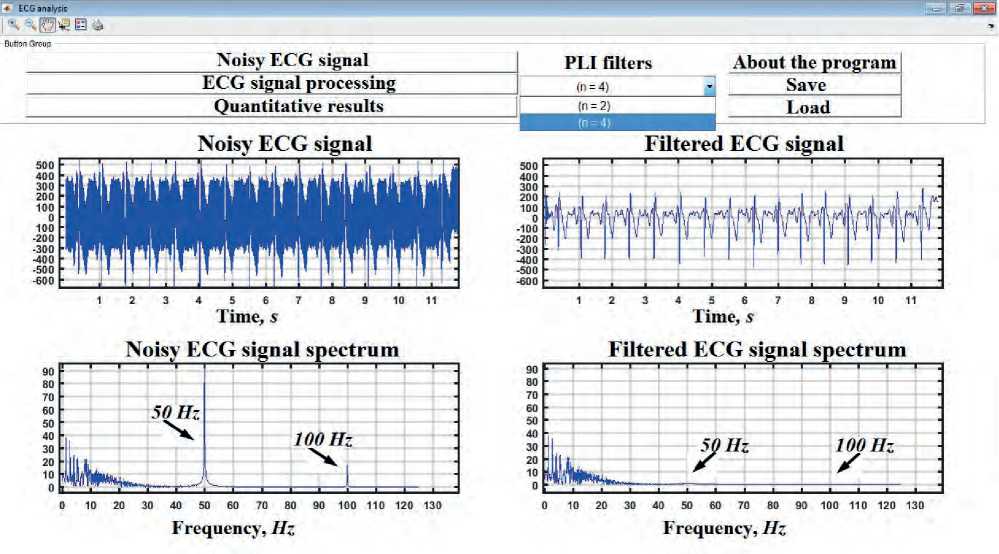
Figure 9. Results of loading a noisy recording of ECG signals and its processing
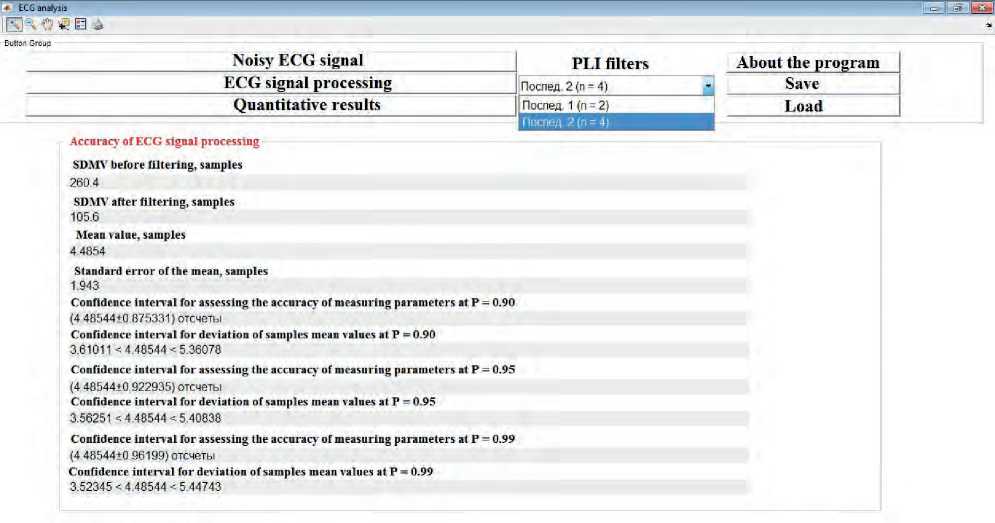
Figure 10. Quantitative results of ECG signal processing
row-band notch filtering, opens up new opportunities for improving the quality of processing recording measurements in relation to high-frequency electrical interference.
Conclusion
In our research work under consideration, a new processing approach is proposed to improve the accuracy in selection of informative components of ECG signals under the influence of electrical noise and its harmonics. This approach is implemented on the basis of a series connection of two stable narrow-band notch filters of the oscillatory types. Our analysis of the quantitative indicators has revealed that when selecting the value coefficient ξ = 0.1 for the narrow-band notch filters, the efficiency of the analysis of processing ECG signals increases. At the same time, the quantitative results of processing of the test shape signals in the selected damping coefficient system has demonstrated the minimization of measurement errors and a rise in the measurement accuracy of the informative components of ECG signals, as well as an increase in the noise resistance of the processing system under the influence of power line interference. The qualitative results confirm the similarity of the filtered ECG signal shape to the test signal shaping. Our studies have shown that the smaller the damping coefficient of the narrow-band notch filters, the better its selectivity for noise suppression as compared to filters with values ξ> 0.1.
To confirm the practical applicability of the proposed signal processing approach, our research paper presents the results of our experimental study of processing of a full-scale noisy single-channel ECG signal recording. As a result from our study, it has been found that our signal processing approach improves the accuracy in extracting and measuring ECG signal amplitudes and time parameters.
Statement on ethical issues
Research involving people and/or animals is in full compliance with current national and international ethical standards.
Conflict of interest
None declared.
Author contributions
The authors read the ICMJE criteria for authorship and approved the final manuscript.
References Evaluation of a damping coefficient influence made by notch filters on efficiency of ECG signals processing
- Altay YA, Kremlev AS. Analysis and systematization of noise arising by long-term recording of ECG signal. Proc.of EIConRus Intern. Conf.; Univ. Eltech, Saint Petersburg, Russian Federation; 2018.
- Turulin II., Verich JuB. Primenenie sistemy Matlab dlja sinteza bystrodejstvujushhih grebenchatyh fil’trov. Cifrovaja obrabotka signalov. 2004(2):31-33. [in Russian]
- Alam ST. Towards Development of a Low Cost and Portable ECG Monitoring System for Rural /Remote Areas of Bangladesh. International Journal of Image, Graphics & Signal Processing. 2018. (5):24-32.
- Rangajjan PM. Analiz biomedicinskih signalov. M.: Fizmatlit,; 2010. [in Russian]
- Avdeeva DK, et al. The simulation results of the high-pass and low-pass filter effect on the quality of micropotential recordings on the electrocardiogram. European Journal of Physical and Health Education. 2014(1):1-10.
- Fedotov AA, Akulova AS, Akulov SA. Analysis of the parameters of frequency filtering of an electrocardiograph signal. Measurement Techniques. 2015(11):1320-1325.
- Fedotov AA. Selection of Parameters of Bandpass Filtering of the ECG Signal for Heart Rhythm Monitoring Systems. Biomedical Engineering. 2016(2):114-118.
- Fedotov AA, Akulova AS. A QRS-complex detector of the electrocardiogram signal for the longterm monitoring of the patient’s condition. Journal of Communications Technology and Electronics. 2017(4):415-420.
- Tompkins WJ. Biomedical digital signal processing. New Jersey: Upper Saddle River,; 2000.
- Altay YA, Kremlev AS, Zimenko KA, Margun AA. The Effect of Filter Parameters on the Accuracy of ECG Signal Measurement. Biomedical Engineering. 2019(53):176-180.
- Altay YA, Kremlev AS, Margun AA. ECG Signal Filtering Approach to Detection of P, QRS, T Waves and Complexes in Short Single-Lead Recording. Proc. of EIConRus Intern. Conf.; Univ. Eltech, Saint Petersburg, Russian Federation; 2019.
- Mugdha AC, Rawnaque FS, Ahmed MU. A study of recursive least squares (RLS) adaptive filter algorithm in noise removal from ECG signals. Proc. Of EEV Intern. Conf.; Fukuoka; 2015.
- Saxena S, Jais R., Hota MK. Removal of power line interference from ECG signal using FIR, IIR, DWT and NLMS adaptive filter. Proc. of CSP Intern. Conf.; Chennai; 2019.
- Tayel BM, Eltrass AS, Ammar AI. A new multistage combined kernel filtering approach toECG noise removal. Journal of Electrocardiology. 2018(2): 265-275.
- Mugdha AC, Rawnaque FS. Ahmed MU. A study of recursive least squares (RLS) adaptive filter algorithm in noise removal from ECG signals. Proc. Of EEV Intern. Conf.; Fukuoka; 2015.
- 36 | Cardiometry | Issue 19. August 2021 16. Malghan PG, Hota MK. A review on ECG filtering techniques for rhythm analysis // Research on Biomedical Engineering. 2020(2): 171-186.
- Li J, Deng G., Wei W., Wang H. Design of a real-time ECG filter for portable mobile medical systems. IEEE Access. 2017(5): 696-704.
- Bui NT. Real-Time Filtering and ECG Signal Processing Based on Dual-Core Digital Signal Controller System. IEEE Sensors Journal. 2020(12): 6492-6503.
- Ozkan HA Portable Wearable Tele-ECG Monitoring System. IEEE Transactions on Instrumentation and Measurement. 2019(1): 173-182.
- Tychkov AJu, Churakov PP., Krivonogov LJu. Avtomatizirovannaja sistema obrabotki i analiza jelektrokardiosignalov v uslovijah intensivnyh pomeh razlichnogo vida. Izvestija vysshih uchebnyh zavedenij. Povolzhskij region. 2011(1): 117-125. [in Russian]
- Rakshit M, Das S. An efficient ECG denoising methodology using empirical mode decomposition and adaptive switching mean filter. Biomedical Signal Processing and Control. 2018(4):140-148.
- Suchetha M, Kumaravel N. Empirical mode decomposition based filtering techniques for power line interference reduction in electrocardiogram using various adaptive structures and subtraction methods // Biomedical Signal Processing and Control. 2013(6):575-585.
- Han G, Xu Z. Electrocardiogram signal denoising based on a new improved wavelet thresholding // Review of Scientific Instruments. 2016(8):1-7.
- Vargas RN, Veiga AP. Electrocardiogram signal denoising by a new noise variation estimate. Research on Biomedical Engineering. 2020(36):13-20.
- Vargas RN., Veiga AP. Empirical Mode Decomposition, Viterbi and Wavelets Applied to Electrocardiogram Noise Removal. Circuits, Systems, and Signal Processing. 2020(39):1-28.
- Boronoev VV, Ompokov VD. The Hilbert-Huang Transform for biomedical signals processing. Proc. ICCTPEA, Intern. Conf.; Saint Petersburg, Russian Federation; 2014.
- Ompokov VD, Boronoyev VV. The problem of solving the Hilbert-Huang transform application for biomedical signal processing based on CEEMDAN method. Journal of Radio Electronics. 2017(5):1-7.
- Krivonogov LJu. Perspektivy primenenija preobrazovanija Gil’berta-Huanga dlja avtomatizirovannoj obrabotki jelektrokardiosignalov. Biotehnosfera. 2011(5):41-48. [in Russian]
- Zaitsev EV. Elimination on power line interference from ECG signal using combined bidirectional narrow-band notch filter. Biophysics. 2015(4):656-658.
- Mali B. Matlab-based tool for ECG and HRV analysis. Biomedical Signal Processing and Control. 2014(10):108-116.
- Jaa Zar Do. Metody i algoritmy klassifikacii jelektrokardiosignalov na osnove singuljarnogo analiza i nejrosetevogo modelirovanija: avtoreferat dis. … kand. teh. nauk. Kursk, 2015. 20p. [in Russian]
- Ellis G. Filters in control systems. Control system design guide. 2012(9):165-183.
- Ye Z., Mohamadian H. Application of modern control theory on performance analysis of generalized notch filters. Proc.of MOCAST Intern. Conf.; Greece; 2016.
- Paarman LD. Design and analysis of analog filters: a signal processing perspective. New-York: Kluwer academic publishers; 2003.
- Kwon O., Jeong J. Electrocardiogram Sampling Frequency Range Acceptable for Heart Rate Variability Analysis. Healthcare informatics research. 2018(24):198-206.
- Altay YA., Kremlev AS. Challenging task of identification of cardiac cycle tones: refined development of a PCG signal processing system. Cardiometry. 2019(14):71-77.
- Lajons R. Cifrovaja obrabotka signalov. M.: Binom,; 2006. [in Russian]
- Python Graphing Library, Plotly. [Online]. Available: https://plot.ly/python/
- Altay YA, Kremlev AS. On the Use of the Statistical Methods for Biomedical Signals and Data Processing. Proc.of EIConRus Intern. Conf.; Univ. Eltech, Saint Petersburg, Russian Federation; 2019.
- Truhacheva NV. Matematicheskaja statistika v mediko-biologicheskih issledovanijah s primeneniem paketa Statistica. M.: GJeOTAR-Media.; 2012 [in Russian]
- Stat Soft. [Online]. Available: http://statsoft.ru/resources/support/download.php
- Nemirko AP, Manilo LA, Kalinichenko AN. Matematicheskij analiz biomedicinskih signalov I dannyh. M.: Fizmatlit.; 2017. [in Russian]
- Hampton JR. The ECG made easy. UK: Elsevier Science Limited; 2003.
- Zajchenko KV., Zharinov OO., Kulin AN., Kulygina LA., Orlov AP. S#em i obrabotka biojelektricheskih signalov. SPb: RIO GUAP; 2001. [in Russian]
- Altay YA., Kremlev AS., Nuralinov OM, Vlasov SM., Penskoi AV., Zimenko KA., Margun AA. ComIssue 19. August 2021 | Cardiometry | 37 parative analysis of characteristics of electrodes to estimate accuracy in recording long-term ECG signal parameters. Cardiometry. 2019(15):63-72.
- Tihonenko VM., Shihaliev DR. Oshibki pri ocenke dannyh Holterovskogo monitorirovanie. Vestnik Aritmologii. 2015(82):12-20. [in Russian]
