Evaluation of functional significance of intermediate coronary artery lesions noninvasively by tissue Doppler echocardiography and single photon emission computed tomography versus invasively by IFR

Author: Ebaid H.H.A., Arafa O.S., Shaker A.F., Mohamed O.A., Mohamed O.K.
Journal: Cardiometry @cardiometry
Section: Original research
Article in issue: 31, 2024.
Free access
Background: Myocardial perfusion imaging by single photon emission computed tomography (MPI-SPECT) is noninvasive test that can give an important information for the diagnosis of coronary artery disease (CAD), detect reversible ischemia, quantify defect sizes and help in clinical decisions of interventions as well as assessment of disease prognosis. Tissue Doppler imaging (TDI) emerged as a potential modality for assessing systolic and diastolic LV performance. Strain doppler echocardiography (SDE) is a new tool for measuring regional myocardial deformation excluding the effect of adjacent myocardial tissue. The development of Instantaneous wave-free Ratio (IFR) as a relatively new invasive method for physiological assessment of coronary lesions without the use of pharmacologic hyperemic agents is the golden standard test for assessment of intermediate coronary lesions and guiding the revascularization decision.
Coronary artery lesion, tissue doppler echocardiography, single photon emission computed tomography, instantaneous wave-free ratio
Short address: https://sciup.org/148328848
IDR: 148328848 | DOI: 10.18137/cardiometry.2024.31.185197
Text of the scientific article Evaluation of functional significance of intermediate coronary artery lesions noninvasively by tissue Doppler echocardiography and single photon emission computed tomography versus invasively by IFR
Hany Hassan Ahmed Ebaid 1, Osama Sanad Arafa 1, Amin Fouad Shaker 2, Osama Abdelmomen Mohamed 2 and Osama Khalil Mohamed. Evaluation of Functional Significance of Intermediate Coronary Artery Lesions Noninvasively by Tissue Doppler Echocardiography and Single Photon Emission Computed Tomography Versus Invasively by IFR. Cardiometry; Issue 31; May 2024; p. 185-197; DOI: 10.18137/cardiometry.2024.31.185197; Available from:
Coronary angiography is the reference test for the diagnosis of CAD. However, the relationship between the angiographic stenosis severity and the coronary blood flow is complex. The visual assessment of stenosis severity is subjective and correlates poorly with physiological significance. Unfortunately, coronary angiography has many pitfalls and limitations that may impair the judgment of stenosis severity and then affect decision making regarding intervention [1].
Echocardiography is the standard method for assessing myocardial function in patients with ischemic heart disease. The acquisition and interpretation of echocardiographic images, however, remains a highly specialized task which often relies entirely on the subjective visual assessment of the reader and requires therefore, particular training and expertise. Tissue Doppler echocardiography (TDE) is a promising method for assessing regional myocardial function. However, myocardial velocities measured by tissue doppler echocardiography (TDE) vary throughout the left ventricle (LV) because of tethering effects from adjacent tissue [2].
Strain Doppler echocardiography (SDE) is a new tool for measuring regional myocardial deformation excluding the effect of adjacent myocardial tissue. Strain reflects deformation of the structure and therefore directly describes the contraction/relaxation pattern of the myocardium [3].
Myocardial perfusion imaging by single-photon emission tomography (MPI–SPECT) is noninvasive test that can give an important information for the diagnosis of CAD, detect reversible ischemia, quantify defect sizes and help in clinical decisions of interventions as well as assessment of disease prognosis and guiding the revascularization decision. Diminished uptake of the radiopharmaceutical agent reflects the presence of significant CAD in the affected segment. Ischemia was considered significant in the presence of stress induced-ischemia in a wide myocardial area ( ⩾ 10%) [4].
However, MPI may be of limited value for assessment of lesion severity in case of presence of multivessel disease, microvascular disease, and in case of multiple lesions. It has been even used for early validation of invasive physiological assessment by fractional flow reserve (FFR) [5]. Despite this fact, the patient outcome studies performed on the role of invasive physiological assessment by FFR created a prestigious position and enlightened a hot spot on FFR use for functional assessment of coronary lesions, and so FFR is now considered the gold standard test for this purpose[6]. The development of Instantaneous wave-free Ratio (IFR) as a relatively new invasive method for physiological assessment of coronary lesions without the use of pharmacologic hyperemic agents has solved the problem partially but is still considered a relatively expensive test with our limited resources [7]. On the other hand, tissue doppler echocardiography and myocardial perfusion imaging by single-photon emission tomography are non-invasive, relatively non-expensive tests and are well supported in the national health insurance systems unlike IFR which is less supported by the insurance programs so its use is usually limited even when needed for decision-making[8].
The aim of this work was to compare results of tissue doppler echocardiography and myocardial perfusion imaging by single-photon emission tomography as non-invasive, relatively non-expensive tests versus the instantaneous wave-free ratio (IFR) for the assessment of functional significance of the intermediate coronary artery lesions for decision making and guiding plan of management.
PATIENTS AND METHODS
This Cross-sectional study was done was conducted on 50 cases with intermediate coronary artery lesions admitted at the Cardiology departments in Benha University, Kobry Elkobba Military Hospital and Air Force Specialized Hospital., throughout the period from July 2022 till January 2024. The study was presented to the research Ethics Committee of faculty of medicine-Benha University and approved with approval code (8-12-2021). Informed consent was obtained from the patients before participating in this study.
All groups were subjected to History and clinical examination: including age, sex, NYHA functional classification, history of ischemic heart disease, history of diabetes mellitus, blood pressure and cardiac examination, 12lead ECG to detect any baseline abnormalities.
Routine laboratory investigations: including CBC, serum creatinine, lipid profile, and HBA1C. 2D transthoracic echocardiography: to assess left ventricular dimensions, systolic function, resting segmental wall motion abnormalities and cardiac valves.
Inclusion criteria were All patients with stable CAD who undergone coronary angiography and those with CA showing single intermediate degree of coronary artery stenosis, visually judged as angiographic stenosis more than or equal to 50% and less than or equal to 70% assessed by at least two expert operators followed by invasive assessment of intermediate lesion by IFR.
Exclusion criteria were Patients with certain limitations to IFR included [Patients who are contraindicated to CA, acute coronary syndrome, patients with marked left ventricular hypertrophy and patients with tandem lesions], patients contraindicated to SPECT [Iodine 131 treatment within the last 3 months, Indium 111 or gallium 67 scan within the last month,
Tc-99 imaging within 2 days, Pregnant ladies and Congestive heart failure], conditions that may cause a controversial interpretation of SPECT, conditions that may cause a controversial interpretation of tissue doppler echocardiography and clinically unstable patients for any reason.
IFR was done through transfemoral or transradial approach, 6Fr guiding catheter introduced with intracoronary injection of 100 μg of nitroglycerine. The pressure wire calibrated and introduced into the guiding catheter. The wire advanced to the tip of the guiding catheter into ascending aorta, and pressure equalized against the pressure measured through the guiding catheter.
The wire is then advanced across the target lesion and transstenotic pressure measurement done. The IFR was calculated as the ratio of mean distal coronary pressure measured by the pressure wire to mean aortic pressure measured by the guiding catheter.
IFR value less than or equal to 0.89 was considered significant, indicating functionally significant lesion and IFR value more than 0.89 was considered insignificant, indicating functionally insignificant lesion. The IFR is considered as the gold standard test for ischemia [9].
After that, those patients subjected to noninvasive assessment by tissue doppler echocardiography and SPECT.
All subjects were examined with colour TDI and 2-dimensional and M-mode echocardiography in the left lateral decubitus position. All images were recorded with second-harmonic imaging at the time of end expiration. The 16 standard segments model as suggested by the American Society of Echocardiography was used to evaluate regional function. systolic dysfunction was defined as left ventricular ejection fraction less than 50%.
Color TDI loops were obtained in the apical four-chamber, two chamber, and apical long-axis view at the highest possible frame rate. Smoothing was set to 30 ms. Peak longitudinal systolic (s ′ ), early diastolic (e ′ ), and late diastolic (a ′ ) velocities were measured at the six mitral annular sites dividing the left ventricle into six segments of interest; the septal, lateral, anterior, inferior, posterior, and anteroseptal myocardial walls. The global longitudinal performance of the left ventricle was assessed by averaging the myocardial velocities from the six mitral annular sites. E/e ′ was calculated using average e ′ measured by color TDI [10].
Tissue Doppler strain is obtained by simultaneous acquisition of grey scale and color tissue doppler data while only the grey scale image is displayed. We acquire apical four, three and two-chamber views as they allow to measure longitudinal strain in all segments for evaluation the regional myocardial deformation of the segments supplied by the same coronary artery and assessment of left ventricle GLS (global longitudinal strain) with normal value -18 or more and impaired function below -18 [11-12].
SPECT: stress and rest Tc99m sesta-MIBI myocardial perfusion SPECT 2day protocol was performed. Patients exercised on treadmill according to standard Bruce protocol.
Technetium99m sesta-MIBI 20 mci injected at peak exercise, and imaging acquisition started after 30–60 min. After 24 h, the patients reinjected with 20 mci Tc99m sesta-MIBI and reimaged 30–60 min later [13].
The patient was considered to have mild reversible ischemia with total perfusion defect size less than 10 % of total LV volume, moderate reversible ischemia with total perfusion defect size 10 – 20 % of total LV volume and severe reversible ischemia with total perfusion defect size more than 20 % of total LV volume.
STATISTICAL ANALYSIS:
Statistical analysis was done by SPSS v28 (IBM©, Armonk, NY, USA). Shapiro-Wilks test and histograms were used to evaluate the normality of the distribution of data. Quantitative parametric data were presented as mean and standard deviation (SD) and were analyzed by ANOVA (F) test with post hoc test (Tukey. Qualitative variables were presented as frequency and percentage (%) and were analyzed utilizing the Chi-square test. A two tailed P value < 0.05 was considered statistically significant. Spearman correlation was done to estimate the degree of correlation between two quantitative variables. The overall diagnostic performance of each test was assessed by ROC curve analysis. The area under the curve (AUC) evaluates the overall test performance.
CASE:
Female patient, 61 years old, heavy smoker, not hypertensive or diabetic, complaining of stitching chest pain, not referred to lt. shoulder or back. Clinical examination: within normal vital data (blood pressure 120/80 mmHg, pulse 75/min regular, Respiratory rate 14/min and temperature 37° C), auscultation of the heart revealed normal heart sounds, with no additional sounds or murmurs and her BMI was 27.8 kg/m2.
Laboratory findings, CBC: TLC 5.3 [103/mm3], HB 15.5 [g/dl] and PLT 228 [103/mm3], Lipid profile: Total cholesterol 160 mg/dL, Triglycerides 90 mg/ dL, HDL 56 mg/dL, LDL 77 mg/dL, VLDL 18 mg/Dl, S. creatinine 0.7 mg/dL, HBA1C 5.1 %*, ECG: NSR, nonspecific changes.
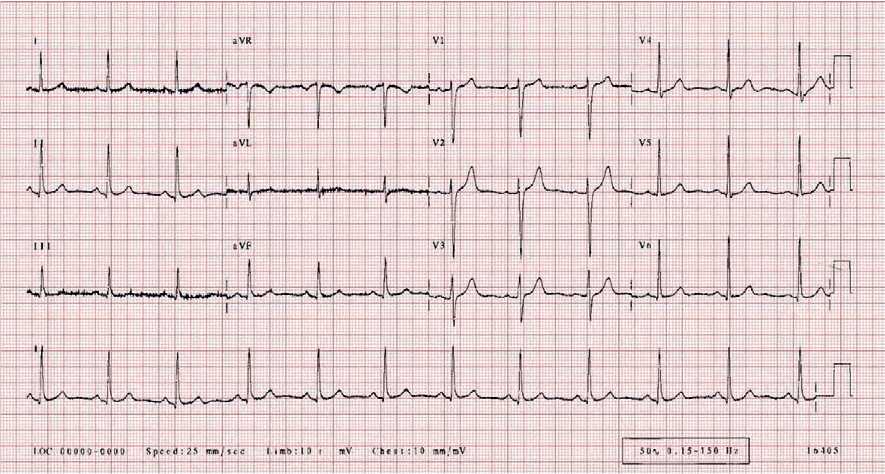
Figure 1: showed Normal ECG
(A) (B)
(C) (D)
(A)
(B)
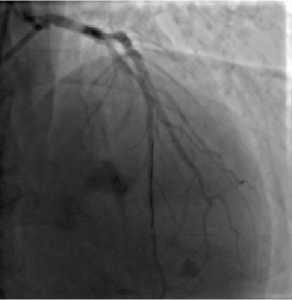
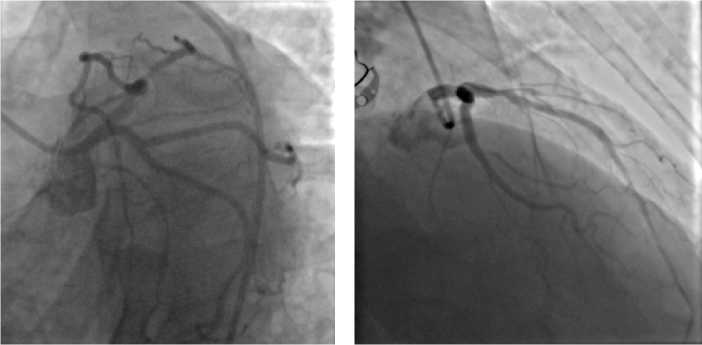
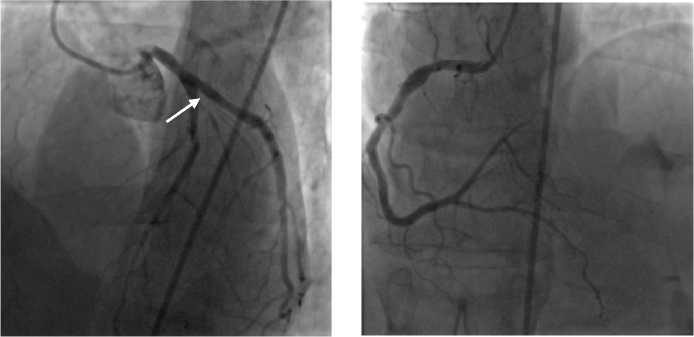
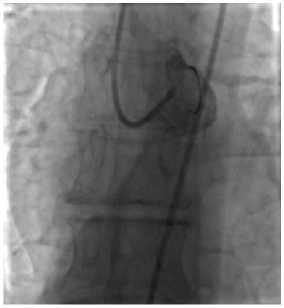
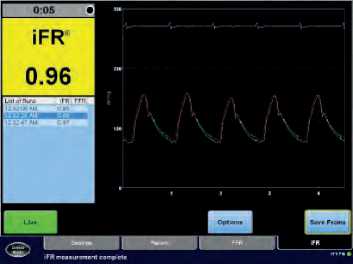
Figure 3: A, B and C showed IFR 0.96 and revealed non-significant proximal LAD lesion
( C )
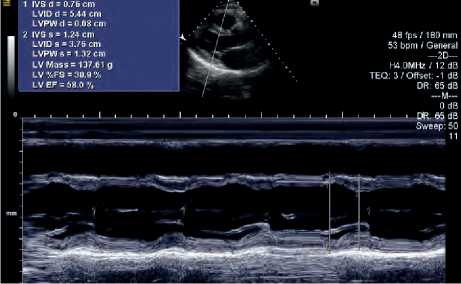
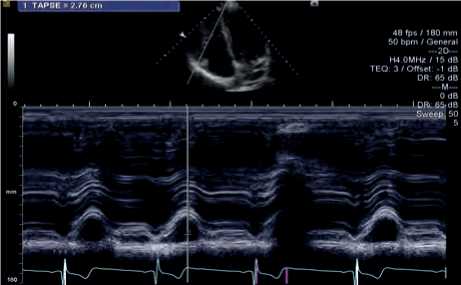
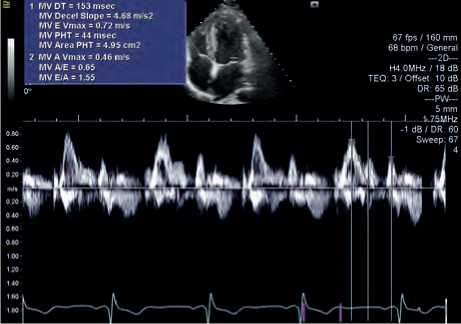
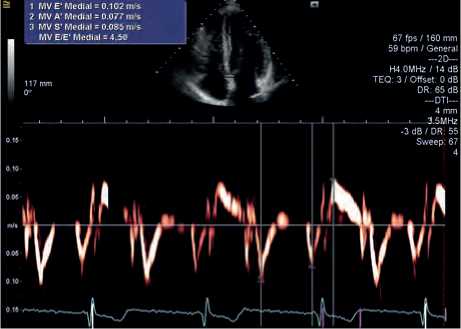
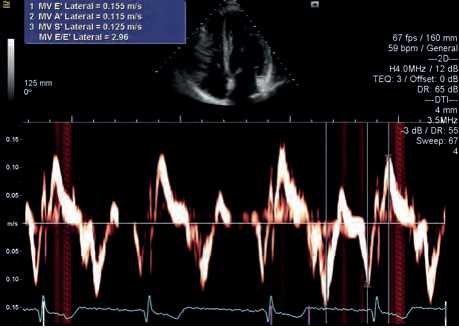
Figure 4: (A) and (B) showed within normal LV systolic function (EF 58 %) and normal RV function (TAPSE 2.7 cm), (C) showed normal diastolic function, normal DT 153 ms and E/A ratio 1.55 (D) showed normal Medial E/e´ ratio 4.5 (E) showed normal Lateral
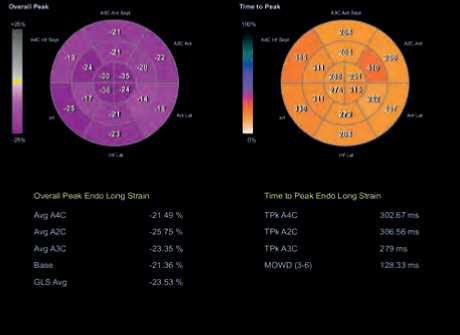
E/e´ ratio 2.9 (F) showed normal LV GLS -23.5
( F )
( E )
°o Thickening
SCOr0S Anterior
4: Absent Summed Difference Score. О
Reversibility о
Inferior
Scores О Normal 1: Equivocal Summed Stress Score: О
Total Seventy Scores Stress 131
2. Moderate Reduction 3 Severe Reduction Summed Rest Score. О
Rest: 4G
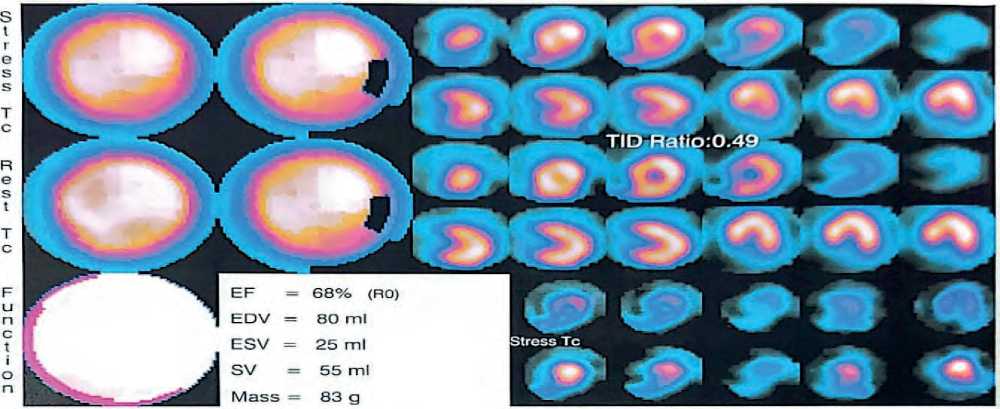
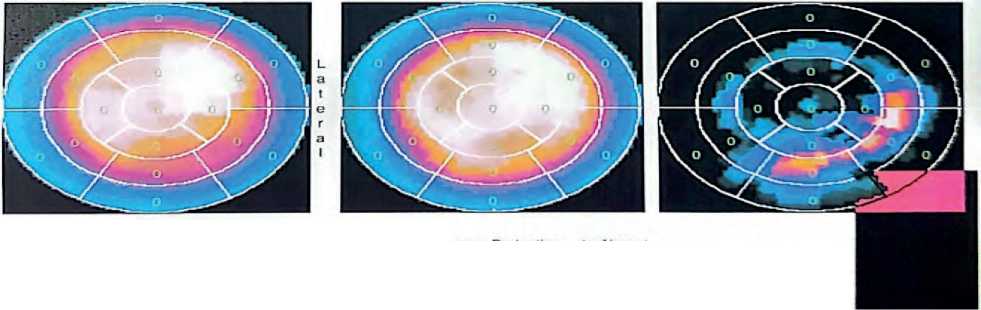
Figure 5: showed normal myocardial perfusion pattern is elicited all over the average sized LV in both study sets of SPECT.
ing proximal intermediate lesion, LCX: Non-dom-inant atherosclerotic vessel with no lesion and RCA: Dominant atherosclerotic vessel showing proximal ectasia with no lesion.
RESULTS
We had divided the study group into 4 groups depending on SPECT finding. The 1st group was normal with negative perfusion defect, the 2nd group was mild reversible ischemia with total perfusion defect size less than 10 % of total LV volume, the 3rd group was moderate reversible ischemia with total perfusion defect size 10 – 20 % of total LV volume and 4th group was severe reversible ischemia with total perfusion defect size more than 20 % of total LV volume.
Table 1 showed highly significant increase in age and BMI, ST depression, and Inverted T wave, TLC, Creatinine, HbA1C, total cholesterol, TGs, LDL, and VLDL in Moderate and Severe ischemia groups compared to other groups (p < 0.01). There was a highly significant decrease in HDL in Moderate and Severe ischemia groups compared to other groups (p < 190 | Cardiometry | Issue 31. May 2024
0.001). Gender was insignificantly different among the studied groups (p > 0.05).
As regards coronary Angiography findings there was significant decrease in RCA affection in Moderate and Severe ischemia groups compared to other groups (p < 0.05). Regarding 2D Echocardiographic parameters there were highly significant increase in LVEDD, LVESD, WMSI, and diastolic dysfunction grade in Moderate and Severe ischemia groups compared to other groups (p < 0.01). There was highly significant decrease in LVFS, LVEF by MM and LV GLS in Moderate and Severe ischemia groups compared to other groups (p < 0.01).
Regarding Tissue Doppler echocardiography, there was highly significant increase in Mitral E-velocity, E/A ratio, Septal E/e’ velocity ratio, Lateral E/e’ velocity ratio and Mean E/e’ velocity ratio in Moderate and Severe ischemia groups; compared to other groups (p < 0.01). there was highly significant decrease in Sm-velocity, DT, Mitral A-velocity, Septal e’ velocity, and Lateral e’ velocity, in Moderate and Severe ischemia groups; compared to other groups (p < 0.01).
Table 1: Comparison between demographic data, risk factors and laboratory data among four groups
|
Variable |
Normal group (9) |
Mild reversible ischemia group (6) |
Moderate reversible ischemia group (26) |
Severe reversible ischemia group (9) |
ANOVA test |
|
|
Age (years) |
56.6 ± 3.4 |
54.3 ± 3.5 |
58.4 ± 4.3 |
60.8 ± 3 |
= 0.014* |
|
|
BMI |
26.5 ± 0.6 |
26.3 ± 0.8 |
29.3 ± 1.5 |
28.8 ± 0.8 |
< 0.001** |
|
|
Gender |
Female |
3 (33.3%) |
1 (16.7%) |
8 (30.8%) |
2 (22.2%) |
= 0.8597 |
|
Male |
6 (66.7%) |
5 (83.3%) |
18 (69.2%) |
7 (77.8%) |
||
|
Past history of MI |
0 (0%) |
0 (0%) |
0 (0%) |
0 (0%) |
= 1.000 |
|
|
Past history of PCI |
3 (33.3%) |
1 (16.7%) |
4 (15.4%) |
5 (55.6%) |
= 0.1054 |
|
|
Family history of IHD |
0 (0%) |
1 (16.7%) |
20 (76.9%) |
7 (77.8%) |
= 0.0001** |
|
|
HTN |
5 (55.6%) |
1 (16.7%) |
18 (69.2%) |
8 (88.9%) |
= 0.031* |
|
|
DM |
3 (33.3%) |
5 (83.3%) |
23 (88.5%) |
8 (88.9%) |
= 0.005** |
|
|
Hyperlipidemia |
3 (33.3%) |
0 (0%) |
19 (73.1%) |
6 (55.6%) |
= 0.0061** |
|
|
Smoker |
7 (77.8%) |
3 (50%) |
18 (69.2%) |
7 (77.8%) |
= 0.6439 |
|
|
ST depression |
0 (0%) |
2 (33.3%) |
20 (76.9%) |
9 (100%) |
< 0.0001** |
|
|
Inverted T wave |
0 (0%) |
1 (16.7%) |
19 (73.1%) |
9 (100%) |
< 0.0001** |
|
|
Stable Angina |
9 (100%) |
6 (100%) |
26 (100%) |
9 (100%) |
= 1.000 |
|
|
Laboratory data |
||||||
|
Hb (g/dL) |
15 ± 0.5 |
14.7 ± 0.9 |
15.2 ± 0.6 |
15.4 ± 0.6 |
= 0.241 |
|
|
PLT (103/μL) |
233 ± 8 |
229 ± 8 |
269 ± 20 |
284 ± 20 |
< 0.001** |
|
|
TLC (103/μL) |
5.6 ± 0.2 |
5.5 ± 0.2 |
7.4 ± 0.6 |
8.2 ± 0.4 |
< 0.001** |
|
|
Creat. (mg/dL) |
0.7 ± 0.07 |
0.78 ± 0.04 |
0.9 ± 0.1 |
1.05 ± 0.11 |
< 0.001** |
|
|
HbA1C (mg/dL) |
5.4 ± 0.5 |
6.2 ± 0.4 |
7.7 ± 0.9 |
9.2 ± 1.4 |
< 0.001** |
|
|
T. Cholesterol (mg/dL) |
183 ± 27 |
167 ± 9 |
236 ± 40 |
223 ± 41 |
< 0.001** |
|
|
TGs (mg/dL) |
127 ± 19 |
132 ± 18 |
152 ± 16 |
151 ± 14 |
= 0.001** |
|
|
LDL (mg/dL) |
105 ± 31 |
86 ± 8 |
163 ± 41 |
149 ± 43 |
< 0.001** |
|
|
VLDL (mg/dL) |
25.5 ± 3.9 |
26.4 ± 3.6 |
30.5 ± 3.3 |
30.2 ± 2.9 |
= 0.001** |
|
|
T. Cholesterol (mg/dL) |
183 ± 27 |
167 ± 9 |
236 ± 40 |
223 ± 41 |
< 0.001** |
|
|
HDL (mg/dL) |
51 ± 4.4 |
54 ± 2.5 |
42 ± 4.5 |
43 ± 5.2 |
< 0.001** |
|
Data presented as mean ± SD or median (IQR), Χ²: Chi-Square test ANOVA: analysis of variance. * Percentage of Column Total. Percentage of Column Total, MI: Myocardial infarction, PCI: percutaneous intervention, HTN: hypertension, IHD: ischemic heart disease, DM: diabetes mellitus, Hb: hemoglobin, PLT: platelets, Creat: creatinine, TGs: triglycerides, LDL: low density lipoproteins, VLDL: very low density lipoproteins, HDL: high density lipoproteins.
Concerning the IFR parameters, there was a highly significant decrease in IFR value, in Moderate and Severe ischemia groups; compared to other groups (p < 0.01) and highly significant increase in IFR Significance, in Moderate and Severe ischemia groups; compared to other groups (p < 0.01).
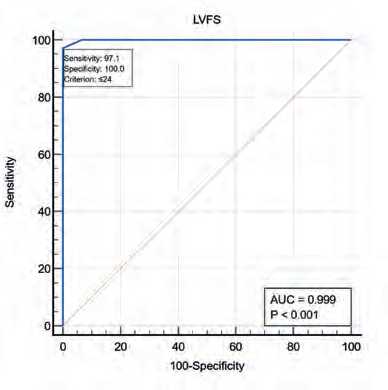
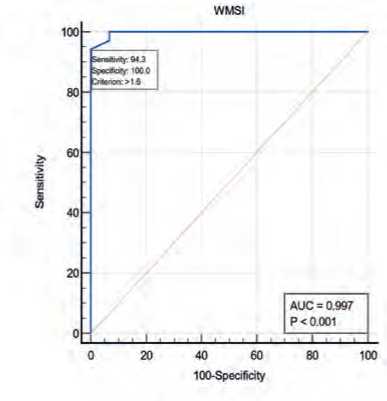
Figure 6 showed by using ROC-curve analysis, LVFS at a cutoff point (≤24) predicted patients with moderate and severe ischemia (needed PCI), with ex- cellent (99%) accuracy, sensitivity= 97% and specific-ity= 100% (p < 0.01). By using ROC-curve analysis, LVEF by MM at a cutoff point (≤48) predicted patients with moderate and severe ischemia (needed PCI), with excellent (99%) accuracy, sensitivity= 97% and speci-ficity= 100% (p < 0.01). WMSI at a cutoff point (>1.6) predicted patients with moderate and severe ischemia (needed PCI), with excellent (99%) accuracy, sensitiv-ity= 94% and specificity= 100% (p < 0.01).
Table 2: Comparison between coronary angiography findings, 2D Echocardiographic, SDE parameters and IFR among four groups depending on SPECT results
|
Variable |
Normal group (9) |
Mild reversible ischemia group (6) |
Moderate reversible ischemia group (26) |
Severe reversible ischemia group (9) |
Chi square test |
|
|
P value |
||||||
|
LM |
+ve |
0 (0%) |
0 (0%) |
0 (0%) |
0 (0%) |
= 1.000 |
|
LAD |
+ve |
2 (22.2%) |
0 (0%) |
16 (61.5%) |
9 (100%) |
= 0.0003** |
|
LCX |
+ve |
4 (44.4%) |
2 (33.3%) |
4 (15.4%) |
0 (0%) |
= 0.0849 |
|
RCA |
+ve |
3 (33.3%) |
4 (66.7%) |
6 (23.1%) |
0 (0%) |
= 0.033* |
|
Lesion severity |
Intermediate |
9 (100%) |
6 (100%) |
26 (100%) |
9 (100%) |
= 1.000 |
|
LVEDD (mm) |
48.1 ± 1.5 |
53 ± 2.9 |
63.3 ± 2.7 |
66.7 ± 0.9 |
< 0.001** |
|
|
LVESD (mm) |
32.2 ± 2.2 |
38 ± 3.2 |
49.1 ± 2.9 |
53.1 ± 1.2 |
< 0.001** |
|
|
LVFS (%) |
33 ± 3 |
28.3 ± 2.2 |
22.8 ± 1 |
20.6 ± 0.7 |
< 0.001** |
|
|
LVEF by MM (%) |
63.8 ± 3.5 |
55.5 ± 3.2 |
45.2 ± 1.9 |
41.2 ± 1 |
< 0.001** |
|
|
WMSI |
1 ± 0 |
1.2 ± 0.2 |
1.7 ± 0.09 |
1.9 ± 0.05 |
< 0.001** |
|
|
Diastolic dysfunction grade |
Grade-1 Grade-2 Grade-3 |
9 (100%) 0 (0%) 0 (0%) |
6 (100%) 0 (0%) 0 (0%) |
2 (7.7%) 16 (61.5%) 8 (30.8%) |
0 (0%) 0 (0%) 9 (100%) |
< 0.0001** |
|
Sm-velocity (cm/s) |
9.5 ± 0.5 |
8.3 ± 0.5 |
6.7 ± 0.3 |
6.1 ± 0.2 |
< 0.001** |
|
|
DT (ms) |
226.1 ± 4.2 |
218.3 ± 5.3 |
178.3 ± 16.4 |
156.2 ± 2.4 |
< 0.001** |
|
|
Mitral E-velocity (cm/s) |
42.2 ± 1.9 |
43 ± 1.6 |
70.6 ± 8.9 |
80.7 ± 3.6 |
< 0.001** |
|
|
Mitral A-velocity (cm/s) |
72.3 ± 4 |
63 ± 4.9 |
48.7 ± 10.5 |
33.3 ± 1.2 |
< 0.001** |
|
|
E/A ratio |
0.5 ± 0.04 |
0.7 ± 0.07 |
1.5 ± 0.5 |
2.3 ± 0.1 |
< 0.001** |
|
|
Septal e’ velocity (cm/s) |
6.3 ± 0.4 |
5.5 ± 0.4 |
5.7 ± 0.8 |
5 ± 0.2 |
< 0.001** |
|
|
Septal E/e’ velocity ratio |
6.5 ± 0.4 |
7.7 ± 0.7 |
12.5 ± 2.6 |
16 ± 0.4 |
< 0.001** |
|
|
Lateral e’ velocity (cm/s) |
7.9 ± 0.6 |
6.5 ± 0.6 |
6.3 ± 1 |
5.3 ± 0.2 |
< 0.001** |
|
|
Lateral E/e’ velocity ratio |
5.3 ± 0.4 |
6.5 ± 0.6 |
11.4 ± 2.7 |
15 ± 0.4 |
< 0.001** |
|
|
Mean E/e’ velocity ratio |
5.9 ± 0.4 |
7.1 ± 0.6 |
11.9 ± 2.7 |
15.4 ± 0.4 |
< 0.001** |
|
|
LV GLS |
-20.6 ± 1.5 |
-17.8 ± 0.9 |
-14.1 ± 0.8 |
-12.4 ± 0.5 |
< 0.001** |
|
|
IFR parameters |
||||||
|
IFR value |
0.9 ± 0.01 |
0.9 ± 0.007 |
0.8 ± 0.02 |
0.7 ± 0.01 |
< 0.001** |
|
|
IFR Significance |
0 (0%) |
0 (0%) |
26 (100%) |
9 (100%) |
< 0.001** |
|
Data presented as mean ± SD or median (IQR), Χ²: Chi-Square test ANOVA: analysis of variance. * Percentage of Column Total. Percentage of Column Total, LM: Left main coronary artery, LAD: left anterior descending artery, LCX: Left Circumflex coronary artery, RCA: Right coronary artery, LVED: Left ventricular end-diastolic diameter, LVESD: left ventricular end-systolic diameter, WMSI: wall motion score index, LVEDD: Left ventricular end-diastolic diameter.
Figure 7 IFR value at a cutoff point (≤0.86) predicted patients with moderate and severe ischemia (needed PCI), with excellent (100%) accuracy, sensi-tivity= 100% and specificity= 100% (p < 0.01).
Pearson’s correlation analysis shows that; Sm-ve-locity, and DT, had a highly significant positive cor- 192 | Cardiometry | Issue 31. May 2024
relation with IFR value (p < 0.01). E/A ratio and Mean E/e’ velocity ratio had a highly significant negative correlation with IFR value (p < 0.01) as shown in Table 3.
Pearson’s correlation analysis shows that; Gated SPECT LVEF and IFR value had a highly significant negative correlation with LV GLS (p < 0.0001).
E_A_rat)o
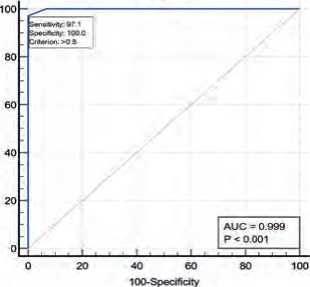
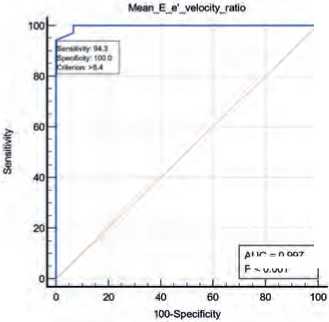
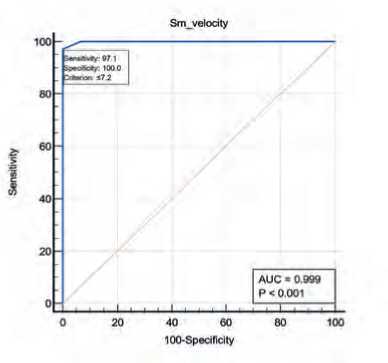
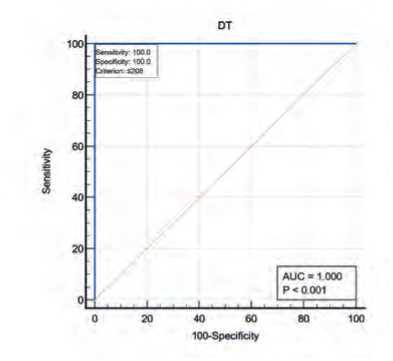
Figure 6: ROC curves of 2D Echocardiographic parameters among moderate and severe ischemia by SPECT
AUG = 0 997
P<0001
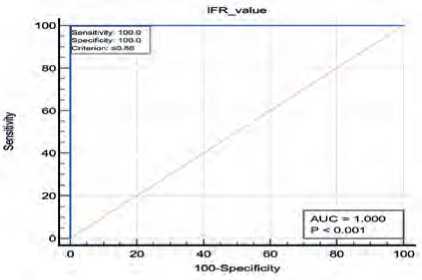
Figure 7: ROC curve of IFR parameters among moderate and severe ischemia
Table 3: Pearson’s correlation analysis for SPECT and tissue doppler with IFR value
|
Associated Factor |
IFR value |
||
|
r |
P value |
||
|
Tissue Doppler |
Sm-velocity |
0.9360 |
<0.0001** |
|
DT |
0.9560 |
<0.0001** |
|
|
E/A ratio |
-0.9222 |
<0.0001** |
|
|
Mean E/e’ velocity ratio |
-0.9354 |
<0.0001** |
|
r: Pearson’s rho (correlation coefficient).
Table 4: Pearson’s correlation analysis for tissue doppler LV GLS with SPECT and IFR value:
|
Associated Factor |
LV GLS |
||
|
r |
P value |
||
|
SPECT |
Gated SPECT LVEF (%) |
-0.9951 |
<0.0001** |
|
IFR |
IFR value |
-0.9486 |
<0.0001** |
r: Pearson’s rho (correlation coefficient).
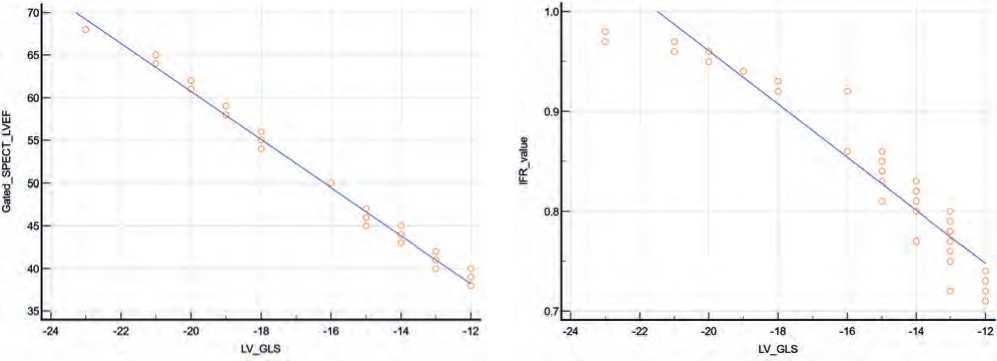
Figure 8: Correlation between LV GLS and IFR value.
Figure13: Correlation between LV GLS and Gated SPECT LVEF.
DISCUSSION
Comparative study between the 4 groups revealed; highly significant increase in age and BMI, in Moderate and Severe ischemia groups; compared to other groups (p < 0.05 respectively). Which came in agreement with Hoffmann et al.[14]. Comparative study between the 4 groups revealed; highly significant increase in family history of IHD, HTN, DM, and Hyperlipidemia, in Moderate and Severe ischemia groups; compared to other groups (p < 0.05 respectively). Which came in agreement with Mochula et al., [15] who concluded that, most patients were male (71%), more than one-half had hypercholesterolemia, and more than two-thirds had hypertension. Diabetes mellitus was diagnosed in 28% of cases. In 74% of cases, coronary artery disease (CAD) was known, and 78% patients had chest pain. Less than half of patients were current smokers; body mass index was over 30 in 43% of cases Our results came in disagreement with Acar et al., [16] who reported that, Diabetes mellitus, dyslipidemia, hypertension, smoking, primary PCI, troponin, systolic blood pressure, and heart rate, on the other hand, showed no significant differences between groups
Comparative study between the 4 groups revealed; highly significant increase in platelets, TLC, Creatinine, HbA1C, total cholesterol, TGs, LDL, and VLDL, in Moderate and Severe ischemia groups; compared to other groups (p < 0.01). Which came in agreement with Labombarda et al [17] who concluded that total and LDL-C were at moderately elevated mean levels, 76% of the patients being on statin treatment.
Regarding efficacy of Tissue doppler; By using ROC-curve analysis, Sm-velocity at a cutoff point (≤7.2) predicted patients with moderate and severe ischemia (needed PCI), with excellent (99%) accuracy, sensitivity= 97% and specificity= 100% (p < 0.01).
By using ROC-curve analysis, DT at a cutoff point (≤208) predicted patients with moderate and severe ischemia (needed PCI), with excellent (100%) accuracy, sensitivity= 100% and specificity= 100% (p < 0.01).
By using ROC-curve analysis, E/A ratio at a cutoff point (>0.8) predicted patients with moderate and severe ischemia (needed PCI), with excellent (99%) accuracy, sensitivity= 97% and specificity= 100% (p < 0.01). By using ROC-curve analysis, Mean E/e’ velocity ratio at a cutoff point (>8.4) predicted patients with moderate and severe ischemia (needed PCI), with excellent (99%) accuracy, sensitivity= 94% and specific-ity= 100% (p < 0.01). Which came in agreement with Imamura et al., [18].
Chen et al., [19] reported that, the mean values for systolic myocardial velocity in the basal and mid segment were 6.59 and 5.23 in the control group, and 5.02 and 3.27 in the patient’s group (p<0.001). The area under the ROC curve, sensitivity, and specificity were 0.82, 60.0%, and 91.7%, respectively, and 0.913, 83%, and 90.0% respectively.
Imamura et al., [19] also reported that, univariate analysis revealed that the left ventricular (LV) end-systolic volume, LV ejection fraction, and DDT were significantly associated with severe ischemia. After adjustment via multiple logistic regression analysis, the DDT was independently remained, who reported that with a cut-off value of 950ms, as determined by the ROC curve, DDT could detect severe ischemia with 81.1% sensitivity and 80.1% specificity. Regarding Efficacy of SPECT; By using ROC-curve analysis, Gated SPECT LVEF at a cutoff point (≤47) predicted patients with moderate and severe ischemia (needed PCI), with excellent (99%) accuracy, sensitivity= 97% and specificity= 100% (p < 0.01). Which came in agreement with Wang et al. [20] who also concluded that, the diagnostic efficiency by using the quantitative method of SPECT imaging is superior to traditional semi-quantitative gated MPI for the diagnosis of CAD, which improved the diagnostic specificity and accuracy when the critical was stenosis ≥50% .
Regarding Efficacy of IFR; By using ROC-curve analysis, IFR value at a cutoff point (≤0.86) predicted patients with moderate and severe ischemia (needed PCI), with excellent (100%) accuracy, sensitivity= 100% and specificity= 100% (p < 0.01). Which came in agreement with El Hajj et al [21].
El Hajj et al., [21]also reported that, the receiver operating curve analysis showed that an iFR of ≤0.89 identified minimum lumen area (MLA) <6 mm2 with an area under the curve of 0.77 with a sensitivity and specificity of 77% and 66%, respectively (P<0.0001). Among the 69 patients without ostial LAD or LCX disease, receiver operating curve analysis showed that an iFR of ≤0.89 identified MLA <6 mm2 with an area under the curve of 0.84, with sensitivity and specificity of 70% and 84%, respectively (P<0.0001). Positive and negative predictive value of using iFR of ≤0.89 to identify MLA <6 mm2 were 0.77 and 0.66 in all patients, and 0.84 and 0.71 in those without ostial disease, who also reported that Pearson’s correlation analysis shows that; Gated SPECT LVEF, Sm-velocity, and DT, had a highly significant positive correlation with IFR value (p < 0.01).
Pearson’s correlation analysis shows that; E/A ratio and Mean E/e’ velocity ratio had a highly significant negative correlation with IFR value (p < 0.01). Which came in agreement with Pang et al., [22].
De Winter et al.,[23] also concluded that, the correlation coefficient between FFR and iFR was 0.82. FFR and iFR agreement was observed in 424 (91%) vessels, whereas discordance occurred in 44 (9%) vessels. Specifically, 79 (17%) vessels showed concordant low, 22 (5%) FFR high/iFR low, 22 (5%) FFR low/iFR high, and 345 (74%) concordant high FFR/iFR measurements.
This study has some limitations included relatively small sample size, limited number of female cases and short- and long-term outcomes for the study group weren’t studied.
CONCLUSIONS
IFR modality is a reliable measure to guide functional significance of the intermediate coronary artery lesions for decision making and guiding plan of management. But it is an expensive and invasive modality. On the other hand, SPECT and tissue doppler modalities showed high sensitivity and specificity in the same group of patients, with less expensive and non-inva-sive advantage.
We recommended that IFR is a recommended modality as a reliable measure to guide functional significance of the intermediate coronary artery lesions for decision making and guiding plan of management and SPECT and tissue doppler are also recommended modalities in the same group of patients, for their availability and non-expensive economic burden, and high sensitivity.
Financial support and sponsorship
Nil
Conflict of Interest
Nil
References Evaluation of functional significance of intermediate coronary artery lesions noninvasively by tissue Doppler echocardiography and single photon emission computed tomography versus invasively by IFR
- Amin OA, Hady YAA, Esmail M. Myocardial perfusion imaging by single-photon emission tomography (MPI SPECT) versus Instantaneous wave-free ratio (IFR) for assessment of functional significance of intermediate coronary artery lesions. Egypt Heart J. 2019;71:35-45.
- Slomka PJ, et al. Cardiac imaging: working towards fully-automated machine analysis & interpretation. Expert Rev Med Devices. 2017;14:197-212.
- Demir OM, et al. Invasive and non-invasive assessment of ischaemia in chronic coronary syndromes: translating pathophysiology to clinical practice. EJHM. 2022;43:105-17.
- Amin OA, Hady YAA, Esmail MANE-D. Myocardial perfusion imaging by single-photon emission tomography (MPI SPECT) versus Instantaneous wave-free ratio (IFR) for assessment of functional significance of intermediate coronary artery lesions. The Egyptian Heart Journal. 2019;71:35.
- Peper J, Becker LM, van Kuijk JP, Leiner T, Swaans MJ. Fractional Flow Reserve: Patient Selection and Perspectives. Vasc Health Risk Manag. 2021;17:817-31.
- Götberg M, Cook CM, Sen S, Nijjer S, Escaned J, Davies JE. The evolving future of instantaneous wavefree ratio and fractional flow reserve. J Am Coll Cardiol. 2017;70:1379-402.
- Abdelsamei MM, Eldeeb MA, Gad MM, Sallam MA. Outcomes of instantaneous wave-free ratio versus fractional flow reserve guided strategies for coronary revascularization in patients with acute myocardial infarction. EJHM. 2021;83:1195-202.
- Sternheim D, et al. Myocardial bridging: diagnosis, functional assessment, and management: JACC stateof- the-art review. J Am Coll Cardiol. 2021;78:2196-212.
- Matsumoto H, et al. Effect of caffeine on intravenous adenosine-induced hyperemia in fractional flow reserve measurement. J Invasive Cardiol. 2014;26:580-5.
- Nagueh SF, et al. Recommendations for the evaluation of left ventricular diastolic function by echocardiography. EUR J ECHOCARDIOGR. 2009;10:165-93.
- Manouras A, Shahgaldi K, Winter R, Nowak J, Brodin LA. Comparison between colour-coded and spectral tissue Doppler measurements of systolic and diastolic myocardial velocities: effect of temporal filtering and offline gain setting. Eur J Echocardiogr. 2009;10:406-13.
- Stan ton T, Leano R, Marwick TH. Prediction of all-cause mortality from global longitudinal speckle strain: comparison with ejection fraction and wall motion scoring. Circ Cardiovasc Imaging2009;2:356–64.
- Henzlova MJ, et al. ASNC imaging guidelines for SPECT nuclear cardiology procedures: Stress, protocols, and tracers. J Nucl Cardiol. 2016;23:606-39.
- Hoffmann S, et al. Tissue Doppler echocardiography improves the diagnosis of coronary artery stenosis in stable angina pectoris. Eur Heart J Cardiovasc Imaging. 2012;13:724-9.
- Mochula A, et al. The Influence of Kinetic Models and Attenuation Correction on Cadmium–Zinc–Telluride Single-Photon Emission Computed Tomography (CZT SPECT)-Derived Myocardial Blood Flow and Reserve: Correlation with Invasive Angiography Data. Journal of Clinical Medicine. 2024;13:1271.
- Acar E, et al. The pulmonary annular motion velocity assessed using tissue Doppler imaging could predict the proximal right coronary artery occlusion in patients with inferior myocardial infarction. Dicle Tıp Dergisi. 2021;48:431-8.
- Labombarda F, et al. Evaluation of Transthoracic Echocardiography in the Assessment of Atherosclerosis of the Left Main Coronary Artery: Comparison with Optical Frequency Domain Imaging (a Pilot Study). J Clin Med. 2021;10:256-72.
- Imamura S, et al. Assessment of myocardial damage after acute myocardial infarction by diastolic deceleration time of coronary flow velocity using echocardiography and contrast‐enhanced magnetic resonance imaging. J Echocardiogr. 2020;37:1981-8.
- Chen S, Chen X, Zheng B. Diagnostic usefulness of quantitative tissue velocity imaging and anatomic M‐mode echocardiography for coronary artery diseases: A pilot study. Journal of Clinical Ultrasound. 2015; 43:346-52.
- Wang J, et al. Diagnostic efficiency of quantification of myocardial blood flow and coronary flow reserve with CZT dynamic SPECT imaging for patients with suspected coronary artery disease: a comparative study with traditional semi-quantitative evaluation. J CDT. 2021;11:56-66.
- El Hajj SC, et al. Correlation of intravascular ultrasound and instantaneous wave-free ratio in patients with intermediate left main coronary artery disease. Circ Cardiovasc Interv. 2021;14:10-7.
- Pang Z, et al. Diagnostic analysis of new quantitative parameters of low-dose dynamic myocardial perfusion imaging with CZT SPECT in the detection of suspected or known coronary artery disease. Int J Cardiovasc Imaging. 2021 Jan;37(1):367-378.
- de Winter RW, et al. Hemodynamic Insights into Combined Fractional Flow Reserve and Instantaneous Wave-Free Ratio Assessment Through Quantitative [15O]H2O PET Myocardial Perfusion Imaging. Journal of nuclear medicine. 2024 Feb 10;65(2):279-286.
