Evaluation of H- and G-indices of Scientific Authors using Modified K-Means Clustering Algorithm

Author: S. Govinda Rao, A. Govardhan
Journal: International Journal of Information Technology and Computer Science(IJITCS) @ijitcs
Article in issue: 2 Vol. 8, 2016.
Free access
In this paper I proposed modified K-means algorithm as the means to assess scientific authors performance by using their h,g-indices values. K-means suffers from poor computational scaling and efficiency as the number of clusters has to be supplied by the user. In this work, I introduce a modification of K-means algorithm that efficiently searches the data to cluster points by compute the sum of squares within each cluster which makes the program to select the most promising subset of classes for clustering. The proposed algorithm was tested on IRIS and ZOO data sets as well as on our local dataset comprising of h- and g-indices, which are the prominent markers for scientific excellence of authors publishing papers in various national and international journals. Results from analyses reveal that the modified k-means algorithm is much faster and outperforms the conventional algorithm in terms of clustering performance, measured by the data discrepancy factor.
Modified k-means clustering, h-index, g-index
Short address: https://sciup.org/15012434
IDR: 15012434
Text of the scientific article Evaluation of H- and G-indices of Scientific Authors using Modified K-Means Clustering Algorithm
Published Online February 2016 in MECS DOI: 10.5815/ijitcs.2016.02.06
The existence of journals to publish scientific research or reviews on a specified topic has been in place since many years, which raised the alarm to build databases to disseminate literature information to everyone [1]. The number of papers published in journals that have been increased from many years and that can be affiliated on account of their citations by scientists worldwide. The constant and increased volume of scientific literature and the assortment of inter-disciplinary fields of science have created wealth of knowledge useful to many scientists [23] which intend to solve many problems. At the same time, the scientific field has also seen a gradual increase in the number of open access journals that publish specific streams of study [4-5]. The best possible way to evaluate any journal is to follow the number of citations with respect to the number of papers published in a year, which is referred as Impact Factor [6]. Similarly, considering the importance of authorship of any work being cited by other works, h-index has been introduced by Hirsch [7]. This h-index evaluates the score generated from the papers published by the specific author as well as the number of papers published since the first publication [8]. However, h-index does not consider the specific field of work, for instance, an author might publish papers on ‘text mining’, ‘computer architecture’, ‘networking methods’ etc. In such case, h-index is given for all papers published by the author but not related to a specific field [9]. The h index is mostly used to measure the scientific achievement for individual researchers, and also to measure the scientific output of research groups in order to give more weight age to highly cited articles. Leo Egghe says the g-index [10].
K-means clustering is an iterative clustering procedure and it works as a greedy algorithm for partitioning the n samples into k clusters and predefines the number of clusters. The algorithm begins by defining centroids, which are points in the dataset that eventually appear at the center of each cluster. A very common task in data analysis is that of grouping a set of objects into subsets such that all elements within a group are more similar among them than they are to the others. K-means suffers from poor computational scaling and efficiency as the number of clusters has to be supplied by the user. Therefore, the primary objective of this study is to calculate h- and g-indices of authors and cluster them using modified K-means algorithm and compare the efficiency with conventional k-means clustering algorithm [10]. Hence, in this paper, we introduce a modification of K-means algorithm that efficiently searches data to cluster points by compute the sum of squares within each cluster, which makes the program to select the most promising subset of classes for clustering. The h- and g- indices of few authors who have published scientific papers of excellence in the fields of computer science [11] are segregated. In order to collect and calculate manually, a reliable tool from Google Scholar [12] was used to perform the task. Google Chrome has developed an intuitive H-index calculator add-on to Chrome browser.
-
II. Materials And Methods
H- and g-indices: The h- and g- indices of few authors who have published scientific papers of excellence in the fields of computer science are segregated. In order to collect and calculate manually, which is a more tedious process than expected; a more reliable tool from Google Chrome was used to perform the task. Google Chrome has developed an intuitive H-index calculator add-on Table 1.
In the table1 it consists of h and g indices of the particular authors these indices can be used to evaluate author’s performers. The modified K Means algorithm can be applied on h g indices data set to partition the clusters
Table 1. Index Values Computed by the Calculator
Impact indices (computed on displayed results only)
|
Normalization |
Citations h-index g-index e-index delta-h Delta-g |
|
None |
202 8 10 5 6 4 |
|
Per coauthorship |
96.1 4 6 4 2.5 5 |
|
Per age |
45.5 2 3 2 0.3 0.8 Data on video might not be enough of computing indices values. |
Both the h- and g-indices are consequence to some scope by the number of papers published in a journal. A journal that publishes a larger number of papers has a higher possibility to make a higher h- and g-indices since every article presents another chance for citations [16]. The value for the indices depends on the range of papers being examined, and how comprehensively the citations for each have been indexed. The main intensity of the h-index is that it measures quantity and impact by the means of single indicator. Egghe [13, 16] says g-index is “the higher rank, such that the top g papers have at least g2 citations. It also means, that the top g + 1 have less than (g + 1)2 papers”. The g-index is always greater than or equal to h-index.
Data sets: Iris is a set of total 150 data, each having four attributes, such as ‘septal’ length and breadth and ‘pedal’ length and breadth [14]. The dataset is divided into three class labels (e.g., iris setosa; iris versicolor; and iris verginica) each having equal data distributions, i.e., first 50 belongs to iris
Parameters to measure the clustering performance
Data discrepancy factor (DDF): Data discrepancy is measured by noting the positional discrepancies among the data points during clustering. It is computed by adding the number of (i) ‘wrong’ data points grouped inside (WI), (ii) the ‘correct’ data points lying outside (WO) of any kth cluster and (iii) number of data points, which could not be clustered i.e. the outliers (OL) when matched with the representative data (Ck). Finally, it is expressed as a percentage of the total number of data points (N). Ideally, the DDF must be 0%, i.e. all the data points are clustered as it should be and there is nil outlier. Its significance is to evaluate the ‘under’ and ‘over’ fitting of the data. An example of DDF computation is given
DDF = ^1 [ ( WI + WO + OL ) ] x100 (1)
Computational time: The computational time, that is, an average user time values of original versus modified K-Means algorithm have been compared while carrying out clustering of the three datasets used in the study in a Core i3, 64-bit operating system with 4GB RAM and 2.2 GHz processor.
-
III. Results And Discussion
K-means suffers from drawback on the number of clusters k as an input parameter. This is because of an inappropriate choice of k which might yield spurious results. Hence, it is always an important task to run diagnostic checks when using k-means clustering to resolve the number of clusters in the given dataset. Moreover, applying k-means value with values ranging from k=2, 3, 4 or 5 depends on the number of objects in the dataset and to avoid expected clusters of similar size, so that the assignment of objects to the nearest cluster center or centroid will result in correct clusters.
Algorithm: K-Means:
-
1. Initialization: choose k initial centroids arbitrarily (or randomly).
-
2. Assign each data point to the centroid that is closer to it.
-
3. Compute the distance between the centroids and objects using the Euclidean Distance equation
-
4. Update all the centroids and the new centroid of a cluster is the mean of all the points within that cluster.
-
5. Repeat points 2 and 3 until the new centroids are the same as the previous centroids.
Clustering by k-means algorithm will result in different runs each time the program is run. Though the difference is negligible, it should be noted that the cluster assignments change slightly for each time the algorithm is run. This is because k-means tries to find the locally optimal solution, but not a globally optimal one. Hence, the k-means algorithm was ran more number of times to realize a consistently optimal solution.
But the problem still exists, in the form of choosing the best solution among two clustering solutions? Hence, a modified k-means algorithm was presented where a metric was used to calculate the sum of squares within-cluster to choose the best one. The sum of squares within the cluster represents the sum of all distances between each data point and the centroid of its cluster. The smaller the value, the more compact and good is the cluster. Therefore, for a given dataset, clusters with the smaller sum of squares within a cluster are regarded as generally better. The time required to perform both the algorithms are reported.
Modified K-Means Algorithm:
-
1. Initialization: choose k initial centroids arbitrarily (or randomly).
-
2. Assign each data point to the centroid that is closer to it.
-
3. Compute the distance between the centroids and objects using the Euclidean Distance equation
-
4. Update all the centroids and the new centroid of a cluster is the mean of all the points within that cluster.
-
5. Compute the sum of squares within-cluster to obtain a distance value between each data point and the centroid of its cluster.
-
6. Repeat k-means clustering n times (n=5) and return the clustering with the smallest sum of squares within-cluster.
-
7. Update the centroids.
-
8. Stop the process when new centroids are sameas the previous centroids. Otherwise, go to step 3.
Clustering performance on IRIS dataset
Data discrepancy factor (DDF): An attempt was made to test the performance of modified K-means algorithm, while carrying out clustering on IRIS [10] and h-index and g indexes. Both IRIS as well as h and g indices datasets is ideally clustered into their respective groups. The results are given in tables 3 and4.
One of the cluster qualities measures is the DDF computation. It is calculated using an equation given above. DDF is the most important measure amongst all other measures to judge the performance of any clustering technique. Conventionally, good clustering is assessed by counting total number of data points within a cluster. If the number equals to the number of desired data points and the cluster is said to be perfect [15]. The goodness of the clustering techniques must not be judged based on only the data count inside a cluster alone the goodness of a cluster must be tested by summing up the data points which are (i) present within a cluster where it should not be and vice versa and (ii) not clustered i.e. outliers (OL). From tables 3 and 4, it is evidenced that modified k-means algorithm presented in this paper performed well than normal algorithm.
Computational Time: Performance of the modified K-means algorithm was assessed by computing the time taken to complete the run using IRIS and h-g indices datasets. The results are summarized in tables 2and 5
Table 2. Computational Time Evaluation of Regular and Modified K-Means Algorithm.
|
Dataset |
K-means original (Run time in secs) |
Modified K-means (Run time in secs) |
|
IRIS |
Run1: 5.82 Run2: 5.66 Run3: 5.64 |
Run1: 3.49 Run2: 3.30 Run3: 3.47 |
|
h-g indices |
Run1: 15.21 Run2: 14.25 Run3: 15.22 |
Run1: 0.40 Run2: 0.37 Run3:0.37 |
Table 3. DDF calculation on IRIS Dataset using K-means Algorithm.
|
# Cluster |
Data Points |
Target |
Observed |
# Wrong data points |
OL |
Proposed DDF (%) |
Conventional DDF (%) |
|
1 |
1-50 |
50 |
61 |
14 |
0 |
{14+0+3+1/150}*100 = 12% |
11+1+11+1/150}*100 = 16% |
|
2 |
51-100 |
50 |
49 |
0 |
1 |
||
|
3 |
101-150 |
50 |
39 |
3 |
0 |
Table 4. DDF Calculation on IRIS Dataset using Modified K-means Algorithm.
|
# Cluster |
Data Points |
Target |
Observed |
# Wrong data points |
OL |
Proposed DDF (%) |
Conventional DDF (%) |
|
1 |
1-50 |
50 |
49 |
0 |
1 |
{0+14+2+1/150}*100 = 11.33% |
1+12+12+1/150}*100 = 17.33% |
Table 5. Comparison of Time Complexity of K-Means original and Modified Algorithm While A Varying Number of Clusters.
|
Dataset |
No. of clusters |
K-means original (Run time in secs) |
Modified K-means (Run time in secs) |
|
IRIS |
1 |
2.44 |
2.81 |
|
2 |
3.52 |
3.06 |
|
|
3 |
6.63 |
3.30 |
|
|
4 |
7.70 |
3.72 |
|
|
5 |
8.84 |
4.11 |
|
|
H-G indices |
1 |
2.10 |
0.12 |
|
2 |
6.16 |
0.16 |
|
|
3 |
15.21 |
0.37 |
|
|
4 |
16.20 |
0.39 |
|
|
5 |
16.22 |
0.36 |
Time Complexity Analysis of IRIS dataset
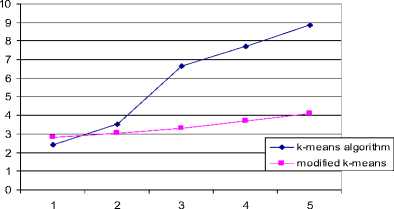
No. of Clusters
Fig.1. An Image Showing Time Complexity Analysis of Iris Dataset
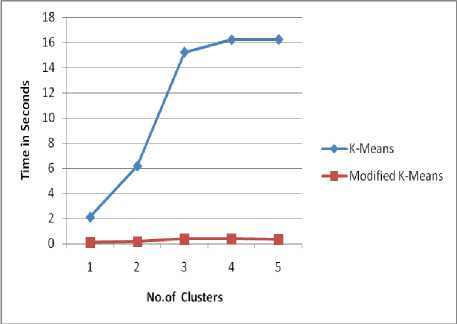
Fig.2. An Image Showing Time Complexity Analysis of H And G Indices Data
-
IV. Conclusion
K-means is one of the easiest un-supervised learning algorithms that resolve the notorious clustering algorithm. The program classifies given dataset into predefined k clusters corresponding to the centroids. Considering the importance of h- and g-indices for each author as a parameter to assess the quality of published papers in various journals, a modified k-means algorithm was implemented to the quality of published papers in various journals, a modified k-means algorithm was implemented to study the objects used. Analysis revealed that the modified k-means algorithm is much faster and outperforms the conventional algorithm both in terms of computational time and clustering performance, measured by data discrepancy factor.
References Evaluation of H- and G-indices of Scientific Authors using Modified K-Means Clustering Algorithm
- Http://www.sagepub.com/upm-data/29986_Chapter3.pdf.
- G Charles Babu and Dr. A.GOVARDHAN, “Mining Scientific Data from Pub-Med Database” International Journal of Advanced Computer Science and Applications (IJACSA), 3(4), 2012.
- Richard Van Noorden (2013). Open access: The true cost of science publishing. Nature 495, 426–429.
- Solomon, D. J. & Bj?rk, B.-C. J. Am. Soc. Inf. Sci. Technol. 63, 1485–1495.
- Jerry A. Jacobs and Scott Frickel. Interdisciplinarity: A Critical Assessment. Annual Review of Sociology, 35: 43 -65 (2009)
- http://en.wikipedia.org/wiki/Impact_factor.
- Hirsch, J. E. (2005). "An index to quantify an individual's scientific research output". PNAS 102 (46): 16569–16572.
- Jacso, P. (2008b). The pros and cons of computing the h-index using Google Scholar. Online Information Review, 32(3), 437–452.
- Jin, B. (2006). h-Index: An evaluation indicator proposed by scientist. Science Focus, 1(1), 8–9.
- J. B. MacQueen (1967): "Some Methods for classification and Analysis of Multivariate Observations, Proceedings of 5-th Berkeley Symposium on Mathematical Statistics and Probability", Berkeley, University of California Press, 1:281-297.
- S. Alonso, F.J. Cabrerizo, E. Herrera-Viedma, F. Herrera (2009). h-Index: A review focused in its variants, computation and standardization for different scienti?c ?elds. Journal of Informetrics 3: 273–289.
- Google Scholar. (online resource). http://scholar.google.com/.
- EGGHE, L. (2006), Theory and practise of the g-index. Scientometrics, 69 (1): 131–152.
- Fisher R. A. (1936), The use of multiple measurements in taxonomic problems., Annals of Eugenics, Vol. 7, pp. 179-188.
- Panda S., Sahu S., Jena P.K., Chattopadhyay S. (2012), Comparing Fuzzy-C means and -means Clustering Techniques: a Comprehensive Study. In Proceedings of 2ndInternational Conference on Computer Science, Engineering & Applications, by D.C. Wyld, J. Zizka, D. Nagamalai (Eds.), Advances in Intelligent and Soft Computing (AISC) Vol. 166, pp. 451-460. DOI: 10.1007/978-3-642-30157.
- S Govinda Rao, Dr A Govardhan. “Assessing h- and g- indices of scientific papers using k-means clustering” International Journal of Computer Applications(0975-8887), Vol.100-No.11,August 2014.
