Evaluation of left ventricular function after revascularization of coronary chronic total occlusion using speckle tracking echocardiography

Author: Abdelmoneum Mahmoud Shawky, Sabry Ahmed Mahmoud, Anis Antoine Saad, Mansour Heba Abdel Kader
Journal: Cardiometry @cardiometry
Section: Original research
Article in issue: 25, 2022.
Free access
Objective: This study evaluated the role of two-dimensional speckle tracking echocardiography (2D-STE) in evaluation of the LV systolic function in patients had CTO of LAD at 1 day as well as at 3 months after revascularization Methodology: This prospective observational study included 100 patients diagnosed by coronary angiography to have a chronic complete occlusion of the left anterior descending artery. Percutaneous coronary intervention (PCI) was performed. When the residual stenosis was less than 30% of the intraluminal diameter and thrombolysis in myocardial infarction (TIMI) grade III flow was achieved without any major complications, the operation was considered a success. Using speckle tracking echocardiography was to measure global longitudinal strain and left ventricular functions. Follow up of patients was done at day 1 and 3 months later after PCI. Results: Global longitudinal strain (GLS) and wall motion score index (WMAI) difference at baseline and follow up shows a positive correlation with left ventricular ejection fraction (LVEF) changes at baseline and follow up (p˂0.001). Mean baseline left ventricular end systolic volume (LVESV) was 58.22±11.65 and follow-up LVESV was 50.60±14.07 with statistical difference (p=0.047). Mean value of baseline GLS (-14.26±0.93) and follow-up GLS was (-15.66±0.92) (p˂0.001). Periprocedural com-plications were contrast induced nephropathy in 3 %, cardiac tamponade 1 % and Emergency re PCI 1 % Conclusion: Revascularization via PCI to CTO of LAD can improve LV function. These results of the study provide ev
Chronic total occlusion, left ventricular ejection fraction, coronary intervention, speckle tracking
Short address: https://sciup.org/148326336
IDR: 148326336 | DOI: 10.18137/cardiometry.2022.25.5159
Text of the scientific article Evaluation of left ventricular function after revascularization of coronary chronic total occlusion using speckle tracking echocardiography
Mahmoud Shawky Abdelmoneum, Ahmed Mahmoud Sabry, Antoine Saad Anis, Heba Abdel Kader Mansour. Evaluation of Left Ventricular Function after Revascularization of Coronary Chronic Total Occlusion using Speckle Tracking Echocardiography. Cardiometry; Special issue No. 25; December 2022; p. 5159; DOI: 10.18137/cardiometry.2022.25.5159; Available from:
Chronic total occlusion (CTO) is a common finding in patients with coronary artery disease and is one of the most challenging targets of lesion recanalization for percutaneous coronary interventions (PCIs). [1] CTO is defined as the complete occlusion of a coronary artery, exhibiting TIMI 0 or TIMI 1 flow, with an occlusion duration of more than three months. The rationale for the revascularization of a coronary CTO is the possible improvement of left ventricular (LV) function via the recovery of hibernating myocardium. Revascularization of CTO lesions by PCI reportedly lead to beneficial effects on symptoms, long-term survival, and incidence of coronary artery bypass grafting (CABG). However, mechanism of the beneficial effects of revascularization of CTO needs more studies and still remains unclear. An angle-independent assessment of myocardial strain is possible using two-dimensional speckle tracking echocardiography (2D-STE), which also gives in-depth knowledge of left ventricular (LV) myocardial contractility. That’s why 2D-STE is the gold standard for detecting subtle deteriorations of contractility. These advantages of 2D-STE are useful for the detection of subclinical recovery of dysfunctional but viable myocardium after revascularization of CTO - LAD. [2]
Methodology
This prospective study included 100 patients and was conducted over 1 year period from December
Issue 25. December 2022 | Cardiometry | 51
2020 and December 2021 and was performed in Cardiology Departments at Benha university Hospital and Maadi Military Hospital . All patients who had ischemic heart disease and diagnosed with coronary angiography as having chronic total occlusion of LAD vessel. Informed consent was taken from patients after full explanation of the purpose and nature of the study.
A chronic total occlusion (CTO) is defined as the complete occlusion of a coronary artery, with an occlusion duration of more than three months. Patients with CTO with an estimated duration of less than 3 months or an MI during the previous 30 days, patients had chronic kidney disease, Patients who has CTO of coronaries other than LAD, Patients with lost follow up, Patients with non viable myocardium at the territory of LAD and patients who had CABG were excluded from the study. All patients included in the study were subjected to full medical history evaluation with special focus on history of Diabetes melli-tus (DM), Hypertension, dyslipidemia and Cigarette smoking.Clinical examination on admission with special focus on heart rate and rhythm, Systolic and diastolic blood pressures at the time of the study. 12-lead resting surface electrocardiogram was done to all patients. Laboratory evaluation with special focus on Creatine phosphokinase (CK), Creatine phosphoki-nase-myoglobin binding CK-MB and Troponin, Lipid profile, and Kidney function tests.
Conventional echocardiography examination was performed by an investigator according to the American Society of Echocardiography (ASE). [3] Two dimensional transthoracic echocardiographic and Doppler studies evaluation was performed before discharge. Imaging was performed using 2.5MHz comprehensive two-dimensional cardiac ultrasound unit equipment; LV dimensions were measured with M-mode from the parasternal projections. Measurements included Intraventricular Septal thickness, posterior wall thickness, LV diameter in end-systole and end-diastole. LV relative wall thickness (RWT) was calculated as (Intraventricular Septal thickness + posterior wall thick-ness)/LV diameter in end diastole. M-mode, 2-dimensional, and Doppler images were acquired during breath hold. Systolic LV function was assessed by tracing the LV end-systolic volume and end-diastolic volume in the apical 4- and 2-chamber views. LV ejection fraction (LVEF) was calculated by using the biplane Simpson’s method. [3] Each patient’s Wall Motion Score Index (WMSI) was recorded as follows: 1 for normal,
-
2 for hypokinesia, 3 for akinesia, and 4 for dyskinesia. We were able to calculate the overall wall motion score by adding up the scores of all of the individual segments (WMS). By dividing the total score for wall motion by 16, we were able to calculate the wall motion severity index. [4]
Percutaneous coronary revascularization was performed by highly experienced operators in the treatment of CTO according to their standard practices via the femoral approach. The operation was considered successful when the residual stenosis was ≤30% of the intraluminal diameter, with TIMI grade III flow and no in hospital complications (death, acute myocardial infarction, or emergency coronary surgery). Dual antiplatelet therapy (DAPT) was prescribed to all patients for at least 1 year after LAD stenting . PCI was done through antegrade technique: Antegrade wire escalation technique (AWE) was done via drilling using pilot, Gaia, Fielder and miracle group of wires. AWE either done by sliding technique with Fielder group of wires or penetrating technique with ASAHI conquest and conquest pro wires. Antegrade dissection reentry was done with pilot and miracle wires.
Speckle tracking echocardiography was done according to the American Society of Echocardiography (ASE). Strain is defined as the percentage change in the original dimensions of an item, strain rate (SR) defined as the speed at which deformation occurs. [5] SR is calculated from the difference in velocities in two myocardial sites (v1 and v2) and divided by the distance (D) between them. When applied to left ventricle, left ventricular deformation can be defined by the three normal strains (longitudinal, circumferential, and radial). Using (2D-STE) was to measure global longitudinal strain .The percentage of the LVEF was calculated by Simpson’s biplane method of discs. The 2D echocardiography images were obtained from multiple views with frame rates of 30–90 frames/s. Digital data were stored and analyzed off-line. LV endocardial surface was traced manually, and the speckle tracking width was modified to cover the whole LV wall thickness so as to obtain curves for the peak longitudinal strain (PLS) of: the inferior septum and lateral wall in the apical four-chamber view (4C-PLS); the inferior and anterior walls in the apical two-chamber view (2C-PLS); and The inferior lateral and anterior septum in the apical three-chamber view (3C-PLS). LV global longitudinal systolic strain (GLS) was calculated by averaging the peak systolic values of the six LV walls.
All the echocardiographic studies were performed by one echocardiographer. Follow-up of patients was done at day 1 and 3 months later after PCI.
Ethics: Official permission was obtained from the Faculty of Medicine, Benha University, and Maadi military hospital. Approval from the ethical committee in the faculty of medicine (Institutional Research Board IRB).
Statistics: When applicable, data was statistically characterized using measures such as range, mean SD, median, number of instances, and percentages. The independent-samples Mann-Whitney U-test was used to compare quantitative variables between the research groups. The Chi square (2) test was used to compare the two sets of category variables. When the anticipated frequency was less than 5, an exact test was applied instead. To find optimal thresholds, ROC curves were produced. Since these were not normally distributed variables, we used the Spearman rank correlation equation to determine the degree of association between them. Values of probability (p values) lower than 0.05 were regarded to be statistically significant. Microsoft Excel 2010 (Microsoft Corporation, New York, USA) and SPSS (Statistical Package for the Social Science) version 15 (SPSS Inc., Chicago, Illinois, USA) were used to compile all statistical data and results.
Results
General characteristics in both groups
The research comprised 100 patients, whose ages varied from 47 to 79 (with a mean of (58.55±7.98). The group consisted of 82% men and 18% women. Every patient had at least one risk factor, with diabetes being the most common (55.5%), followed by hypertension (53%), and smoking (52%). Patients had mean values of (184.85± 56.50), (54.1 ±11.66), (132.25± 22.17), and (193.07± 81.36) mg/dl for cholesterol, high density lipoprotein (HDL), low density lipoprotein (LDL), and triglycerides (TG), respectively, according to their lipid profiles. At follow-up, the patients’ mean creatinine levels were 0.90 ±0.24, and they were using the same medications as before. (Table I)
Characteristics of angiographic data
Most lesions were found in two vessels (51%) followed by lesions in several vessels (26%) and a single vessel (23%). The LAD artery was completely blocked in every instance. The average J-CTO score in CTO
Table (I)
Baseline Characteristics of Study Patients
|
Baseline Characteristics of Study Patients |
n (%) |
Mean ±SD |
|
Age (years) |
58.55±7.98 |
|
|
Body Mass Index (BMI) |
30.09±2.73 |
|
|
Male |
(82 %) |
|
|
Female |
(18 %) |
|
|
Risk factors for CAD |
||
|
Smoking |
(52 %) |
|
|
Dyslipidemia |
(48 %) |
|
|
DM |
(55%) |
|
|
Hypertension |
(53 %) |
|
|
family history |
(22 %) |
|
|
Past history of CAD |
(25%) |
|
|
Canadian Cardiovascular classification score (CCS) |
||
|
CCS ≥2 |
(61 %) |
|
|
Medications |
||
|
Aspirin |
(100%) |
|
|
Clopidogrel |
(75%) |
|
|
Beta Blockers |
(87 %) |
|
|
Calcium Chanel Blockers |
(8 %) |
|
|
ACEI or ARBS |
(90%) |
|
|
Statins |
(84 %) |
|
|
Laboratory investigation |
||
|
Total cholesterol (mg/dl) |
184.85±56.50 |
|
|
HDL (mg/dl) |
54.1±11.66 |
|
|
LDL (mg/dl) |
132.25±22.17 |
|
|
TG (mg/dl) |
193.07±81.36 |
|
|
Creatinine (mg/dl) |
0.90±0.24 |
|
ACEI, Angiotensin converting enzyme inhibitors; ARBs, Angiotensin receptor blockers; CAD, Coronary artery disease; CCS, Canadian cardiovascular classification score; DM, Diabetes mel-litus; HDL, High density lipoprotein; LDL, Low density lipoprotein; TG, Triglycerides vessels was 1.77±1.02. Antegrade wire escalation (AWE) was used in 87 cases, while antegrade dissection and reentry (ADR) was used in 13 cases. Time spent performing procedures averaged 77.2±5 18.22 minutes. (Table II)
Clinical follow up of patients after 3 monthes
Continuing care for patients in the clinic after 3 months, 8 patients were readmitted to the hospital for treatment of chest discomfort that had not been caused by any new angiographic abnormalities. Paroxysmal atrial fibrillation was found in 3 individuals, and one patient showed symptoms of heart failure. Pa-
Issue 25. December 2022 | Cardiometry | 53
Table (II)
Characteristics of angiographic data
|
Characteristics of angiographic data |
% |
|
Single vessel n (%) 2 vessels n (%) Multivessels |
(23%) (51%) (26 %) |
|
CTO vessel LAD n (%) |
(100 %) |
|
J-CTO score mean±SD |
1.77±1.02 |
|
Antegrade approach only n (%) Antegrade wire escalation (AWE) n(%) Antegrade Dissection and Reentry (ADR) n(%) |
(100%) (87 %) (13 %) |
|
Procedure time (minutes) mean ± SD |
77.25±18.22 |
ADR, Antegrade dissedction and reentery; AWE, Antegrade wire escalation; CTO, Chronic total occlusion;:LAD, Left anterior descending .
tients in the study did not suffer from any major adverse events such as MI, stroke, or death. (Table III) Table (III)
clinical follow-up after 3-months follow-up across groups
|
Clinical follow-up |
n=40 |
% |
|
Readmission for ACS |
8 |
8% |
|
Arrythmias |
3 |
3% |
|
Heart failure |
1 |
1% |
|
Stroke/TIA |
0 |
0 |
|
New Myocardial Infarction |
0 |
0 |
|
Cardiac mortality |
0 |
0 |
ACS, acute coronary syndrome; TIA, transient ischemic attack
Conventional echocardiography parameters at pre – procedural, day 1 and after 3 months follow up
The outcomes of the echocardiographic examination showed that the pre-procedural mean LVEDV was 104±32.17 and the day 1 post-procedural mean LVEDV was 105±38.85, with no significant difference between the two results. Although there was no significant difference between the pre-procedural mean LVESV of 61.52±15.14 and the day 1 post-procedural mean LVESV of 58.22±11.65.
Results demonstrate no significant change between the pre- and post-procedural mean LVED-Vs (105±38.85 and 104±32.17, respectively) after 3 months. The average LVESV before the procedure was 61.52±15.14, while after treatment was just 50.60±14.07, a significant drop (p=0.047).
There was a statistically significant difference (p0.001) between the pre-procedural WMSI mean value of (1.48±0.31) and 3 months post-procedural WMSI mean value of (1.20±0.13). The average EF 54 | Cardiometry | Issue 25. December 2022
before the procedure was 53.8814.30%, and after the procedure it was 55.548.19%, with no statistically significant difference between the two. (Table IV & V) Table (IV)
|
Variables |
Preprocedural |
Day 1 |
P-value |
|
Mean±SD |
Mean±SD |
||
|
LVEF, % |
53.88±14.30 |
54.85±7.63 |
0.12 |
|
LVEDV, ml |
104±32.17 |
105±38.85 |
0.46 |
|
LVESV, ml |
61.52±15.14 |
58.22±11.65 |
0.32 |
|
WMSI |
1.48±0.31 |
1.41±0.17 |
0.11 |
EDV, end-diastolic volume; ESV, end-systolic volume; LVEF, left ventricular ejection fraction; WMSI, wall motion score index.
Table (V)
|
Variables |
Preprocedural |
3 months follow-up |
P-value |
|
Mean±SD |
Mean±SD |
||
|
LVEF, % |
53.88±14.30 |
55.54±8.19 |
0.76 |
|
LVEDV, ml |
104±32.17 |
101±45.22 |
0.18 |
|
LVESV, ml |
61.52±15.14 |
50.60±14.07 |
0.047 |
|
WMSI |
1.48±0.31 |
1.20±0.13 |
˂0.001* |
EDV, end-diastolic volume; ESV, end-systolic volume; LVEF, left ventricular ejection fraction; WMSI, wall motion score index.
Global longitudinal strain parameters at pre – procedural, day 1 and after 3 months follow up
There was a statistically significant difference (p0.001) between the pre-procedure and 3 months post-procedure GLS means (-14.22±0.91 and -18.66±0.92) (Table VI)
Table (VI)
GLS at preprocedural, day 1 and 3 monthes follow up
|
Variable |
Pre- procedural |
Day1 Mean±SD |
P-value |
3 mon-thes Mean±SD |
P-value |
|
GGLS |
-14.22±0.91 |
-14.26±0.93 |
0.39 |
-18.66±0.92 |
˂0.001* |
GLS, global longitudinal strain
Correlations between changes in LVEF by echocardiographic parameters and JCTO score, changes in GLS and WMA
The difference in GLS and WMAI between baseline and follow-up demonstrates a positive association with the changes in LVEF that occurred between baseline and follow-up, and this correlation is supported by a significant statistical difference (p 0.001). (Table VII), figure (1, 2)
Table (VII)
Correlations between changes in LVEF by echocardiographic parameters and JCTO score, changes in GLS and WMA
|
Variable |
R |
p-Value |
|
Difference GLS |
0.496 |
0.001* |
|
WMA difference |
0.599 |
˂0.001* |
GLS, global longitudinal strain; LVEF, left ventricular ejection fraction; WMA, wall motion abnormality.
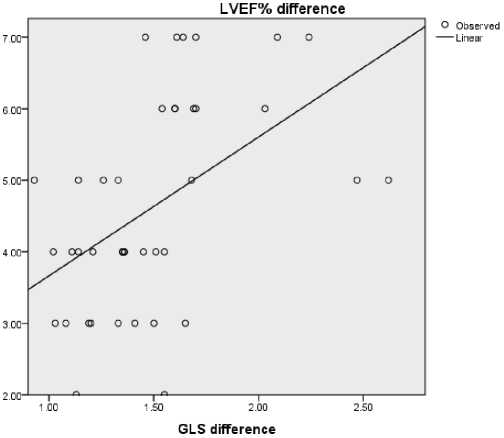
Figure (1):Correlations between changes in LVEF by echocardiographic parameters and JCTO score, changes in GLS.
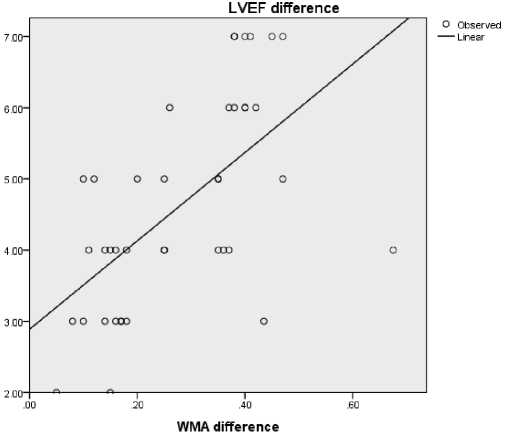
Figure (2):Correlations between changes in LVEF by echocardiographic parameters and JCTO score, changes in WMSI.
Roc curve for GLS and WMSI difference to predict improved LVEF
Left ventricular ejection fraction (LVEF) improvement was used to produce the ROC curve (figures 3 and 4), which shows the accuracy of the GLS difference as a predictor. Confidence interval (CI) and area under the curve (AUC) were 82%. (0.677- 0.962). With a sensitivity of 95%, specificity of 40.7%, and a statistical significance of 0.001, the optimum cut off value of GLS for predicting improved left ventricular EF was 1.025. We determined the ROC curve for the difference in WMSI scores to predict better left ventricular ejection fraction. The AUC and CI were both 79%. (0.638 – 0.941). Table 6 shows that a GLS cutoff value of 0.10% (sensitivity = 100%, specificity = 55%) and (P=0.002) is optimum for predicting enhanced left ventricular ejection fraction. (Table VIII)
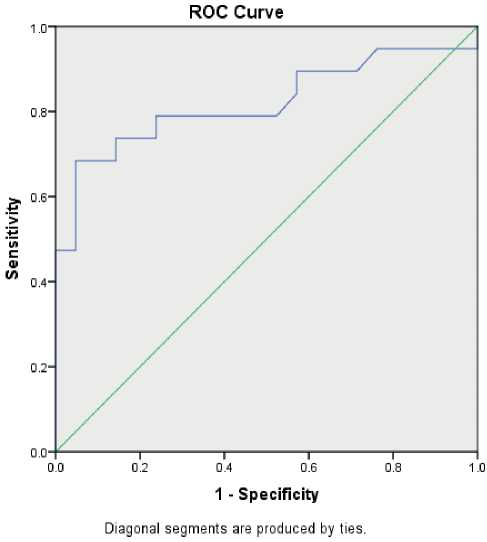
Figure (3): Roc curve for GLS difference to predict improved left ventricular EF
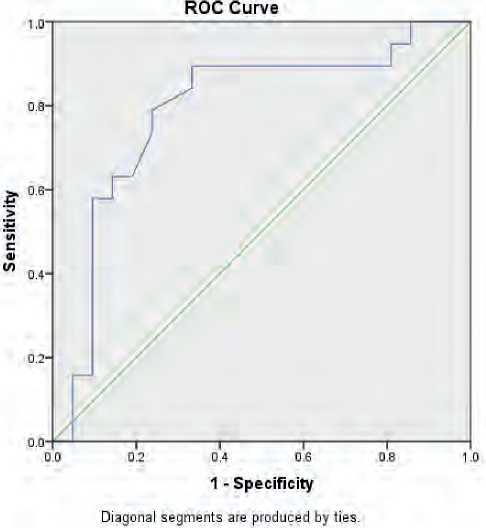
Figure (4): Roc curve for WMSI difference to predict improved left ventricular EF
Table (VIII)
Roc curve for GLS and WMSI difference to predict improved left ventricular EF
|
Variable |
AUC |
CI 95% |
Cutoff |
Sensitivity |
Specificity |
P-val-ue |
|
GLS |
0.82 |
0.677- 0.962 |
1.025 |
95% |
40.7% |
0.001* |
|
WMSI |
0.79 |
0.638 – 0.941 |
0.10 |
100% |
55% |
0.002* |
AUC, area under curve; GLS, global longitudinal strain; WMSI, wall motion score index.
Peri-procedural Complications
Periprocedural complications were contrast induced nephropathy in (3%), Cardiac tamponade (1%) and Emergency re-PCI (1%). (Table IX)
Table (IX)
Peri-procedural Complications
|
Peri-procedural Complications |
% |
|
Cadiac tamponade n (%) |
(1%) |
|
Emergency re-PCI n (%) |
(1%) |
|
Contrast induced nephropathy n (%) |
(3%) |
PCI, percutaneous coronary intervention
Discussion
Ischemia is the cause of decreased ventricular relaxation and diastolic dysfunction, which followed by reduced systolic function. This sequence of events is the outcome of a chain reaction that starts with metabolic and biochemical changes. A temporary impairment in ventricular relaxation is brought on by ischaemia. Even in cases when there are coronary collaterals present, the majority of patients who have a CTO still have some degree of LV dysfunction. It is a technically complex treatment that is performed in the hope of a functional recovery, which has been found to enhance the possibility of survival. Recanalizing a CTO is done in order to improve the patient’s chances of survival. [6]
It was expected that in people who had CTO, the distal arterioles of the CTO area would dilate to their greatest extent, which would result in an increase in the amount of myocardial perfusion that received blood from the donor artery. In order to provide blood to the CTO area, the precapillary arterioles and arteriolar capillaries of the donor region need to constrict so that they can maintain an adequate perfusion pressure. In addition, the subendocardium is the part of the heart that is the most prone to ischemia. The component of cardiac deformation known as the longitude component will be focused in this particular portion of the myocardium. The longitudinal strain analysis 56 | Cardiometry | Issue 25. December 2022
provided by two-dimensional speckle tracking echocardiography, often known as 2D-STE, is a sensitive and suitable technology for evaluating this element of heart motion. [7]
After recanalization of CTO lesions by percutaneous coronary intervention (PCI), there have been reports of beneficial improvements on symptoms, long-term survival, and the rate of CABG surgery (CABG). The positive benefits of recanalizing CTO are well-documented, however the underlying process remains unknown. [2]
Previous studies reporting enhanced LV function after CTO revascularization typically used the LV ejection fraction measured by ventriculography [8] or 2D echocardiography. [9] The improvement in LV function following CTO PCI has been validated by more recent, more accurate non-invasive technologies including cardiac MRI and 2D STE. [10] Each of the echocardiographic measures, including LV ejection fraction, WMSI, global LS, and CS, improved significantly after successful CTO revascularization in the present research. [11]
The goal of this study was to investigate whether or not it is possible to use 2D speckle tracking to evaluate the systolic performance of the left ventricle (LV) in patients who had undergone PCI for the revascularization of CTO of the left anterior descending (LAD) artery either one day or three months after the procedure. Our goal was to determine the prevalence of chronic complete blockage of the Left anterior descending artery, and we did so by conducting a prospective observational research on 100 patients with ischemic heart disease and a positive diagnosis from coronary angiography.
After 3 months, patients who had percutaneous coronary revascularization for chronic complete occlusion were evaluated for left ventricular function recovery using 2D echocardiography and speckle tracking. Patients’ ages varied from 47 to 79 in this research, with a mean of 58.55±57.98 years. The group consisted of (82% male) men and (18%) women. There was a statistically significant difference (p0.001) between the mean values of GLS at baseline (-14.22±0.91) and at 3 months follow-up (-18.66±0.92) in this investigation. The mean WMSI at baseline was 1.48±0.31 and the mean WMSI at 3 months follow-up was 1.20±0.13, with a statistically significant difference (p0.001).
Myocardial contractile function was improved, as measured by strain analysis, and this is reflected in the greater improvement of GLS and WMSI. Research by Choi et al. (2009) and others has shown that longitudinally stress measurement using 2D-STE is a precise and acceptable method for evaluating this component of cardiac motion. Because of this, strain enhancement during CTO-PCI in patients with preserved LV ejection fraction would be a reflection of the relief from the first stage of ischemia. The potential benefit of percutaneous coronary intervention in individuals with CTO has been shown in many retrospective investigations. [7]
Effective therapy reduces angina pain and increases exercise capacity and left ventricular (LV) function. Revascularization of a CTO is linked to improved angina symptoms and a lower risk of cardiac mortality, myocardial infarction (MI), and the requirement for coronary artery bypass graft surgery (CABG) during the next 12 months, This is what the TOAST-GISE study found. [6]
Three months following percutaneous revascularization, patients with CTO who had their LVEF evaluated exhibited a tendency toward improvement. Consistent with these findings, Wang et al. 2019 discovered that GLS was recovered as fast as 1 day after CTO-PCI, and LVEF improved for up to 3 and 6 months using 2D-STE. Evidence from their study suggests that 2D-STE is a reliable method for monitoring LV changes before they become clinically apparent. [12]
Functional recovery after percutaneous coronary intervention for CTO vessels was assessed in 2017 by Nakachi et al. After coronary thrombolysis and angioplasty (CTO PCI), it was shown that the change in longitudinal strain (LS) was more responsive for ischemia resolution. [13] Both ejection fraction and global longitudinal strain measures were shown to be effective in detecting the restoration of left ventricular function after coronary revascularization. [14]
The researchers concluded that revascularization of a CTO improves regional systolic function as evaluated by WMSI and lessens angina. There is a tendency for a reduced LS in the treated segments after surgery, but no significant change in global indicators of cardiac function. Variations in GLS and WMAI between baseline and follow-up were positively correlated with variations in LVEF between baseline and follow-up, and this correlation was statistically significant. [15]
As shown by Staron et al. in 2013, GLS correlates strongly with echocardiographic EF and is a stronger predictor of outcome than LVEF. [16] This conclusion makes sense given that longitudinal subendocardial fibers are more vulnerable to myocardial ischemia and fibrosis. The longitudinal axis is often the first to show signs of systolic dysfunction. The current study indicated that the average LVESV at baseline was 61.52+15.14 and at 3 months follow-up it was 50.60+14.07. This difference was statistically significant (p=0.047) and no statistically difference detected between LVEDV at baseline and at 3 months follow up.
This result was against the research by Baks et al. that published at 2006 and indicated that effective revascularization of a CTO improved both end-systolic and end-diastolic volumes, which is consistent with our findings with respect to ESV. They demonstrated a correlation between the amount of defective but still viable myocardium present before revascularization and subsequent increases in end-systolic volume and left ventricular ejection fraction. [17]
The GLS difference predicted an increase in left ventricular ejection fraction and wall motion score index, and the area under the ROC curve was calculated. Improvements in left ventricular ejection fraction and wall motion score (P=0.002) are strongly correlated with increases in GLS, indicating that GLS may be valuable as a prognostic predictor. Takeuchi et al. (2006) demonstrated that strain and strain rate recorded by tissue Doppler or speckle tracking may be used as prediction tools in CAD patients. Reason being, they can pinpoint changes in mechanical performance that occur only in certain layers. [18]
Furthermore, the high sensitivity of LS to detect functional impairment due to moderate ischemia may be explained by the prevalence of longitudinal orientation of subendocardial myocardial fibers, which are more susceptible to ischemia Carasso et al,. [19] According to Henriques et al. (2016), they did not find an overall benefit for CTO-PCI in terms of LVEF or LVEDV, which is not consistent with the current findings. LVEF stands for left ventricular end-diastolic volume, while LVEDV is for left ventricular end-diasto. [20]
According to research that was published in 2018 by Mashayekhi and colleagues, CTO-PCI did not have any impact on segmental wall thickening, LVEF, or the ejection fraction of the left ventricle. [21] According to the findings of Chimura et al., there were no statistically significant variations in LVEF or LVEDV between the successful and failure PCI groups during the course of the 9-month follow-up period. [22]
However, CTO-PCI has been shown to have a lower risk of severe adverse coronary events at 12 months compared with best medical care. A lack of statistical power or a difference in study outcomes might account for these variations. The present study’s follow-up time is shorter than the average in the aforementioned research. In this research, 3% of patients had contrast-induced nephropathy, 1% experienced cardiac tamponade, and 1% required emergency rePCI due to complications. Several research’ conclusions were substantially identical to these.
There were 3.8% cases of contrast nephropathy and 0.3% cases of cardiac tamponade, according to 2013 research published by Patel et al,. [23] Out of 3,482 patients who had retrograde CTO PCI in 2014, 1.4% had tamponade. Tamponade is unlikely to occur (risk is about 0.5%). [24] The use of large, compliant balloons (balloon-to-artery ratio>1.2), moderate-to-high inflation pressure, and hydrophilic, stiffer wires, particularly in calcified, tortuous arteries, were all associated with an increased risk of perforation. [25]
Conclusion
Revascularization of CTO LAD lead to improvement of LV function. The results of this study support the importance of clinical use of 2D-STE to assess the early changes of LV function. In patients undergoing CTO revascularization of LAD, changes in LS and GLS were more accurate and sensitive predictors for improvement of LV function after 3 months follow-up. Limitations of the study include limited duration of the study and small sample size.
Acknowledgements
Nothing to be acknowledged
Conflicts of interest
No conflict of interest
References Evaluation of left ventricular function after revascularization of coronary chronic total occlusion using speckle tracking echocardiography
- Stone GW, Kandzari DE, Mehran R, Colombo A, Schwartz RS, Bailey S, et al. Percutaneous recanalization of chronically occluded coronary arteries: a consensus document: part I. Circulation. 2005;112:2364-72.
- Geyer H, Caracciolo G, Abe H, Wilansky S, Carerj S, Gentile F, et al. Assessment of myocardial mechanics using speckle tracking echocardiography: fundamentals and clinical applications. J Am Soc Echocardiogr. 2010;23:351-69; quiz 453-5.
- Lang RM, Badano LP, MorAvi V, Afilalo J, Armstrong A, Ernande L, et al. Recommendations for cardiac chamber quantification by echocardiography in adults: an update from the American Society of Echocardiography and the European Association of Cardiovascular Imaging. J Am Soc Echocardiogr. 2015;28:1-39.e14.
- Møller JE, Hillis GS, Oh JK, Reeder GS, Gersh BJ, Pellikka PA. Wall motion score index and ejection fraction for risk stratification after acute myocardial infarction. Am Heart J. 2006;151:419-25.
- Abraham TP, Belohlavek M, Thomson HL, Pislaru C, Khandheria B, Seward JB, et al. Time to onset of regional relaxation: feasibility, variability and utility of a novel index of regional myocardial function by strain rate imaging. J Am Coll Cardiol. 2002;39:1531-7.
- Olivari Z, Rubartelli P, Piscione F, Ettori F, Fontanelli A, Salemme L, et al. Immediate results and one year clinical outcome after percutaneous coronary interventions in chronic total occlusions: data from a multicenter, prospective, observational study (TOAST-GISE). J Am Coll Cardiol. 2003;41:1672-8.
- Choi JO, Cho SW, Song YB, Cho SJ, Song BG, Lee SC, et al. Longitudinal 2D strain at rest predicts the presence of left main and three vessel coronary artery disease in patients without regional wall motion abnormality. Eur J Echocardiogr. 2009;10:695-701.
- Werner GS. A Randomized multicentre trial to evaluate the utilization of revascularization or optimal medical therapy for the treatment of chronic total coronary occlusions (EuroCTO). Euro PCR Abstracts Paris (France). 2017.
- Piscione F, Galasso G, De Luca G, Marrazzo G, Sarno G, Viola O, et al. Late reopening of an occluded infarct related artery improves left ventricular function and long term clinical outcome. Heart. 2005;91:646-51.
- Erdogan E, Akkaya M, Bacaksiz A, Tasal A, Sönmez O, Elbey MA, et al. Early assessment of percutaneous coronary interventions for chronic total occlusions analyzed by novel echocardiographic techniques. Clinics (Sao Paulo). 2013;68:1333-7.
