Evaluation of oil viscosity based various empirical correlations for Azerbaijan crude oils

Author: Yadigar N. Imamverdiyev, Makrufa Sh. Hajirahimova
Journal: International Journal of Information Technology and Computer Science @ijitcs
Article in issue: 6 Vol. 11, 2019.
Free access
In the oil industry, the evaluation of oil viscosity is one of the important issues. Generally, the viscosity of crude oil depends on pressure and temperature. In this study, the prediction issue of oil viscosity has been viewed applying empirical correlations as Beggs-Robinson, Labedi, modified Kartoatmodjo, Elsharkawy and Alikhan, Al-Khafaji. Original field data reports have been obtained from Guneshli oil field of Azerbaijan sector of Caspian Basin. The correlation models used in the evaluation of viscosity of Azerbaijan oil have been implemented in the Python software environment. The obtained values on empirical correlations have been compared to experimental data obtained from Guneshli oil field. Statistical analysis in terms of percent absolute deviation (% AD) and the percent absolute average deviation (% AAD), mean absolute error (% MAE), correlation coefficient (% ), root mean square error (% RMSE) are used to subject the evaluation of the viscosity correlations. According to statistical analysis, it has been known that the Beggs-Robinson model has shown the lowest value on AAD (10.5614%), MAE (12.4427 %), RMSE (20.0853 %). The Labedi model has presented the worst result on every four criterions. Even though the Elsharkawy-Alikhan model has presented the highest result (99.9272%) on correlation coefficient, in the evaluation of viscosity of Azerbaijan crude oil, the Beggs-Robinson model can be considered more acceptable.
Correlation, oil viscosity, dead oil, solution gas-oil ratio, bubble point pressure
Short address: https://sciup.org/15016363
IDR: 15016363 | DOI: 10.5815/ijitcs.2019.06.03
Text of the scientific article Evaluation of oil viscosity based various empirical correlations for Azerbaijan crude oils
Published Online June 2019 in MECS
The determination of the physical properties of oil is significant both theoretically and experimentally. The substantiation of the composition of reservoir oil and PVT properties is one of important conditions in the increasing of calculation accuracy of reserves and efficiency of oil fields’ development.
That's, the accurate knowledge about pressure-volume-temperature (PVT) properties of reservoir fluid is considered primary data for engineer-oilmen in the projection of oil fields, development and exploitation, calculation of well debit, the projection of surface devices, as well as, calculation of hydrocarbon reserves [1-4]. Viscosity is one of the most important parameters of PVT properties. Especially, viscosity is important in the modeling of oil gas fields, the projection of pipelines or compressor stations, increasing oil extraction and storing natural gas [5-9]. It plays a major role in the management of oil in porous environment and pipes, and determines the internal resistance of the liquid flow. Oil viscosity is a strong function of physical properties of saturated oil-gas as pressure, temperature, the specific gravity of oil, the specific gravity of gas, bubble point pressure [3, 4, 10, 11]:
H o = f ( T , Y o , Y g , R s ) (1)
In 1946, for the first time, Beal have proposed correlation model for estimation of viscosity of USA crude oil. In his study, he has shown that viscosity of crude oil increases proportionally with the increase in pressure.
The viscosity of the oil directly affects the flow of oil into the lower part of the well during the operation of oil reservoirs. How much oil viscosity is small, its flow rate increases so much. In the atmosphere, the viscosity of dead oil can range from 0.1 to 1000 cP. The viscosity of the oil in reservoir conditions varies depending on the pressure and temperature of the reservoir and the amount of gas dissolved in the oil. So with the increase of temperature the viscosity of the oil decreases, and when gas solves in oil, the oil viscosity is significantly reduced. Therefore, the viscosity of the oil in the atmosphere and the conditions of installation is different. At one of the fields in Azerbaijan, the oil viscosity is 1.23 cP in the layer (Pl = 119 atm, tl = 24 ° C and Qf = 100 m3 / t), but its viscosity in the atmosphere is 5. However, experiments show that the oil viscosity increases faintly with increasing pressure, starting at saturation pressure. The smallest viscosity of oil exists in a saturation pressure when oil and gas create a sensory surface [11– 13].
Bubble point pressure P is the maximum pressure that gas begins to separate from the oil during the isothermal expansion of the oil under the thermodynamic balance condition. Saturation pressure is high when the temperature is high. Solution Gas Oil Ratio (GOR) R s is the ratio of the volume of measured gas under normal condition (on the surface) to the volume of the remaining oil [12, 14].
Generally, in the standard PVT analyses increased pressure to cause increase in viscosity when increased pressure is higher than saturation pressure.
Ideally, the viscosity is defined by laboratory experiments using samples taken from the bottom of the well at reservoir pressure and temperature conditions. Since these laboratory experiments is costly and much time is required, alternative approaches are using. These approaches used in the prediction of oil viscosity in the available literature [15-17] are classified into three main categories:
-
- Equations of state (EOS);
-
- Empirical correlations;
-
- Machine Learning methods.
The equations of state (EOS) are based on detailed composition knowledge of the reservoir fluids, thus they do not eliminate the requirement for laboratory analysis.
When laboratory information is not satisfactory, engineers use empirical correlations, which usually differ by the complexity and accuracy, according to existing information of crude oil. Correlation means regression equations based on experimental data acquired in laboratory studies. The accuracy of these correlations largely depends on primary data used in the calculations and composition of fluids of various geographic places [10, 18, 19].
Over the last 70 years, in the prediction of oil viscosity, numerous correlation equations, which characterize these or other oils of the world have been proposed by authors as Beal [1], Chew and Connally [2], Khan, et al. [3], Labedi [22], Glaso [5], Abdulmajeed [6], Vazquez and Beggs [20], Beggs and Robinson [21], Kartoatmodjo and Schmidt [23].
Several correlations for predicting oil viscosity are available in the literature and five correlations were considered in this study: Beggs-Robinson [21], Labedi [22], Elsharkawy – Alikhan correlation [10], Al-Khafaji correlation [24], and modified Kartoatmodjo [23] which are applied to estimate the oil viscosiy of Azerbaijan crude oil samples.
Beggs – Robinson developed a empirical correlation for predicting oil viscosity by proposed Bell. Beal [1] correlated dead oil viscosity as a function of API gravity and temperature. Authors [21] proposed a modified correlation for the estimation dead oil and live oil viscosity using USA crude oils samples (460 data points for dead oils and 2073 data points for live oils). The developed correlation is a function of reservoir temperature, oil API gravity and solution gas–oil ratio.
İn 1992, Labedi developed correlations for light oil viscosity at atmospheric pressure (dead-oil viscosity), at saturation pressure, and above and below the saturation pressure. This model uses viscosity data for 100 crude oil samples were taken from the oil fields of Libya. Labedi also presented the dead oil viscosity in the range of 0.66 to 4.79 cP and ºAPI ranging from 32.2 to 48.0 as a function of API gravity and temperature in the range of 38 to 152°C using 91 data points. The developed correlation is a function of physical parameters such as stock-tank oil gravity, reservoir pressure, and temperature. Labedi correlation has also reliable predictions since was developed for similar crudes [22].
In 1994, Kartoatmodjo and Schmidt [23] developed new empirical correlations for estimate dead oil and the live-oil-viscosity. The new model based on a large data collection from reservoirs all over the world. The authors represented an empirical correlation to predict the viscosity of dead oil with 3588 data points from 661 dead oil samples and the live-oil-viscosity correlation from 5321 data points. These publications were considered in this study: Chew-Connally and Beggs-Robinson correlations for Live-oil viscosity, and Beal and Vasquez-Beggs correlations for undersaturated oil viscosity. In all but the undersaturated oil viscosity case, the new correlations provide the best prediction.
Elsharkawy and Alikhan [10] presented the new empirical models for predicting dead, saturated, and undersaturated viscosities of Middle East crude oils. The model uses viscosity data of 254 crude oil samples collected from the Middle East for temperatures ranging from 38°C to 150°C. The accuracy and limitations of previously published models for predicting the viscosity of crude oils are reviewed and discussed. From the statistical analysis, the new model is present as one of the best models by comparing it with other models published in the literature.
In 1987, Al-Khafaji and his colleagues [24] developed and improved the predictive accuracy of the existing viscosity correlations to estimate dead, live and undersaturated oil viscosities. The model based on 1270 experimental data points collected from various oil reservoirs of different compositions. This model showed better predictability and high accuracy compared to other correlations such as the Beal, Beggs and Robinson, Chew and Connally.
The mathematical expressions of used correlations in this study have been given in APPENDIX A.
From studied publications it was known that in the determining of reservoir fluids, trend of decrease of number of PVT studies and wider use of correlation dependencies are being observed. In this regard, improving of existing correlation dependences or developing new ones, as well as developing computer software for calculation of physical properties of reservoir fluids of separate regions are important. Recently, different software packages have been proposed by different companies and manufacturers. For example, PVTsim (Calsep International Consultants, USA), Visual PVT (Russian Federation), Kappa PVT (KAPPA Engineering, France), ECLIPSE PVTi (SIS Schlumberger Limited, USA), etc.
-
• PVTsim (Calsep International Consultants, USA) is focused on modeling the equation of state (EOS) and allows the user to simulate fluid properties and PVT experiments.
-
• VisualPVT includes about 160 correlations on oil, gas and water.
-
• Kappa PVT is simulator which models with both black-oil and EOS PVT.
-
• The ECLIPSE suite of simulators can be used to model any reservoir type.
The purpose of the study is to review and summarize the world experience using correlation dependencies to determine the physical properties of reservoir fluids according to the results of PVT analysis. Then it is to explore the possibility of applying the widely spread correlations in scientific literature in the evaluation of the Azerbaijani oils’ viscosity for prediction of viscosity, which is one of the main parameters of PVT properties of reservoir fluid. And finally, it is propose recommendations in the estimation of viscosity of Azerbaijan crude oil.
The remainder of this paper is organized as follows. In Section 2, the related works have been analyzed widely. In section 3, experiments have been carried out on Azerbaijan oil. In section 4, obtained results and discussions about these results have been presented. Finally, section 5 concludes the paper.
-
II. Related Works
In [2] S. A. Khan et al. developed new viscosity correlations for the crude oils of Saudi Arabian oil reservoirs. This model used viscosity data for 75 samples taken from 62 Saudi Arabian oil fields. The samples contains solution gas-oil ratio, gas relative density, oil API gravity. Reservoir oil viscosities have been measured at various pressures above and below the bubble point pressure for different temperatures. This model showed better predictability and high accuracy compared to other correlations such as the Beal, Beggs and Robinson, Chew and Connally.
Researcher from the University of Baghdad in Iraqi R.K. Abdulmajeed [6] developed a new correlation to calculate the oil viscosity at various operating conditions either for dead, saturated or under saturated reservoir [4]. The analyzes was based on 612 field data sets collected from different Iraqi fields in Khasib, Rumaila, and Mishrif formations. Each data set contains Temperature, Gas oil ratios, API gravity, saturated pressure. In the development of the proposed model, 516 of 612 data sets was used to cross-validate the relationship established during the training process and, 96 for model testing. Reservoir oil viscosities have been measured at various pressures above and below the bubble point pressure for different temperatures. According to the author, the proposed correlation can be applied for pressure values that are above or below bubble point pressure in contrast to the existing correlations in the literatures that used two different formulas to be applied for pressure values that are larger or less than bubble point pressures. This model showed better predictability and high accuracy compared to other correlations. The new correlation gives also lower average absolute relative error (3.20%) than the other correlations models, from 4.90% for the Khan correlation and to 6.96% for the Kartoatmodjo correlation. Notice that the present model works for various reservoir conditions.
Researchers from the Universities of Oman, Iran and the Netherlands conducted studies to determine the correlation that most accurately describes the value of the dead (degassed) oil viscosity depending on temperature [25]. In this study, PVT experimental data of three sample oils from Omani dead oils have been measured using Automatic Rheometer System Gemini 150/200 3X. In result was proposed correlation formula is based on real data, which covers Omani oil types. The correlations for prediction of viscosities which proposed in this study for the Omani Fahud crude oils was achieved better results in comparison with all published dead crude oil models. The average relative error of the model was 2.5%. The average relative error was for the Begs – Robinson and Kartoatmodjo – Schmidt correlation was 7.5% and 30.9% respectively.
In [9] H. H. Hanafy and colleagues presented a new approach to estimate the viscosity for Egyptian oil. Fluid data samples used for correlations were collected from 75 fields distributed along three different regions of Egypt including, the Gulf of Suez, Western Desert, and Sinai. The authors argue that correlation can be applied to estimate the properties of oil to different types of crude oils. However, according to observations, it was found that due to regional ranges in crude oil compositions, a universal correlation that can be applied to different types of crude oils would be difficult to obtain.
In 2014 researchers from the Oil India Limited Department in India developed comprehensive dead oil viscosity correlations for the crude oils of Upper Assam Basin [26]. The author’s belief that the chemical composition of crude oil is an important factor while determining an accurate viscosity correlation. This underlines the importance of the geographical location of the crude oil samples used in the correlation creation, which makes it virtually impossible to develop a single comprehensive viscosity model to include the different oil-regions of the world. The analysis based on samples from 162 wells was collected from nine different oilfields of Upper Assam Basin of Oil India Limited. The viscosity measurement of the crude oil samples was performed using a rotational viscometer and the data covered a viscosity from 2 to 120 cp and API gravity in the range of 18 to 43 °API. In this study, a regression analysis was conducted according to 486 samples using IBM’s SPSS statistics software package. The correlation for light oils was obtained from 353 samples, the correlation for heavy oils from 94 samples.
Researchers from the Research Institute of Petroleum Industry and Amirkabir University of Technology in Iran conducted to develop a reliable black oil model viscosity correlation and a neural-network based model for estimation of dead crude oils for Iranian oil reservoirs [27]. The new proposed correlation was developed by the aid of non-linear multivariable regression and optimization based on extensive data set that covers all Iranian oil reservoirs. Input parameters for this new correlation are API gravity and temperature. The average relative error of the model was 4.29%.
In 2010 Iranian researchers developed a new correlation [8] for prediction of under saturated oil viscosity based on Iranian oil reservoirs data. The predicted viscosity using the presented model has been compared with the actual field data and similar values obtained using other well-known correlations such as the Beal, Beggs and Robinson, Vasquez and Beggs, Kartoatmodjo and Schmidt, and Khan. Checking the results of this correlation shows that the obtained results of Iranian oil viscosities in this work are in agreement with experimental data compared with other correlations. The value of the average absolute error for the obtained correlation dependence is not more than 2.6%.
-
A. Hemmati-Sarapardeh and colleagues [28] proposed a new mathematical basis approach to develop reliable models for the determination of crude oil viscosity in light and intermediate crude oil systems. For this purpose, a soft computing approach, namely least square support vector machine (LSSVM), has been utilized to develop two distinct viscosity models for temperatures below and above 313.15 K. This model was applied to about 1500 dead oil viscosity data points of light and intermediate crude oil systems collected from different geographical areas. Obtained results of proposed CSA-LSSCM models were compared with appropriate experimental results. Acquired results show that the proposed models are more sustainable, reliable and effective compared to existing methods, and only 2% of the data points may be regarded as the probable outliers.
In 2016 Iranian researchers developed a new multihybrid model [29] is used to estimate the crude oil viscosity below, at, and above the bubble points using the South Pars crude oil data. The model based on parameters such as the reservoir temperature, oil API gravity, solution gas–oil ratio, pressure and saturation pressure. A general structure of group method of data handling along with Genetic algorithm, are proposed to obtain efficient polynomial correlations to estimate oil viscosity. These correlations also are compared with other well-known correlations presented in previous studies. Results show that the proposed multi-hybrid model is superior to the other models for estimating the viscosity values of Iranian crude oils.
In 2014, T.K. Al-Wahaibi and his colleagues [30] used an ANN approach (artificial neural networks) to predict the viscosity of dead, saturated and under-saturated Omani crude oil. The model based on 646 experimental data points collected from 36 PVT reports from different Omani oil fields. The database has been divided into 240 data points for under-saturated oils, 370 for saturated oils, and 36 for dead oils. All unmatched PVT data sets were removed. The neural-based black box model adopted in this study was a feedforward neural network (FFNN).The input variables used for each FFNN were the reservoir temperature, bubble point pressure, and the stock tank-oil gravity (API), solution gas oil ratio. The ANN prediction was compared against 38 oil viscosity correlations using Omani crude oil viscosity database. Twelve of these correlations are for dead oil viscosity, 14 are for saturated oil viscosity and 12 for under-saturated oil viscosity. The predicted values in the three categories perfectly matched the experimental results. All coding was made by using the MATLAB neural networks toolbox.
M.A. Al-Marhoun et al. presented a new approach [15] to predict of crude oil viscosity curve using artificial intelligence techniques. The results of the study showed that the predicted viscosity curve obtained from gas compositions of Canadian oil fields closely replicated the experimental viscosity curve above and below bubble point pressure when compared to other correlations. Also Functional Networks with Forward Selection (FNFS) surpassed all the artificial intelligence techniques followed by Support Vector Machine (SVM).
Many approaches have been presented in the literature for predicting the viscosity of crude oil. The results derived by these methods have important errors when compared with the experimental data. In [31] for this purposes a robust artificial neural network (ANN) code was developed in the MATLAB software environment to predict the viscosity of Iranian crude oils. The results obtained by the ANN and the well-known semi-empirical equations were compared with the experimental data. The prediction procedure was carried out at above and below the bubble-point pressure using the PVT data of 57 samples collected from oil fields of Iran. Results show that in comparison with the models previously published in literature, the ANN model has a better accuracy and performance in predicting the viscosity of Iranian crudes.
In [32] introduce the ensemble model of bagging as an important data mining technique to predict dead oil viscosity. The proposed ensemble model predicted the viscosity accurately with a correlation coefficient of 0.99, an accuracy that is comparable to that of ANN as previously published in literature. It was also noted that bagging lowered the relative error of the base classifier (ANN) from 10% to about 8%.
In [16], Oloso et al. developed ensemble machine learning model for the prediction of dead oil, saturated and under saturated viscosities. The input parameters for the machine learning process used easily acquired field data. For the simulation various functional forms for each property have been considered. Prediction performance of the ensemble model is better than the compared widely used empirical correlations. As the improved predictions of viscosity the developed ensemble support vector regression models could potentially replace the empirical correlation for viscosity prediction. The developed ensemble support vector regression models for viscosity prediction could potentially replace the empirical correlation, as the improved predictions of viscosity.
-
III. Implementation Several Empirical
Correlations for Estimation of Azerbaijan Oil Viscosity
It has been known, the oil fields of Azerbaijan, both onshore and offshore, have been in production for over 130 years. During that period records of varying quality have been kept concerning the properties of individual boreholes, oil and gas production, and reservoirs. Many of the very early records are either extremely incomplete or lost because of various reasons [33].
Oil samples selected from published research Huseynov et al. [11] of Azerbaijan Guneshli oil field have been used to conduct experiment (table 1). For Azerbaijan oil, the relative density (specific gravity) of gas has been taken 0.8, the relative density (specific gravity) of oil has been taken 0.8644, API gravity has been taken 32.1974 [11].
Beggs-Robinson [21], Labedi [22], modified Kartoatmodjo [23], Al-Khafiji [24] and Elsharkawy-Alikhan [10] correlations have been used which are come across mainly in the literature, for calculating oil viscosity.
Experiments were conducted using Python programming language (Jupiter notebook) on Linux OS (Ubuntu Desktop 16.04) with 1.7GB RAM, Intel(R) Core(TM) i5-2400, 64bit processor, 3.10GHz CPU properties. And MATLAB is used to visualize results.
Table 1. Data of Guneshli oil field
|
R s ( SCF / STB ) |
T ( F ) |
Pb ( psia ) |
µ ob ( cp ) |
P ( MPa ) |
µ od ( cp ) |
|
1100.46 |
123.710 |
4312.84 |
0.570 |
40 |
6.6966 |
|
954.48 |
123.843 |
3826.52 |
0.630 |
35 |
6.6770 |
|
816.02 |
126.801 |
3372.075 |
0.717 |
30 |
6.2648 |
|
756.00 |
129.576 |
3178.404 |
0.762 |
28 |
5.9153 |
|
640.01 |
132.024 |
2774.911 |
0.869 |
24 |
5.6333 |
|
582.01 |
134.386 |
2572.685 |
0.932 |
22 |
5.3820 |
|
525.97 |
136.639 |
2372.122 |
1.004 |
20 |
5.1594 |
|
470.00 |
138.767 |
2166.011 |
1.084 |
18 |
4.9632 |
|
361.02 |
140.644 |
1740.236 |
1.277 |
14 |
4.8003 |
|
308.02 |
142.464 |
1527.347 |
1.391 |
12 |
4.6510 |
|
255.01 |
144.102 |
1306.496 |
1.520 |
10 |
4.5232 |
|
203.98 |
145.540 |
1085.236 |
1.663 |
8 |
4.4159 |
|
154.01 |
146.709 |
858.242 |
1.820 |
6 |
4.3318 |
|
104.99 |
149.884 |
649.931 |
1.990 |
4 |
4.1168 |
|
55.02 |
150.467 |
362.969 |
2.174 |
2 |
4.0793 |
-
IV. Experiments and Discussions
The oil fields of Azerbaijan, both onshore and offshore, have been in production for over 130 years. The viscosity of crude oil has been calculated by Beggs-Robinson, modified Kartoatmodjo, Labedi, Elsharkawy-Alikhan and Al-Khafiji correlations. The comparison of calculated results to viscosity of oil samples taken from Guneshli oil field has been shown in Table 2. The mathematical expressions of used correlations in this study have been given in APPENDIX A. One sample of the pseudo code of the program is presented in APPENDIX B.
Saturated oil viscosity is predicted by Beggs-Robinson, modified Kartoatmodjo, Labedi, Elsharkawy-Alikhan and Al-Khafiji correlations. The accuracy has been checked with experimental data for calculation of saturated oil viscosity.
Table 2. The calculated values of viscosity with Beggs-Robinson [2], Modified Kartoatmodjo [4], Labedi [3], Elsharkawy-Alikhan [10] and Al-Khafiji [9]
|
Oils samples |
Experimental correlation |
Calculated correlations |
||||
|
Beggs-Robinson |
Labedi |
Modified Kartoatmodjo |
Elsharkawy -Alikhan |
Al-Khafaji |
||
|
1 |
0.570 |
0.7039 |
1.5402 |
0.7252 |
0.6836 |
0.8764 |
|
2 |
0.630 |
0.7819 |
1.6177 |
0.8359 |
0.8034 |
1.0049 |
|
3 |
0.717 |
0.8498 |
1.6385 |
0.9558 |
0.9224 |
1.1225 |
|
4 |
0.762 |
0.8714 |
1.6193 |
1.0065 |
0.9678 |
1.1621 |
|
5 |
0.869 |
0.9563 |
1.6625 |
1.1657 |
1.1083 |
1.3043 |
|
6 |
0.932 |
0.9964 |
1.6672 |
1.2500 |
1.1769 |
1.3706 |
|
7 |
1.004 |
1.0429 |
1.6795 |
1.3449 |
1.2522 |
1.4450 |
|
8 |
1.084 |
1.1002 |
1.7027 |
1.4568 |
1.3396 |
1.5335 |
|
9 |
1.277 |
1.2836 |
1.8294 |
1.7750 |
1.5909 |
1.8026 |
|
10 |
1.391 |
1.3910 |
1.8949 |
1.9501 |
1.7234 |
1.9476 |
|
11 |
1.520 |
1.5319 |
1.9892 |
2.1588 |
1.8816 |
2.1270 |
|
12 |
1.663 |
1.7138 |
2.1197 |
2.3978 |
2.0632 |
2.3422 |
|
13 |
1.820 |
1.9635 |
2.3137 |
2.6798 |
2.2794 |
2.6116 |
|
14 |
1.990 |
2.2553 |
2.5205 |
2.9252 |
2.4620 |
2.8596 |
|
15 |
2.174 |
2.8277 |
3.2115 |
3.3294 |
2.7818 |
3.2632 |
Elsharkawy and Alikhan correlation [10] has been checked with experimental viscosity of saturated oil taken from Guneshli oil reservoirs, and the result has been shown graphically in figure 1. In this model, absolute average deviation (AAD) is 25.2323%, correlation coefficient ( R 2 ) is 99.9272% mean absolute error (MAE) is 30.8906%, root mean square error (RMSE) is 33.4159%.
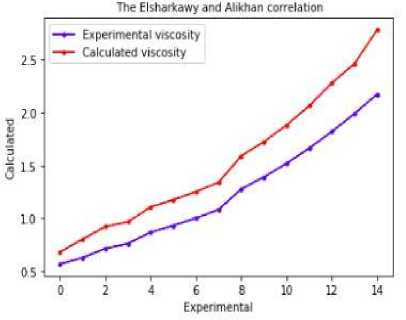
Fig.1. The comparison of experimental viscosity with calculated viscosity by Elsharkawy and Alikhan correlation.
Labedi correlation [22] has been applied to calculate oil viscosities of obtained Azerbaijan oil samples. The comparison of calculated values with predicted values has been shown in figure 2. In this correlation model, AAD is 73.4591%, is 91.4944%, MAE is 70.6893%, RMSE is 73.4825%.
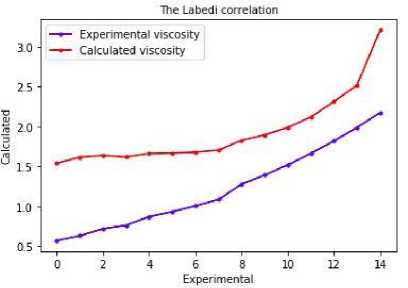
Fig.2. The comparison of experimental viscosity with calculated viscosity by Labedi correlation
The modified Kartoatmodjo correlation [23] is has been checked over Azerbaijan crude oil samples, and the obtained result has been presented graphically in figure 3. AAD is 38.3125%, is 99.8744%, MAE is 50.3589%, RMSE is 58.2237%.
Beggs-Robinson correlation [21] has been tested with the viscosity of oil samples taken from Guneshli oil reservoir and the comparative result has been shown in figure 4. For this model, AAD is 10.5614%, is 97.2405%, MAE is 12.4427%, RMSE is 20.0853%.
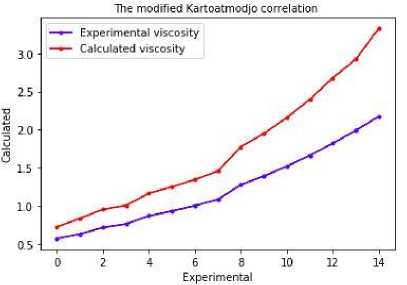
Fig.3. The comparison of experimental viscosity with calculated viscosity by modified Kartoatmodjo correlation
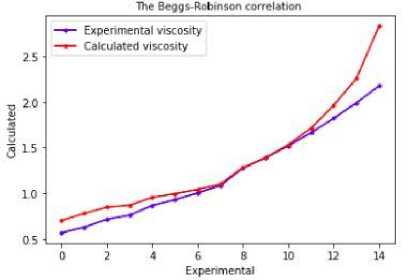
Fig.4. The comparison of experimental viscosity with calculated viscosity by Beggs-Robinson correlation
Al-Khafiji correlation [24] has been applied to calculate the viscosity of Azerbaijan oil samples. The comparison predicted value with experimental value has been shown in figure 5. AAD is 46.9403%, is 99.6687%, MAE is 55.7998%, and RMSE is 59.5658%.
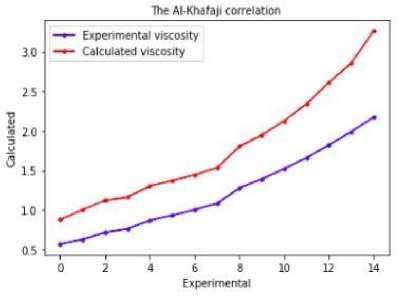
Fig.5. The comparison of experimental viscosity with calculated viscosity by Al-Khafiji correlation
The accuracy of applied correlations – expressed by (2)-(6) formulas – has been calculated based on statistical parameters [34, 35] as absolute average deviation, mean absolute error, correlation coefficient, and root mean square error.
Firstly, AD has been calculated as following:
% AD = I M exp ^ cal^ x 100
M exp
and 99.6687 for Beggs-Robinson, Labedi, modified
(2) Kartoatmodjo, Elsharkawy-Alikhan and Al-Khafaji corrections.
Above expression given by (2) equation is an indication of the absolute deviation in percent from experimental and calculated values, where m, and Mai represent the experimental and calculated viscosity values, respectively. Absolute deviation has been taken into consideration for calculation of absolute average deviation.
% AAD = - У n V p^A x ioo (3)
n i = 1 M exp
The comparison of errors
AAD is an important indicator of the accuracy of the correlation.
% MAE = 1 У n = J M eal - M exp | x 100 (4)
Mean absolute error is a measure of difference between M exp and M eal values.
%R2_ n ( M ea/ M expH E M expX £ M eal ) ^ (5)
0 [ ” У M 2xp " ( У M exp )2 ][ П У M a " ( У M eal X ]
Appendix A Summary OF Used Viscosity Correlation
API = 14—5 - 131.5
/ 0
Beggs – Robinson correlation [21]:
M eal = a X M b
where
M od = 10 1 - 1
X = T -
1.163
x (10
3.0324 - 0.02023 x API
)
A correlation coefficient is a measure of some type of correlation, meaning a statistical relationship between M exp and M eal values.
a = 10.715( R + 100) - 0'515 b = 5.44( R + 150) - 0'338
Labedi correlation [22]:
% RMSE =
У " = 1 ( M eal - M exp /
x 100
n
0.6447
2.344 - 0.03542 x API M od
Meal = ( 10 ) x p 0.426
Pb
Modified Kartoatmodjo correlation [23]:
Where n is the number of experimental points, is experimental viscosity, and is calculated viscosity. AAD% shows how to be near the calculated values to experimental values.
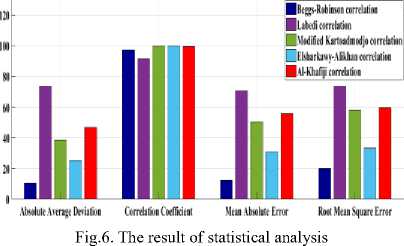
The results of calculations have been presented in table 3, and graphically in figure 6.
M = 0.0132 + 0.9821* F - 0.005215* F2
where
F = (0.2038 + 0.8591 *10 < - 0.000845 * R - ) ) * MM . 38 5 +5 56A ‘ y y = 10 ( - 0.00081* R - )
Table 3. The results of statistical analysis
|
Correlations |
Statistical analysis |
|||
|
AAD(%) |
R 2 (%) |
MAE (%) |
RMSE (% ) |
|
|
Beggs -Robinson |
10.5614 |
97.2405 |
12.4427 |
20.0853 |
|
Labedi |
73.4591 |
91.4944 |
70.6893 |
73.4825 |
|
Modified Kartoatmodjo |
38.3125 |
99.8744 |
50.3589 |
58.2237 |
|
Elsharkawy -Alikhan |
25.2323 |
99.9272 |
30.8906 |
33.4159 |
|
Al-Khafaji |
46.9403 |
99.6687 |
55.7998 |
59.5658 |
As seen from Figure 6, the %AAD value is respectively 10.5614, 73.4591, 38.3125, 25.2323, and 46.9403%, and % is 97.2405, 91.4944, 99.8744, 99.9272
Elsharkawy – Alikhan correlation [10]:
Meal = a x Mbd where a = 1241.932(Rs + 641.026)-k12410
b = 1768.841( Rs + 1180.335) - 1.06622
Al-Khafaji correlation (1987) [24]:
Meal = a x Mbd where a = 0.247 + 0.2824X + 0.5657X2 - 0.4065X3 + 0.0631X4 b = 0.894 + 0.0546X + 0.07667X2 - 0.0736X3 + 0.01008X4 X = log R-
Appendix B Pseudo Code of the Beggs-Robinson Correlation import numpy as np import pandas as pd import matplotlib.pyplot as plt
#input data
sg_g=0.8
API=141.5/sg_o-131.5
x=pow(T,(-1.163))*pow(10,(3.0324-0.02023*API)) do_vis=pow(10,x)-1
a=10.715*pow((Rs+100),(-0.515)) b=5.44*pow((Rs+150),(-0.338)) cal_vis=a*pow(do_vis,b)
Nomenclature
API Oil API gravity
R Solution gas-oil ratio (SCF/STB)
µ Dead oil viscosity (cp)
Saturated oil viscosity at bubble point µ ob pressure (cp)
γ Specific gravity of gas
γ Specific gravity of oil
T Oil reservoir temperature
P Bubble point pressure
µ Experimental viscosity
µ Calculated viscosity
P Pressure
AD Average deviation
AAD Absolute average deviation
MAE Mean absolute error
R 2 Correlation coefficient
RMSE Root mean square error
-
V. Conclusion and Recommendation
Viscosity is one of the most important governing parameters of the fluid flow. Several empirical correlation models have been applied to estimating viscosity of crude oil samples taken from Azerbaijan Guneshli oil reservoir.
At the end of the analysis, it has become clear that the Beggs and Robinson model had the lowest %AAD (10.5614%) value and the Labedi model had the highest %AAD value (73.4591%) for Azerbaijani oil compared to other correlation models. Elsharkawy-Alikhan model has shown the highest result for correlation coefficient (99.9272%). According to the results of statistical analysis, we can say that Beggs-Robinson model compared to other used correlation models can be considered more acceptable in the evaluation of viscosity of Azerbaijan crude oil. Experiments show that, in the prediction of viscosity, partial compline is observed to offer traditional empirical correlations according to different geographical regions for oil which differ sharply each other by PVT properties between predicted and experimental values. That’s why none of these correlations can be considered a universal correlation. More compatible empirical correlations must be applied to calculate and to predict accurately viscosity of Azerbaijan crude oil. In future studies, it is planned to develop more accurate correlation models for the evaluation of the viscosity of Azerbaijan crude oil. The development of model based on machine learning methods is also intended to evaluate more accurately viscosity.
Acknowledgment
This work was supported by the SOCAR Science Foundation of Azerbaijan (Grant 16LR - AMEA)
References Evaluation of oil viscosity based various empirical correlations for Azerbaijan crude oils
- C. Beal, "The viscosity of air, water, natural gas, crude oil and its associated gases at oil field temperatures and pressures," Transactions of the AIME, vol. 165, pp. 94-115, 1946.
- Chew and C. H. Connally, "Viscosity correlations for gas saturated crude oils," Jr Trans AIME, vol. 216, pp. 23-25, 1959.
- S. Khan, M. Al-Marhoun, S. Duffuaa, and S. Abu-Khamsin, "Viscosity correlations for Saudi Arabian crude oils," in SPE Paper 15720 Presented at the Fifth SPE Middle East Conference held in Manama, Bahrain, 1987, pp. 7-10.
- A1-Marhoun M. A. Preasure-Volume-Temperature Standsrd Deviation Correlations for Saudi Crude Oils. Paper SPE, 13718. In: SPE Middle East Technical Conference, 11-14 March, Bahrain, 1985.
- O. Glaso, "Generalized pressure-volume-temperature correlations," Journal of Petroleum Technology, vol. 32, pp. 785-795, 1980.
- R. K. Abdulmajeed, "New viscosity correlation for different Iraqi oil fields," Iraqi Journal of Chemical and Petroleum Engineering, vol. 15, no. 3, pp. 71–76, 2014.
- M. Sattarin, H. Modarresi, M. Bayat, and M. Teymori, "New viscosity correlations for dead crude oils," Petroleum & Coal, vol. 49, pp. 33-39, 2007.
- R. Abedini, A. Abedini, and N. E. Yakhfrouzan, "A new correlation for prediction of undersaturated crude oil viscosity", Petroleum & Coal, vol. 52, pp. 50-55, 2010.
- H. H. Hanafy et al,.”Emperical PVT correlations applied to Egyptian crude oils exemplify significance of using regional correlations”, SPE International Symposium on Oilfield Chemistry, Houston, Texas, 18–20 Feb. 1997. – SPE 37295.
- A. Elsharkawy and A. Alikhan, "Models for predicting the viscosity of Middle East crude oils," Fuel, vol. 78, pp. 891-903, 1999.
- M. A. Huseynov, V. J. Abdullayev, and N. N. Hamidov, "The prediction of horizontal well performance on the basis of reservoir and well model," Azerbaijan Oil Industry, vol. 5, pp. 13-18, 2014.
- A. Mirzajanzadeh and M. A. Iskandarov, "The theoretical bases of the development and exploitation of oil and gas fields," Baku, p. 395, 2010.
- A. M. Salmanov, A. S. Eminov, and L. A. Abdullayeva, "Current status of oil development deposits of Azerbaijan and their geological field indicators," Baku, p.74, 2015.
- G. E. Petrosky, F. F. Farshad, “Viscosity correlations for Gulf of Mexico crude oils,” In: SPE production operations symposium, SPE, Oklahoma City, Oklahoma, 2–4 April 1995.
- M.A. Al-Marhoun, S. Nizamuddin, A. A. Abdul Raheem, A. S. Shujath, A. A. Muhammadain, “Prediction of crude oil viscosity curve using artificial intelligence techniques,” Journal of Petroleum Science and Engineering, vol. 86, pp. 111–117, 2012.
- M. A. Oloso, M. G. Hassan, J. Buick et al., “Ensemble SVM for characterization of crude oil viscosity,” Journal of Petroleum Exploration and Production Technology, vol. 8, no. 2, pp 531–546, June 2018.
- A. M. Ramirez, G. A. Valle, F. Romero, M. Jaimes, “Prediction of PVT properties in crude oil using machine learning techniques MLT,” SPE Latin America and Caribbean Petroleum Engineering Conference, 2017, https://doi.org/10.2118/185536-MS
- Dindoruk, P.G. Christman, “PVT properties and viscosity correlations for Gulf of Mexico oils,” SPE Reserv Eval Eng., vol.7, pp. 427–437, 2004.
- M. Hajirahimova, A. Aliyeva, “Current Approaches in Prediction of PVT Properties of Reservoir Oils”, Review of information engineering and applications, vol. 5, no. 2, pp. 31-40, 2018.
- M. Vazquez and H. D. Beggs, "Correlations for fluid physical property prediction," Journal of Petroleum Technology, vol. 32, pp. 968-970, 1980.
- H. D. Beggs and J. Robinson, "Estimating the viscosity of crude oil systems," Journal of Petroleum Technology, vol. 27, pp. 1140-1141, 1975.
- R. Labedi, "Improved correlations for predicting the viscosity of light crudes," Journal of Petroleum Science and Engineering, vol. 8, pp. 221-234, 1992.
- T. Kartoatmodjo and Z. Schmidt, "Large data bank improves crude physical property correlations," Oil and Gas Journal, vol. 92, pp. 51-55, 1994.
- A. H. Al-Khafaji, G. H. Abdul-Majeed, and S. F. Hassoon, "Viscosity correlation for dead, live and undersaturated crude oils," Journal of Petres's Research, vol. 6, pp. 1-16, 1987.
- N. Al-Rawahi et al., “A new correlation for prediction of viscosities of Omani Fahud Field crude oils,” Advances in Modelling of Fluid Dynamics, 12th chapter, 2012, pp. 293–300.
- J. Deepak, D. Abhishek “Crude oil viscosity correlations: A novel approach for Upper Assam Basin,” 11th International Oil & Gas conference and exhibition PETROTECH-2014, Oil India Limited, Geology & Reservoir Department, Duliajan, Assam, India, 12–15 Jan. 2014.
- A. A. Naseri et al, “Neural network model and an updated correlation for estimation of dead crude oil viscosity,” Brazilian journal of petroleum and gas. vol. 6, № 1. pp. 31–41, 2012.
- A. Hemmati-Sarapardeh, B. Aminshahidy, A. Pajouhandeh et al., “A soft computing approach for the determination of crude oil viscosity: light and intermediate crude oil systems,” Journal of the Taiwan Institute of Chemical Engineers, vol. 59, pp. 1-10, February 2016.
- B. Ghorbani, M. Hamedi, R. Shirmohammadi et al., A novel multi-hybrid model for estimating optimal viscosity correlations of Iranian crude oil. J. Petroleum Science Engineering, vol. 142, pp. 68–76, 2016.
- T. K. Al-Wahaibi, F. S. Mjalli and A-A. Al-Hashmi, ”Viscosity correlations for light Omani crude using artificial neural networks,” Int. J. Petroleum Engineering, vol. 1, no. 1, pp. 92–110, 2014.
- M. S. Lashkenari, M. Taghizadeh, B. Mehdizadeh, “Viscosity prediction in selected Iranian light oil reservoirs: Artificial neural network versus empirical correlations,” Petroleum Science, vol. 10, no. 1, pp.126-133, 2013.
- B. B. Gulyani, B. G. Prakash Kumar, and A. Fathima, “Bagging Ensemble Model for Prediction of Dead Oil Viscosity,” International Journal of Chemical Engineering and Applications, vol. 8, no. 2, April 2017.
- E. Bagirov, I. Lerche, B. Bagirov and S. Mamedova, "Reservoir Characteristics for South Caspian Oil Fields", Offshore Technology Conference 10887, Houston, Texas, 3-6 May 1999, pp. 1-10
- F.Borns, Statistics for Petroleum Engineers. Dallas: SPE, 1969.
- W. J. Dixon and F. J. Massey, Introduction to statistical analysis. Tokyo: Jr., Kogakusha Co., Ltd., 1969.
