Evaluation of the Design Metric to Reduce the Number of Defects in Software Development

Author: M. Rizwan Jameel Qureshi, Waseem A. Qureshi
Journal: International Journal of Information Technology and Computer Science(IJITCS) @ijitcs
Article in issue: 4 Vol. 4, 2012.
Free access
Software design is one of the most important and key activities in the system development life cycle (SDLC) phase that ensures the quality of software. Different key areas of design are very vital to be taken into consideration while designing software. Software design describes how the software system is decomposed and managed in smaller components. Object-oriented (OO) paradigm has facilitated software industry with more reliable and manageable software and its design. The quality of the software design can be measured through different metrics such as Chidamber and Kemerer (CK) design metrics, Mood Metrics & Lorenz and Kidd metrics. CK metrics is one of the oldest and most reliable metrics among all metrics available to software industry to evaluate OO design. This paper presents an evaluation of CK metrics to propose an improved CK design metrics values to reduce the defects during software design phase in software. This paper will also describe that whether a significant effect of any CK design metrics exists on total number of defects per module or not. This is achieved by conducting survey in two software development companies.
CK Metrics, Defects, Design, Quality, Case Study
Short address: https://sciup.org/15011675
IDR: 15011675
Text of the scientific article Evaluation of the Design Metric to Reduce the Number of Defects in Software Development
The demand of quality software is increasing day-by-day due to social dependency of the clients on the software. For instance architecture, interface and integration etc are the main software design defects. Any problem in software can cause financial loss and time delays. Today’s software must assure consistent and error free execution whenever it is used. Software design has an important role in the quality of the software. Poor design will result in greater rework and higher cost [1]. Design defects need to be identified in early stages of system development life cycle (SDLC). There are significant research studies showing that defect seeding at the design phase are visible in the maintenance phase [2]. Different technologies provide different facility to improve the quality of the design. A lot of research has been done on different metrics to assure the quality of software design [1]. So it is very important to have a good software design to reduce the maintenance time and overall cost of project.
Different Metrics ar e available to evaluate software design quality. The data, about Chidamber and Kemerer (CK) Metrics and t otal number of defects, is collected from two soft wa re compan i es/houses to conclude the re s ults. The ma i n objective of this paper is to propose a framework t o quantitati v ely evaluate software design and observe its effects o n total number of defects.
The remai n der of this p ap er is organi z ed as follows: Section 2 illustrates the r elated wor k . Section 3 discusses the C K metrics. Se c tion 4 prese n ts motivation fo r hypothesis. Section 5 describes the research question and hypothesis. Sec t ion 6 presen t s the research se t ting. Section 7 provides t h e findings o f experiments and analysis. C o nclusion is g i ven in the fi n al section.
2. Related Work
The object oriented ( O O) approac h to software development a s sures better managemen t of software complexity an d a likely improvement in project outcomes in te r ms of qualit y and timelines. There has been a lot of research on metrics for OO software development i n recent yea r s, which sh o ws that OO methodology and project outcomes have some relationship [3]. In the OO e n vironment, c e rtain integral design concepts such as i n heritance, c oupling, and cohesion have been argu e d to signif i cantly affect complexity [4].
The concepts of software metrics are well established, and many metrics relating to product quality have been developed and used. To evaluate a metric's usefulness as a quantitative measure of software quality, it must be based on the measurement of a software quality attribute. Software metrics plays an important role to improve requirement engineering, design quality, code quality, reducing overall defects in the SDLC phases and product readiness to ship/deploy. For example, one study recently showed that prediction models using design metrics had an error rate of only 9% when estimating the proportion of classes with postrelease defects for a commercial Java application [5]. This is encouraging because such estimates can be used to allocate maintenance resources and for obtaining assurances about software quality. Another study estimated corrective maintenance cost savings of 42% by using OO metrics [6]. Here, classes containing defects were predicted early in the project and were targeted for inspection.
Chidamber and Kemerer proposed first suite of OO design measures that is called as CK Metrics [4]. The authors of this suite of metrics claim that these measures can aid users in understanding design complexity, in detecting design flaws and in predicting certain project outcomes and external software qualities such as software defects, testing, and maintenance effort. CK Metrics helps to analysis complexity, understandability / usability, reusability / application specific and testability-/maintainability. Thus it is important to have a metrics program in all the phases of SDLC to observe the quality of the input, process and output.
3. CK Metric
The complete details of the CK metrics [7] along with the names, common names and definition are given in the following Table 1.
The information in the Table 2 is gathered through an Internet survey [8]. Table 2 shows that these values are provided by the different software developed by different vendors for “Metrics calculation domain”. It is also interesting to know that these values as mentioned in Table 2 differ from each other, proving that there is no unanimous cut point threshold value for these metrics. These vendors however, have not provided any basis of these proposed values.
4. Motivation for Research Question andHypothesis
The authors surveyed and found Together-Soft, SD-Metrics and Objecteering tools which are contributing significantly in the industry to measure the design quality. These tools are used by the industrial giants like Sun Microsystems, Microsoft etc. The literature survey shows:
1. That CK metrics being the most used is the most trusted and popular of all the metrics.
2. That there is no, agreed upon, cut point threshold value of CK metrics that industry uses.
3. That it depends upon the historical data of the organization as to what values suit for the organization [10].
5. Research Question and Hypotheses
Table 1: CK Metrics
|
Metric Name |
Definition |
|
|
1 |
Weighted Methods per class (WMC) |
This measure is an aggregate count of the number of methods in each class. This count also includes Constructors and Destructors of the class. |
|
2 |
Depth Of Inheritance Tree (DIT) |
This count is the maximum length / depth from the node to the root of the tree. |
|
3 |
Number of immediate subclasses (NOC) |
Number of children / subclasses subordinated to a class in the class hierarchy. |
|
4 |
Coupling between Objects Classes (CBO) |
It is a count of the number of other classes to which it [a class] is coupled. |
|
5 |
Response for a class (RFC) |
It is a count of the set of methods that can potentially be executed in response to a message received by an object of that class. |
|
6 |
Lack of cohesion in Method (LCOM) |
It is a count of the number of method paired whose similarity is 0 minus the count of method paired whose similarity is not 0. |
Table 2: Threshold Values For CK Metrics By Different Vendors/Researchers
|
Sr. # |
CK Metrics |
Rosenber, NASA |
SD-Metrics |
Together Soft |
Objecteering Enterprise Edition |
Cantata++ |
|
1 |
WMC |
40 |
- |
100 |
3-7 |
- |
|
2 |
DIT |
6 |
0-3 |
4 |
0-4 |
- |
|
3 |
NOC |
- |
- |
- |
1-4 |
- |
|
4 |
CBO |
5 |
0-31 |
30 |
1-4 |
- |
|
5 |
RFC |
100 |
3-365 |
- |
- |
- |
|
6 |
LCOM |
- |
- |
- |
- |
- |
According to Caper Jones [2], “Defect seeding at the design phase is visible in the maintenance phase”. CK metrics being a means of reducing defects in design phase and hence in maintenance phase, it is therefore important to find out an improved/unanimous version of CK-metrics’ values which is being done in this research work.
The research question can now be set forth in the next section on the basis of literature review.
How to evaluate CK design metrics to reduce the number of defects in software development? Following hypotheses are used in this research.
H0 (Null Hypothesis) There is no relationship between CK Metrics [WMC, DIT, NOC, CBO, RFC, and LCOM] and the total number of defects found per module of software system.
H0: μ1 ≠ μ2 ≠ μ3 ≠ μ4 ≠ μ5 ≠ μ6.
H 1 (Alternate There is a relationship
Hypothesis) between CK metrics [WMC, DIT, NOC, CBO, RFC, and LCOM] and the total number of defects found per module of the software system.
H1: μ1= μ2= μ3 = μ4 = μ5= μ6.
6. Research Setting
The research site for data collection is two leading software development companies as given in the following Table III. The core competencies of first software company include all areas of the Internet technologies, client/server applications, object-oriented technologies, groupware automation and large scale system integration. It’s a CMM Level 5 company. Total strength of the company is more than 1000 employees in total. It is the first Pakistani software development company who achieved CMM level 5. This is the main reason for selection of this company. The 2nd software company is also a leading provider of real-time financial portal software.
Table 3 : Organization Details
|
Organization Details |
|
|
Organization Size |
1 st Software Company: 1000+ employees 2 nd Software Company: 500+ Employees |
|
Organization’s Maturity level |
1 st Software Company: CMM Level 5, ISO 9001 2 nd Software Company: None |
|
Project Details |
|
|
Projects under Experiment |
1 st Software Company Project: P1 2 nd Software Company Projects: P2, P3, P4 Three projects with 12 modules in total. |
|
Domain of the Projects Under Study |
1 st Software Company Project/P1: Leasing 2 nd Software Company Project/P2: Web Portal including financial packages |
|
Duration of the Projects |
P1: 12 Months P2: 18 Months P3: 12 Months P4: 06 Months |
|
Team Size |
1 st Software Company
[Analyst and also involved in development]
2 nd Software Company
[Analyst and also involved in development]
|
|
Technology Used |
Java/ J2EE/SQL Server |
|
SDLC Followed |
Tailored Waterfall methodology |
|
Average Experience of Team |
Medium |
Following points also need attention of the readers to know little bit more for the software companies.
-
1. Due to length issue of research paper, the authors are not attaching questionnaire used for the survey regarding the research presented in this paper. They do have the questionnaire for the reference and verifications of those whoever is needed.
-
2. The authors can not disclose the names of the IT companies those have been surveyed for this paper. This is because the companies have participated in the survey subject to the condition that their names will not be disclosed.
Different types of research methodologies exist, in today’s research world, depending upon the nature of research problem. As far as the research methodology of this paper is concerned, survey is used to collect the data.
Automated tools and processes have significant edge over the manual processes in terms of time and efficiency. Due to this reason, a survey is made using Internet to find the available automated tools to measure design quality. Borland Together Edition for JBuilder Version 6.1 is used to calculate metrics from the code. It is used by the industrial giants like Sun Microsystems and Microsoft Corporation [11].
Regression analysis will be used to test the hypotheses. The purpose of regression analysis is to develop a predictive model that could predict the number of defects for a module in a similar environment [discussed in the later part of this paper]. The model will estimate the number of defects regardless of their nature, based on the historical data available, using multiple regression analysis. In this case:
Dependent = Total number of defects Variable per module
Independent = WMC, DIT, NOC, CBO,
Variables RFC, LCOM
Null Hypothesis
H0: None of the independent variables has a significant effect on the dependent variable.
H 0 : β j = 0 (Where j= 1,2,3,4,5,6)
Alternate Hypothesis:
H1: At least one of the independent variables has a significant effect on the dependent variable.
H1 : β j ≠ 0 At least for one value of j
(where j= 1,2,3,4,5,6)
7. Experiment and Analysis
Seven days on the average, 5 to 6 hours, have been spent to collect data, its verification and validation in each company. For data verification, code is inspected manually to make sure different metrics have the correct data. Then randomly some classes are selected to validate and verify the data gathered by Together-Soft.
This study is concerned with the number of total defects only. Unfortunately the defects segregated by their origin could not be found for example requirements, design, and coding. Due to tight deadlines, companies could not invest time in further categorizing defects with respect to their origin and severity level. This study is also not focusing on the severity levels of the defects. The selected projects are from the same implementation domain [J2EE] and having at least 2 to 2.5 years of experience of each member in the project. So any one can fairly assume that there exist some design problems in the total number of defects and not all the defects are of low severity. The authors have further verified this by manually going through the bug report and found that some of the defects were of high severity and were tracing back to the design.
Table 4 shows data that is analyzed to calculate CK metrics. Graphs are plotted with modules on x-axis and CK metrics [CBO, DIT, LCOM, NOC, RFC and WMC] on y-axis separately as given in the following figures from Figure 1 to Figure 6 respectively. The average and threshold values are plotted on the graphs. By plotting these lines, one can clearly see three regions in the graphs.
-
1. Below the lower plotted straight line
-
2. Between two straight lines
-
3. Above the upper straight line.
Calculations are made for three regions by using the following formulation.
-
• Total Number of defects from module below lower limit = X
-
• Total Number of independent variable from module below lower limit = Y
-
• Defects per independent variable = X/Y
The straight lines are plotted by using minimum, average and maximum values if no threshold values exist for any independent variable. A comparison can be made that in which region minimum numbers of defects are occurring.
On the basis of this analysis, significant region can be identified and accepted as the best among three regions with less number of defects/ independent variable. A summery will be presented in at the end to summarize the finding of this phase.
Linear regression is applied on the data using
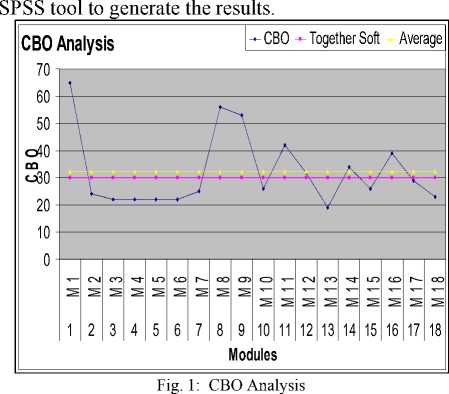
Table 4 : Data Collected to Calculate CK Metrics
|
Sr. # |
Modules |
CBO |
DIT |
LCOM |
NOC |
RFC |
WMC |
Total Number of defects |
Bug Fixing Time Man hours |
|
1 |
M1 |
65 |
3 |
11223 |
142 |
149 |
577 |
307 |
184 |
|
2 |
M2 |
24 |
3 |
12132 |
122 |
289 |
1647 |
111 |
48 |
|
3 |
M3 |
22 |
3 |
1276 |
112 |
109 |
564 |
75 |
48 |
|
4 |
M4 |
22 |
3 |
11669 |
238 |
287 |
1560 |
186 |
48 |
|
5 |
M5 |
22 |
3 |
5048 |
20 |
185 |
1051 |
35 |
160 |
|
6 |
M6 |
22 |
3 |
9051 |
37 |
145 |
998 |
66 |
48 |
|
7 |
M7 |
25 |
7 |
261 |
21 |
376 |
165 |
35 |
192 |
|
8 |
M8 |
56 |
3 |
6832 |
101 |
312 |
651 |
30 |
128 |
|
9 |
M9 |
53 |
3 |
1459 |
101 |
196 |
245 |
37 |
96 |
|
10 |
M10 |
26 |
5 |
758 |
12 |
148 |
332 |
45 |
192 |
|
11 |
M11 |
42 |
5 |
1562 |
90 |
195 |
375 |
23 |
120 |
|
12 |
M12 |
32 |
7 |
367 |
18 |
386 |
89 |
35 |
192 |
|
13 |
M13 |
19 |
5 |
419 |
10 |
119 |
196 |
47 |
192 |
|
14 |
M14 |
34 |
6 |
5470 |
81 |
322 |
594 |
8 |
32 |
|
15 |
M15 |
26 |
5 |
758 |
12 |
148 |
332 |
45 |
192 |
|
16 |
M16 |
39 |
7 |
2821 |
58 |
425 |
560 |
37 |
96 |
|
17 |
M17 |
29 |
6 |
2821 |
47 |
392 |
644 |
81 |
288 |
|
18 |
M18 |
23 |
6 |
228 |
8 |
392 |
52 |
16 |
96 |
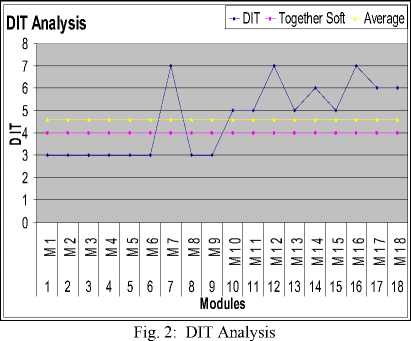
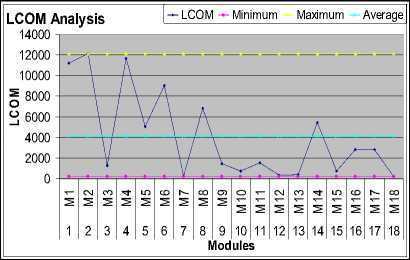
Fig. 3: LCOM Analysis
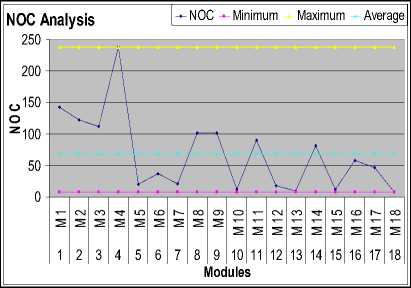
Fig. 4: NOC Analysis
Table 5 : Analysis of data
|
Min |
Max |
Median |
Average |
Std. Dev |
|
|
CBO |
19.0 |
65.0 |
26.0 |
32.3 |
13.5 |
|
DIT |
3.0 |
7.0 |
5.0 |
4.6 |
1.6 |
|
LCOM |
228.0 |
12132.0 |
2191.5 |
4119.7 |
4280.6 |
|
NOC |
8.0 |
238.0 |
52.5 |
68.3 |
61.3 |
|
RFC |
109.0 |
425.0 |
241.5 |
254.2 |
110.1 |
|
WMC |
52.0 |
1647.0 |
562.0 |
590.7 |
461.5 |
|
LOC |
807.0 |
86922.0 |
7577.0 |
16637.7 |
22547.4 |
|
Defects |
8.0 |
307.0 |
41.0 |
67.7 |
72.6 |
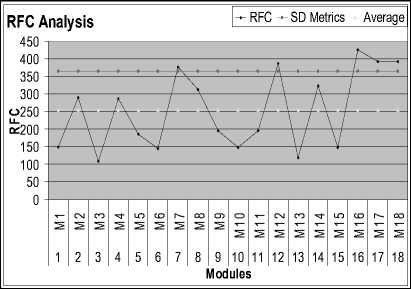
Fig. 5: RFC Analysis
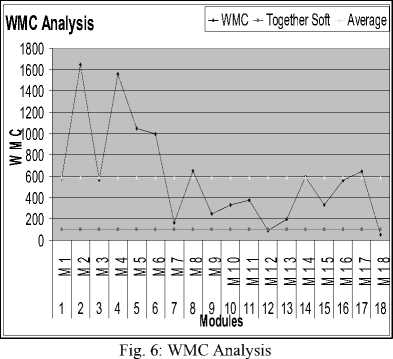
Table 5 shows the analysis of the data that is collected from both companies where survey is conducted. Row 1 of Table V presents the CBO values from the data collected. The average of CBO [which is 32.3] is compared by the average suggested by Together Soft, which is 30, which are almost equal.
MODULES HAVE VALUES 0 < CBO < 30 Total number of defects from M2, M3, M4, M5, M6, M7, M10, M13, M15, M17, M18 = 260
Total number of CBO from M2, M3, M4, M5, M6, M7, M10, M13, M15, M17, M18 = 742
Defects per CBO = 260/742 = 0.35
MODULES HAVE VALUES 30 < CBO < 32.3 There lie no values in between 30 and 32.3
MODULES HAVE VALUES 32.3 < CBO < 65 Total number of defects from M1, M8, M9, M11, M12, M14, M16 = 477
Total number of CBO from M1, M8, M9, M11, M12, M14, M16 = 321
Defects per CBO = 477/321= 1.49
The results in Table 5 show that the value of CBO should be 0 < CBO < 30 in order to minimize the number of defects / CBO. Row 2 of Table V presents the DIT values. The Averages of DIT from the data collected [which is 4.6] is compared by the average suggested by Together Soft, which is 4.0.
MODULES HAVE VALUES 0 < DIT < 4 Total number of defects from M1, M2, M3, M4, M5, M6, M8, M9 = 847
Total number of DIT from M1, M2, M3, M4, M5, M6, M8, M9 = 24
Defects per DIT = 847/24 = 35.29
MODULES HAVE VALUES 4 < DIT < 4.61 There are no values in between 4 and 4.61
MODULES HAVE VALUES 4.61 < DIT < 7.0 Total number of defects from M7, M10, M11, M12, M13, M14, M15, M16, M17, M18=372
Total number of DIT from M7, M10, M11, M12, M13, M14, M15, M16, M17, M18=59
Defects per DIT = 372/59 = 6.31
The analysis of data shows that the acceptable value of DIT should be greater than 4.61 and less than 7, in order to minimize the number of defects/DIT. Row 3 of Table V presents the LCOM values from the data collected. The Average of the LCOM is 4119.72, the minimum LCOM is 228.00, and maximum LCOM is 12132.00.
MODULES HAVE VALUES 228.00 < LCOM < 4119.72 Total number of defects from M3, M7, M9, M10, M11, M12, M13, M15, M16, M17, M18=751
Total number of LCOM from M3, M7, M9, M10, M11, M12, M13, M15, M16, M17, M18=12730
Defects per LCOM = 751/12730 = 0.06
MODULES HAVE VALUES 4119.72 < LCOM < 12132.00 Total Number of defects from M1, M2, M4, M5, M6, M8, M14 = 468
Total Number of LCOM from M1, M2, M4, M5, M6, M8, M14 = 61425
Defects per LCOM = 468/61425 = 0.01
The results show that the value of LCOM should be 4119.72 < LCOM < 12132.00 to minimize the number of defects / LCOM. Row 4 of Table V presents the NOC values from the data collected. The Averages of NOC from data collected [which is 68.8] is compared by the average suggested by Objecteering Enterprise Edition, which is 1 for minimum and 4 for maximum [10] . The minimum values from the data collected are ‘8’ with is double than what Objecteering Enterprise Edition suggests.
MODULES HAVE VALUES
8 < NOC < 68.33
Total number of defects from M5, M6, M7, M10, M12, M13, M15, M16, M17, M18 = 617
Total number of NOC from M5, M6, M7, M10, M12, M13, M15, M16, M17, M18= 243
Defects per NOC = 617/243= 2.54
MODULES HAVE VALUES
68.33 < NOC < 238
Total number of defects from M1, M2, M3, M4, M8, M9, M11, M14 = 602
Total number of NOC from M1, M2, M3, M4, M8, M9, M11, M14 = 987
Defects per NOC = 602/987 = 0.61
Table 5 describes that the value of NOC should be 68.33 < NOC < 238.00 to minimize the number of defects/NOC. The graph of Fig.5 presents the RFC values from the data collected. The Averages of RFC [which is 254.17] is compared by the maximum suggested by SD Metrics, which is 365 [10].
MODULES HAVE VALUES 0 < RFC < 254.17
Total number of defects from M1, M3, M5, M6, M9, M10, M11, M13, M15 = 680
Total number of RFC from M1, M3, M5, M6, M9, M10, M11, M13, M15 = 1394
Defects per RFC = 680/1394 = 0.48
MODULES HAVE VALUES
254.7 < RFC < 365
Total number of defects from M2, M4, M8, M14=335
Total number of RFC from M2, M4, M8, M14 = 1210
Defects per RFC = 335/1210 = 0.28
MODULES HAVE VALUES 365 < RFC < 425
Total number of defects from M7, M12, M16, M17, M18 = 204
Total number of RFC from M7, M12, M16, M17, M18 = 1971
Defects per RFC = 204/1971 = 0.1
The results in Table 5 suggest that the value of RFC should be 365 < RFC < 425 to minimums the number of defects/RFC. The graph of Fig.6 presents the WMC values. The average of WMC [which is 590.67] is compared by the maximum suggested by Together Soft, which is 100. It is also interesting to know that the total number of defects from M1 to M6 is greater than the total number of defects from M7 to M18 which is in between the compared values.
MODULES HAVE VALUES 0 < WMC <100
Total number of defects from M12, M18 = 51
Total number of WMC in M12, M18 = 141
Defects per WMC = 51/141 = 0.36
MODULES HAVE VALUES
100 < WMC < 590.67
Total numb e r of defects from M1, M 3 , M7, M9, M 10, M11, M13, M 15, M16 = 651
Total numb e r of WMC from M1, M 3 , M7, M9, M 10, M11, M13, M 15, M16 = 3346
D e fects per WMC = 651/334 6 = 0.05
MODULES HAVE VAL U ES
590.7 < WMC < 164 7
Total numb e r of defects from M2, M 4, M5, M6, M8, M14, M17 = 517
Total number of WMC from M2, M4, M5, M6, M8, M14, M17 = 7145Defects per WMC = 5 17/7145 = 0 . 07
The results in Table 5 advises that t h e value of W MC should be 1 0 0 < WMC < 590.67 for l o w defects/W M C. Table 6 sho w s the summary of the results.
Table 6 : Summary of the Res u lts
|
Sr. # |
C K Metrics |
Findings |
Defect |
|
1 |
CB O |
0 |
0.35/CBO |
|
2 |
DIT |
4.61 |
6.31/DIT |
|
3 |
LC O M |
4119.72 < LCOM < 12132.00 |
0.01/LCO M |
|
4 |
NO C |
68.33 |
0.61/NOC |
|
5 |
RF C |
365 |
0.1/RFC |
|
6 |
WMC |
100 |
0.05/WM C |
Table 7 : Summary of the Mo d el
|
Model |
R |
R Square |
Adjusted R Square |
Std. Error o f the Estimat e |
|
1 |
.830 (a) |
.688 |
.5 1 9 |
50.3663 1 |
Table 8 : Results of ANOVA T est
|
ANOVA (b) |
||||||
|
Model |
Sum of Squares |
df |
Mean Square |
F |
Sig. |
|
|
1 |
Regression |
61671.189 |
6 |
10278.532 |
4.052 |
.022(a) |
|
Residual |
27904.422 |
11 |
2536.766 |
|||
|
Total |
89575.611 |
17 |
||||
1 Predictors: (Constant), WMC, RFC, C8O, NOC, DTT, LCCM b Dependent Variable: Defects
T a ble 9 : Individual Regression Co e fficients
|
Coefficients (•) |
||||||
|
Model |
Un stand ar diced Coefficients |
Standardized Coefficients |
t |
Sig. |
||
|
в |
Std. Error |
Beta |
||||
|
1 |
(Constant) |
32.803 |
103.195 |
.318 |
.757 |
|
|
CBO |
-.652 |
1.545 |
-.121 |
-.422 |
.681 |
|
|
DIT |
13.956 |
17.528 |
.310 |
.796 |
.443 |
|
|
LCOM |
.020 |
.008 |
1.155 |
2.588 |
.025 |
|
|
NOC |
.556 |
.316 |
.469 |
1.760 |
.106 |
|
|
RFC |
-.239 |
.191 |
-.362 |
-1.246 |
.239 |
|
|
WMC |
-.113 |
.084 |
-.715 |
-1.343 |
.206 |
|
|
A Dependent VariaNet Defects |
||||||
a) Predictors: (Constant), WMC, RF C , CBO, NOC, D I T, LCOM
Table 7 s h ows the va l ue of R2 t h at is 0.688 ind i cating that 68.8% of t h e variation in dependent var i able is expl a ined by the i ndependent v ariables. The value of ‘R2’ is 0.688 ind i cates that 6 8.8% of the var i ation in de p endent vari a ble is expl a ined by the independent variables in the li n ear regressi o n.
The ‘F’ value in Table 8 shows var i ance of data ind i cating the s i gnificance o f the derive d model. The authors find the L COM (for m the t-values i n Table 9 for the individual re g ression coef f icients) is th e only metrics that has a significant effec t on the tot a l number of de f ects. The remaining factor c ontributes i n significantly.
Regression Equation
Y = a + β 1X1 + β 2X2 + β 3X 3 + … + β nX n
Y = 32.803 – (0.121* C BO) + ( 0 .31*DIT) + (1.155*LCOM) + (0 . 469*NOC) – (0.362 * RFC) – (0.7 1 5*WMC)
8. Conclusion
It is important to evalu a te quality while designing so ft ware. CK metrics helps t o evaluate d e sign quality. Th e regression a nalysis sho w s that all th e independent var i ables [CBO, DIT, NO C , WMC, R F C] have an insignificant eff e ct on the tot a l number of d efects except LC O M. LCOM i s the only att r ibute that ha s a significant eff e ct on the t o tal number of defect. Rest of the independent var i ables bears a significant effect on the total number o f defects, he n ce the null hypothesis is rej e cted and t h e alternativ e hypothesis is accepted. So f tware develo p ment comp an ies should concentrate on LC O M to control the design d efects. Time f or bug fixing is also collecte d . Once we have predi c ted the total number of defects, we can easily calculate the time req u ired for bug fixing.
References Evaluation of the Design Metric to Reduce the Number of Defects in Software Development
- S. Cara, E. Letha, and U. Dawn, “Computing Software Metrics from Design Documents,” in Proc. of the 42nd Annual Southeast Regional Conference, USA, p. 146-151, 2004.
- J. Capers, Software Quality: Analysis and Guidelines for success, International Thomson Computer Press, USA, 2000.
- S. Ramanath and M. Krishnan, “Empirical Analysis of CK Metrics for Object-Oriented Design Complexity: Implications for Software Defects,” IEEE Transactions on Software Engineering, vol. 29, pp. 297-310, 2003.
- H. T. Richard and J. C. Mark, Software Engineering, The Development Process, Wiley-IEEE Computer Society Press, USA, 2005.
- BORLAND ALM, Available at: http://www.borland.com/us/solutions/index.html (accessed 6 July 2011).
- K. Emam, “A Primer on Object-Oriented Measurement,” in Proc. of the 7th International Symposium on Software Metrics, UK, p. 185-187, 2001.
- S. R. Chidamber and C. F. Kemerer, “A Metrics Suite for Object-Oriented Design,” IEEE Transactions On Software Engineering, vol. 20, pp. 476-493, 1994.
- B. Saida, K. Emam, G. Nishith and N. R. Shesh, “Thresholds for Object-Oriented Measures,” In Proc. 11th International Symposium on Software Reliability Engineering, USA, p.24-38, 2000.
- R. S. Pressman, Software Engineering A practitioner’s Approach, international edition, McGraw Hill, USA, 2005.
- Objecteering / UML, Objecteering / Metrics User Guide Version 5.3, Available at: http://www.objecteering.com/products_packaging.php, (accessed 6 July 2011).
- SD Metrics, “The Software Design Metrics tool for the UML”, Available at: http://www.sdmetrics.com/, (accessed 6 July 2011).
