Evaluation of Using a Recurrent Neural Network (RNN) and a Fuzzy Logic Controller (FLC) In Closed Loop System to Regulate Blood Glucose for Type-1 Diabetic Patients
Автор: Fayrouz Allam, Zaki Nossair, Hesham Gomma, Ibrahim Ibrahim, Mona Abdelsalam
Журнал: International Journal of Intelligent Systems and Applications(IJISA) @ijisa
Статья в выпуске: 10 vol.4, 2012 года.
Бесплатный доступ
Type-1 diabetes is a disease characterized by high blood-glucose level. Using a fully automated closed loop control system improves the quality of life for type1 diabetic patients. In this paper, a scalable closed loop blood glucose regulation system which is tuned to each patient is presented. This control system doesn't need any data entry from the patient. A recurrent neural network (RNN) is used as a nonlinear predictor and a fuzzy logic controller (FLC) is used to determine the insulin dosage which is required to regulate the blood glucose level. The insulin infusion is restricted by calculation of insulin on board (IOB) which avoids overdosing of insulin. The performance of the proposed NMPC is evaluated by applying full day meal regime to each patient. The evaluation includes testing in relation to specific life style condition, i.e. fasting, postprandial, fault meal estimation, and exercise as a metabolic disturbance. Our simulation results indicate that, the use of a RNN along with a FLC can decrease the postprandial glucose concentration. The proposed controller can be used in fasting and can avoid severe hypo or hyper-glycemia during fasting. It can also decrease the postprandial glucose concentration and can dynamically respond to different glycemic challenges.
Type-1 Diabetes, Glucose Contol, RNN, FLC, IOB, Hypo-glycemia, Hyper-glycemia
Короткий адрес: https://sciup.org/15010319
IDR: 15010319
Текст научной статьи Evaluation of Using a Recurrent Neural Network (RNN) and a Fuzzy Logic Controller (FLC) In Closed Loop System to Regulate Blood Glucose for Type-1 Diabetic Patients
Published Online September 2012 in MECS
A closed-loop artificial pancreas has the potential to simultaneously reduce the risks of hypo- and hyperglycemia while also enabling individuals with type 1 diabetes mellitus to maintain a normal lifestyle [1]. In these closed-loop systems, patients must use subcutaneous insulin injection or continuous insulin infusion, combined with infrequent blood glucose measurements, to regulate their blood glucose concentration and reduce the risks of hypo- and hyperglycemia. In essence, these individuals are serving as feedback controllers by themselves with substantial measurement delays and uncertainties [1]. The selfmonitoring requires a considerable effort and is a constant reminder of their disease. The closed loop control systems that use PID [2] prove that, the inability of PID controllers to accommodate system constraints in the computation of the control action further limits their potential for success in closed-loop controlling of type-1 diabetic patients’ glucose without necessitate manual inputs.
When the minimally invasive subcutaneous glucose measurement and subcutaneous insulin delivery are considered, significant delays in predicting blood glucose concentration and delivering insulin to the blood stream introduce additional challenges to the control problem. Predictive framework of the modelbased controllers provides a powerful tool not only to deal with time-delays in the system but also to evaluate the future effects of a meal challenge and thus achieving disturbance rejection. Oruklu et al., [1] proposed an adaptive model predictive control system that used autoregressive moving average (ARMA) model to predict the future glucose concentration. Their model is based on the virtual subject’s glucose concentration obtained from Hovorka model, and they simulate the CGM data by adding Gaussian noise to the synthetic data. The prediction horizon of their model is 30 minutes (6 steps) ahead prediction. Lee et al; [3] developed a constrained model predictive control strategy to reduce the risk of hypo and hyper glycemia, they developed a meal detection and meal size estimation algorithms. Insulin boluses are automatically injected based on the estimated carbohydrates within
30-45 min after meal onsets, the delayed insulin boluses generate slightly higher glucose concentrations than if meal was measured, but it can reduce the postprandial glucose profile for the situations when meals are not announced.
Clarcke [4] proposed a model predictive closed-loop control system which is based on patient’s measured continuous glucose levels. Their system can regulate the overnight and following a standardized breakfast meal as effectively as patient-directed open-loop control following a morning meal but is significantly superior to open-loop control in preventing overnight hypoglycemia. A promising approach to alleviate the problems of the uncertainty of the diabetic patient’s model parameters is the use of fuzzy logic controllers (FLC), which takes into account the uncertainties in the human glucose/insulin kinetics. The uncertain model parameters and model inputs are represented by fuzzy numbers with their shape derived from experimental data or expert knowledge. Many researchers used fuzzy expert system as in [5], used fuzzy expert system to predict diabetes and its risk. M.Kalpana [6] propose a fuzzy expert systems framework which constructs large scale knowledge based system effectively for diabetes, using their system makes the diagnosis of diabetes becomes simple for medical practitioners. Some other researchers used fuzzy logic as a blood glucose level controller, as [7] which used insulin pumps and the application of fuzzy logic controller (FLC) to act as an ‘artificial pancreas’. Ibbini et al; in [8] developed a closed loop control system using fuzzy expert system with the conventional PI controller. They prove that using PI-FLC can lower the peaks of blood glucose than using PI controller or FLC, but using PI with FLC gives a transient response which contains undershoot ( glucose output lower than the reference value ). Yasini et al.; [9] proposed a closed-loop control technique which incorporates expert knowledge about treatment of disease by using Mamdani-type FLC to stabilize the blood glucose concentration in normoglycaemic level of 70 mg/dl. This paper presents a closed loop insulin infusion control system using NMPC technique for glucose regulation in type 1 diabetic patients. The proposed technique uses a recurrent neural network (RNN)[10, 11] as a nonlinear model for prediction of future glucose values, and the FLC to determine the insulin dose required to regulate the blood glucose level, especially after unmeasured meals. The output of the FLC is scaled according to the patient's sensitivity parameters. The scaling factor is changed according to the predicted glucose level. The glucose level is divided into five levels: mild hyperglycemia, severe hyperglycemia, normoglycemia, mild hypoglycemia, and severe hypoglycemia. Prediction of the future glucose concentration helps to overcome the problem of time lag between the instant of subcutaneously injecting insulin and the instant of insulin interaction with the blood glucose. To avoid hypoglycemia, the insulin that still active in the blood (IOB) is calculated and subtracted from the calculated insulin dose. The irreversible effect of insulin is concerned by predicting the effect of the calculated insulin dose on glucose and decrease the dose if a hypoglycemia is predicted. The evaluation of the proposed control system is based on its ability to reduce the postprandial blood glucose level and avoiding hypoglycemia during the day (24 hours). The evaluation is done in simulated physiological conditions such as fasting, postprandial, fault meal estimation, and exercise. The controlled glucose using the proposed controller is compared with a real measured glucose values which represent the controlled glucose using open loop system under the same conditions. The proposed controller can be used during exercise and can respond to the increasing or decreasing any meal. The proposed closed loop control system can enhance the patient’s life because it doesn’t need any data entry from the patient.
II. Subjects and Datasets
Type-1 diabetic patients’ data for this investigation were obtained from two sources, 1) a study of using the Navigator CGM system [12], 2) glucose measurements from 9 patients using Gaurdian® Real Time CGM system (Medtronic-Minimed) which provides a glucose reading every 5 minutes. Training of the RNN was done using 28864 measured glucose samples. The evaluation of the proposed closed loop control technique is investigated using artificial patient that was simulated using Hovorka model [13]. To provide a reference measure, glucose clinical measurements of two patients from DirecrNet [12], who are using an insulin pump therapy as an open loop control system, are used in this paper. The two patients are: patient#2 (43.8 kg, 16 years old female) and patient #3 (76.8 kg, 13 years old male). These patients are chosen to have low and high glucose levels. These patients are simulated in mathematical models using their insulin sensitivities and body weights. The simulation includes 24 hours, and three meals challenges.
III. Closed Loop Control System
The proposed closed loop control system (as shown in Fig.1) consists of a nonlinear predictor (RNN) to predict the future glucose concentration, the predicted glucose level and its derivative are used as inputs to a FLC. The FLC finds the appropriate insulin infusion rate according to its inputs and the fuzzy rules. The insulin that is still active in the blood due to previous boluses (IOB) is calculated and subtracted from the decided insulin infusion rate to avoid overdosing. The effect of the calculated insulin infusion rate on the glucose level during the insulin action time is predicted using the type-1 diabetic patient mathematical model. If the calculated insulin dose will lead to hypoglycemia, it will be reduced to avoid hypoglycemia.
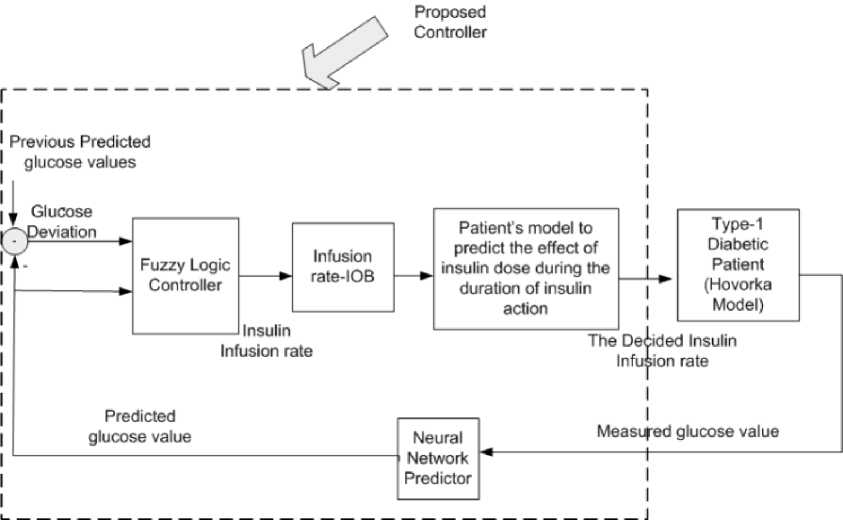
Fig. 1: The structure of the closed loop control system
-
A. RNN Glucose Prediction Model
The prediction model is designed to support the proposed closed loop control system that will need to predict the future glucose values to determine the needed insulin bolus. The RNN [10] is used as a non linear glucose prediction model, the inputs to the RNN is the previous 40 glucose values that obtained from the CGM sensor. The output of RNN is the predicted glucose value. This RNN [10] can predict up to 20 future values of glucose concentration (100 minutes). The evaluation of this prediction model was done in [our paper]. When RNN is used in the proposed control system, the glucose deviation between two successive readings is restricted to 0.2mmol/L [14] to enhance the prediction performance and to be able to use RNN to
-
B. Fuzzy Logic Controller (FLC) design
The main objective of using a fuzzy controller (as in Fig.2) is to maintain the normoglycemic average of plasma glucose concentration and other model variables (e.g. plasma insulin) within a certain acceptable range in spite of the complex physiological model, sudden glucose meal-disturbances, or error in glucose measurements. A table of fuzzy IF-THEN rules that link the input and output MFs is built based on the desired plasma glucose dynamic behavior [9]. Each rule output is demonstrated using MIN-MAX law and each crisp output is computed using CENTROID defuzzification method. The output of the FLC is scaled according to the sensitivity of each patient. The scaling of insulin is also done according to the predicted glucose level.
predict for longer prediction horizons.
Fig.3 and Fig.4 show the membership functions (MFs) of inputs and outputs.
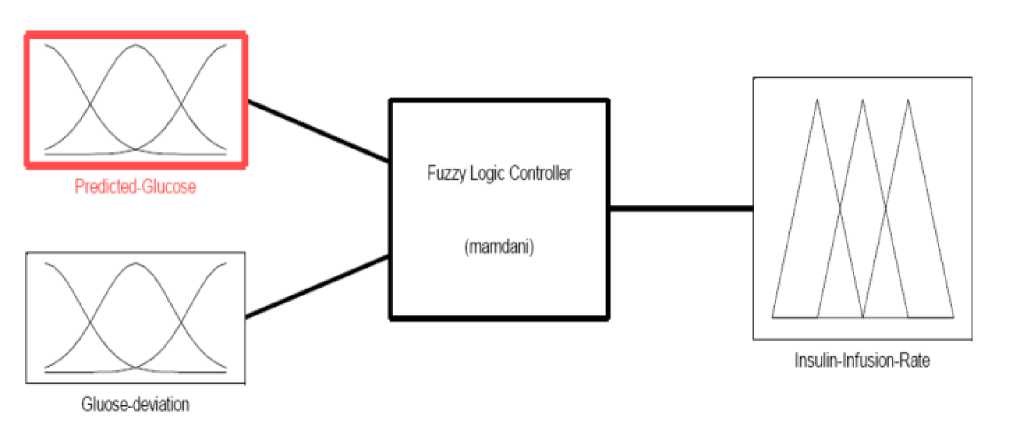
Fig. 2: Structure of the FLC
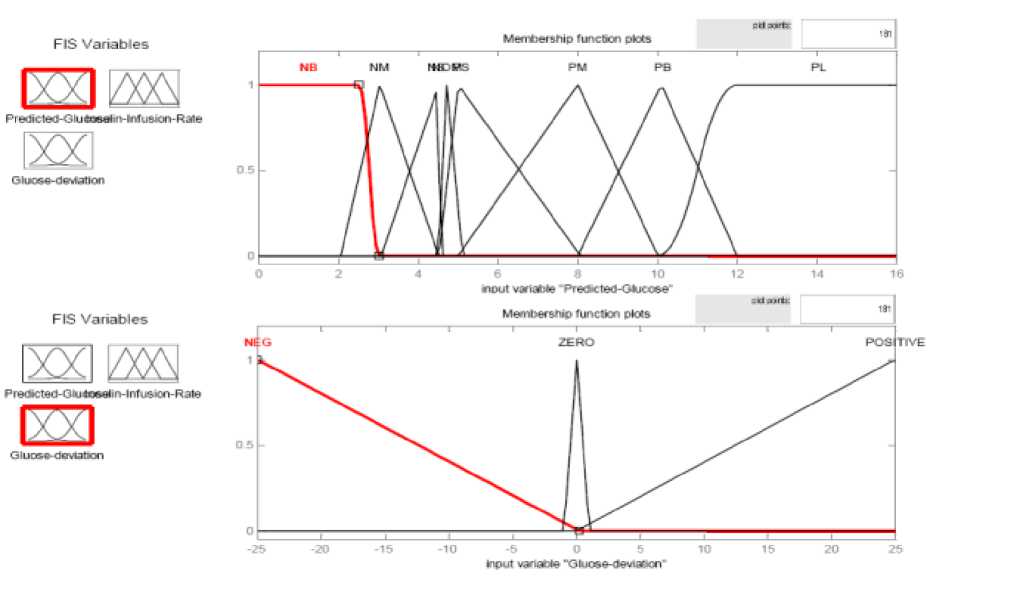
Fig. 3: Membership Functions of the inputs of the FLC
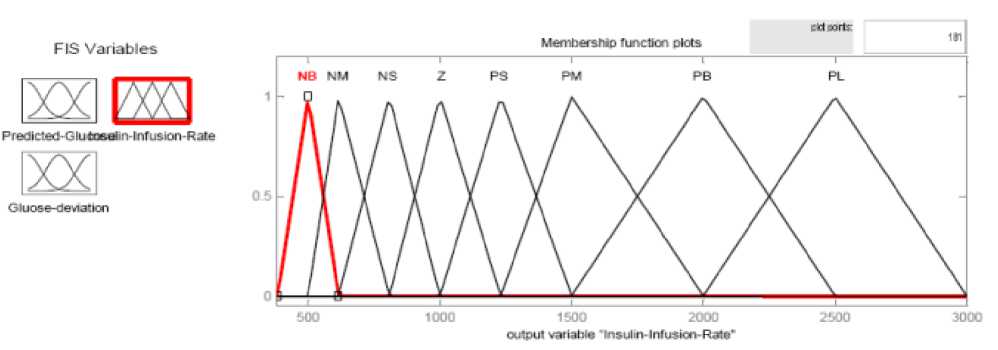
Fig. 4: Membership Functions of the output of the FLC
-
C. Insulin On Board Calculation
Insulin on board (IOB) is an approximation of remaining insulin in the body from previous insulin deliveries. The basal insulin requirement is not included in these calculations. In the proposed control system, the IOB calculations have been included to constraint the maximum allowed insulin delivery rate at each time step. At each time step, the IOB which represents the portion of the bolus that is still active in the blood is calculated as in equation (1) [15].
IOB = V x (T es /T D ) (1)
Where V (insulin units U) is the volume of immediate bolus portion that was delivered, TD is the overall duration of the insulin action, and Tes (min) is the elapsed time since the immediate bolus portion was delivered. The average duration of insulin action is 3½ -4 hours. To decide what is the appropriate insulin dose at sample k, the value of IOB due to the insulin doses that are injected through the insulin action period (all the injected doses during the last 3½ - 4 hours) is calculated at this sample and then subtracted from the current insulin dose. The injected dose is the difference if the difference is positive, and if the difference is negative, a small or zero insulin dose is injected.
-
D. Type-1 Diabetic Patient Hovorka Model
Many physiological models have been proposed that describe the glucose and insulin dynamics in diabetic patients. In this paper, the simulation studies are based on the model developed by Hovorka et al.[13] which will be referred to as the “Hovorka model”. This model is a physiologically based compartment glucoregulatory model described by a set of first-order differential equations. To compare the results that are obtained by the proposed controller with others measured by CGM from real patients [12].
The Hovorka model's sensitivities are tuned, after fitting the scheduled meals and insulin boluses to the model, to have glucose curves near from the measured or real glucose curves. This model which is tuned to fit
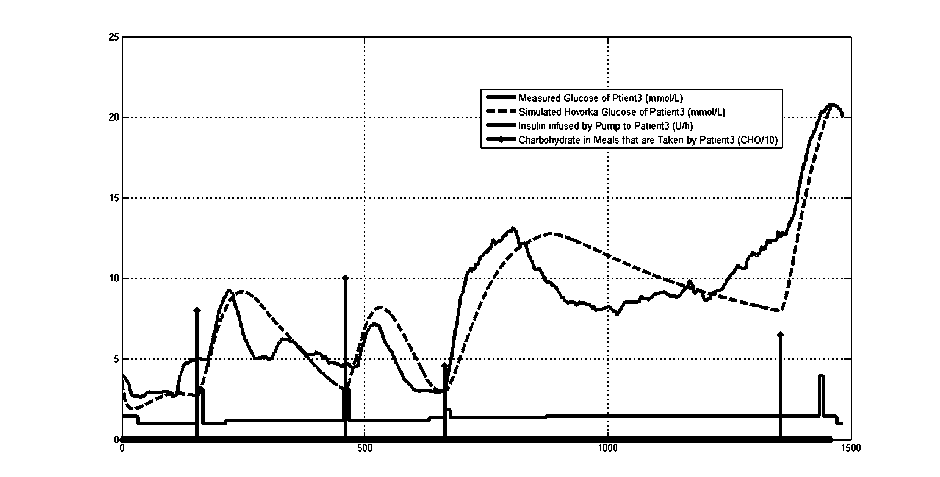
Fig.5: measured glucose, recorded meals and insulin infusion rates for a diabetic patient
the data that was obtained from the real patient is used to represent the patient and to predict the effect of the calculated insulin dose on the patient’s glucose level. The insulin dose is decreased if hypoglycemic event is predicted. Fig.5 shows an example of CGM measurements of a diabetic patient, his scheduled meals, scheduled boluses and the glucose level that are obtained from the tuned Hovorka model after fed with these meals and boluses.
IV. Scaling the Insulin Infusion Rate According to the Predicted Glucose Range
In the proposed control system, the insulin dose is calculated according to the predicted glucose level. Therefore, the glucose range is divided into 4 regions [16]. The scaling concept that is used in this control system is based on the grid method that was used in [16], the grid method divides the glucose level into four regions and uses different safety factor to each region. These regions are: severe hyper-glycemia (>16.66 mmol/L), mild hyper-glycemia (10-16.66 mmol/L), normoglycemia (3.88-10 mmol/L), mild hypoglycemia (2.77-3.88 mmol/L) and severe hypoglycemia (blood glucose<2.77 mmol/L). In the proposed controller, at each glucose region, a different insulin scaling factor is used to scale FLC output. The scaling factors help the control system to avoid severe hyper- and severe hypoglycemic events. The insulin dose is scaled with high scale factor if the glucose is predicted to be severe hyper. Also the insulin dose is scaled to very low scale if the predicted glucose is hypo to avoid the severe hypo- glycemic events.
V. Evaluation of the Closed Loop Control System
The evaluation of the proposed control system is based on the blood glucose control system evaluation mentioned in [17]. The evaluation is based on testing the controller when the patient is fasting and when the patient eats the scheduled meals. The evaluation is also based on simulated metabolic disturbances such as exercise (which is simulated by insulin sensitivity increase) and fault meal estimation (increase and decrease). The evaluation tests the performance stability of the controller during the previous conditions.
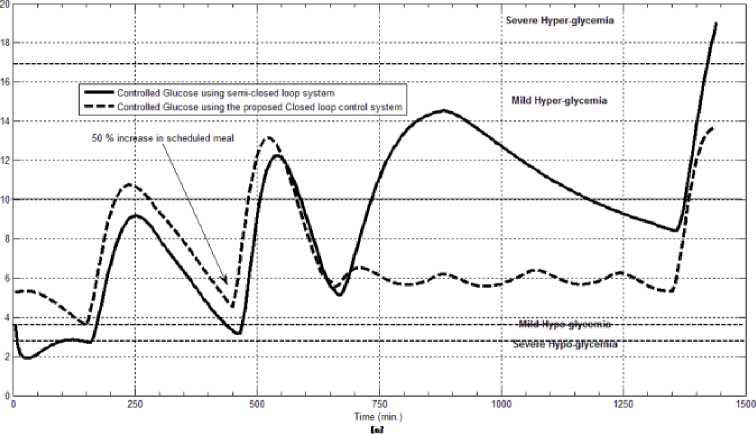
The first evaluation of the proposed closed loop control system is performed by testing it on artificial type-1 diabetic patient of Hovorka model (patient #1). The patient is 45kg weight and eats 4 meals during the day, 40gm CHO breakfast, 54gm CHO lunch, 32gm CHO snack, and 40gm CHO lunch. The starting glucose level of this patient is 7.4mmol/L. The simulation is done during 24 hours to show how that the proposed closed loop control system can regulate the blood glucose level during a normal day. The insulin sensitivities are changed from morning to night to simulate a real case. The evaluation is done in simulated physiological conditions such as fasting, postprandial, fault meal estimation (increasing or decreasing meals), and exercise. Fig.6 shows the results of the evaluation for three cases: fasting, scheduled meals, fault meal estimation, and exercise. The second evaluation of the proposed controller is performed by comparing the controlled glucose using the proposed closed loop control system and the glucose readings which represent the controlled glucose using insulin pump as an open loop system [12]. There are two patients in this evaluation: patient#2 and patient#3 (as mentioned in section II). The Hovorka model's sensitivities are adjusted to simulate these two patients as mentioned in section D. The methodology to evaluate the proposed glucose controller is in three (simulated) physiological conditions: fasting, postprandial, and life style metabolic disturbances such as exercise [17] and fault meal estimation (increasing or decreasing the meals). The meal schedule of patients as in the study of [12] is as follows: Patient#2: breakfast of 55 gm CHO at 12:20 PM, Lunch of 65.3gm CHO at 4:20 PM, snack of 32gm CHO at10:12 PM, and a breakfast of 53.89gm CHO at the next day at 7:50 AM. Patient#3: breakfast of 80 gm CHO at12:02 PM , Lunch of 100 CHO at 5:03 PM, snack of 46 CHO at 8:24 PM. The exercise is simulated by increasing the sensitivity. This sensitivity change can be from 5% to 40% according to the strength of exercise as mentioned in [18]. In the evaluation of the proposed control system, the sensitivity is increased by 5% and 40% in Hovoka model to simulate the full range of exercise. The results of the proposed control system is compared with that obtained by open loop control system (insulin pump therapy) under the same conditions of fasting, normal day, sensitivity changes as shown in Fig.7 and Fig. 8.
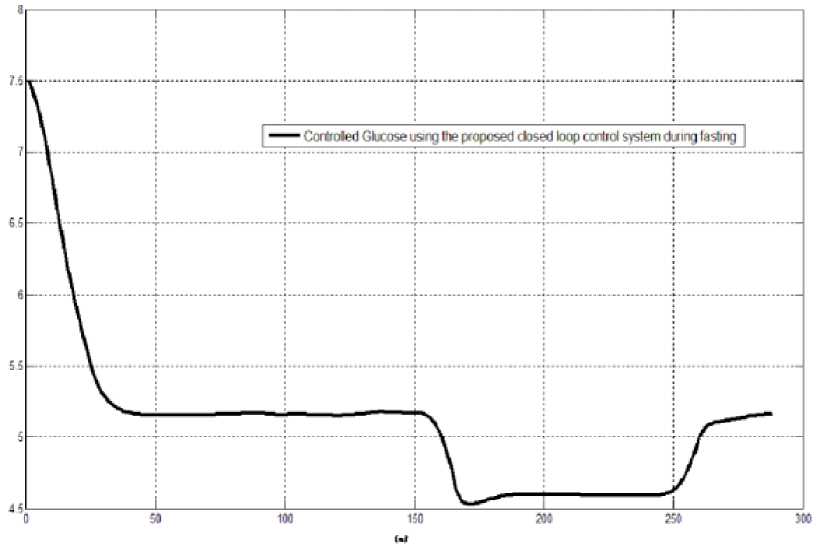
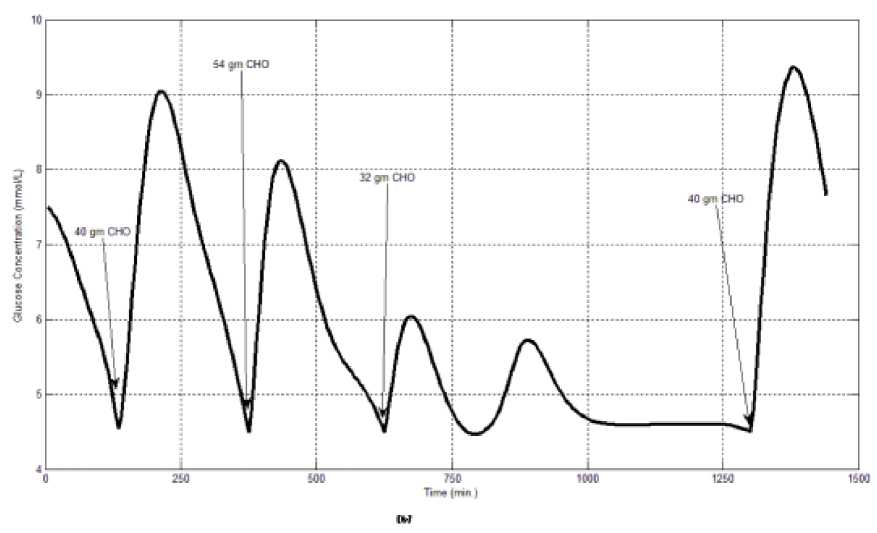
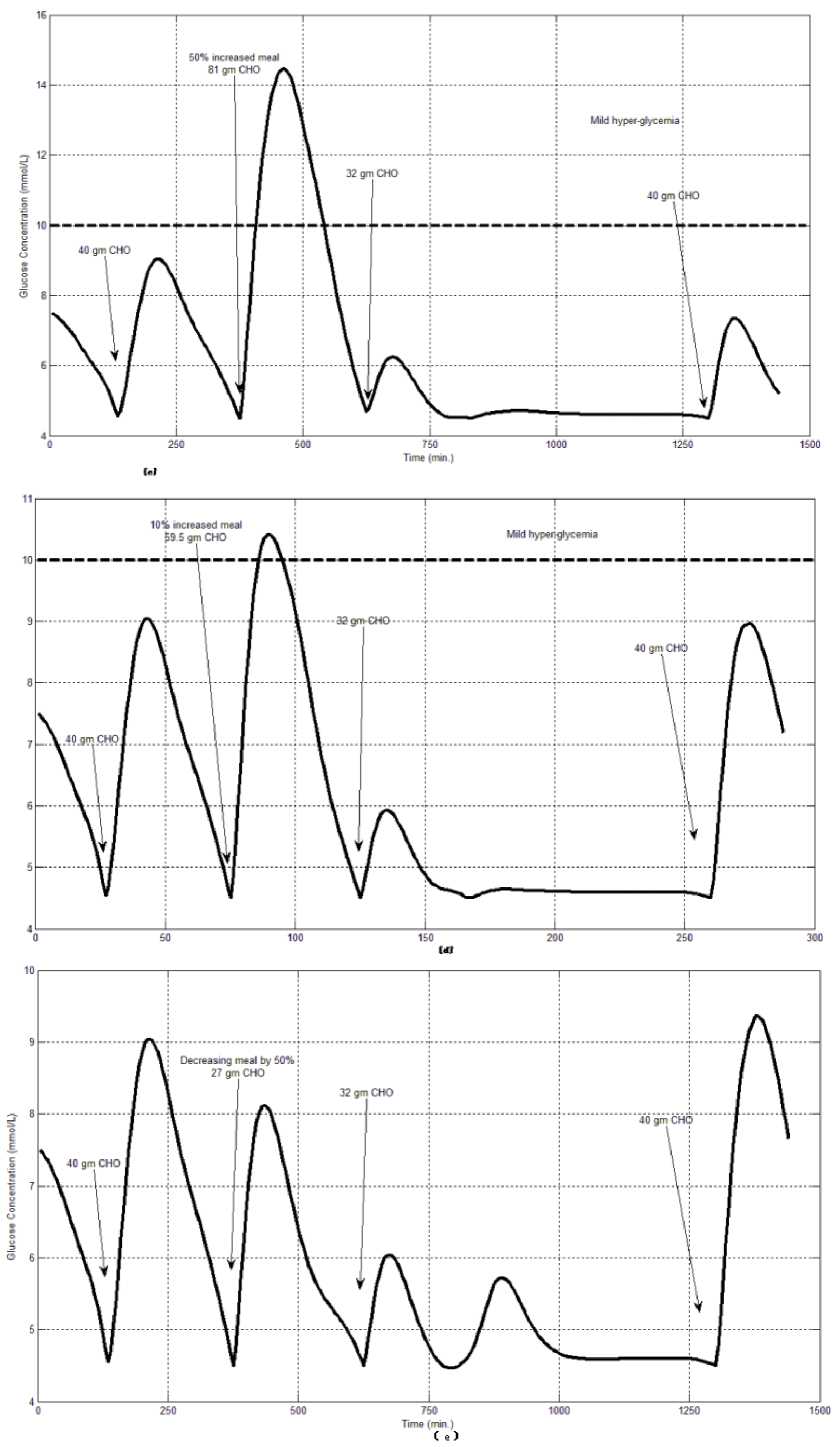
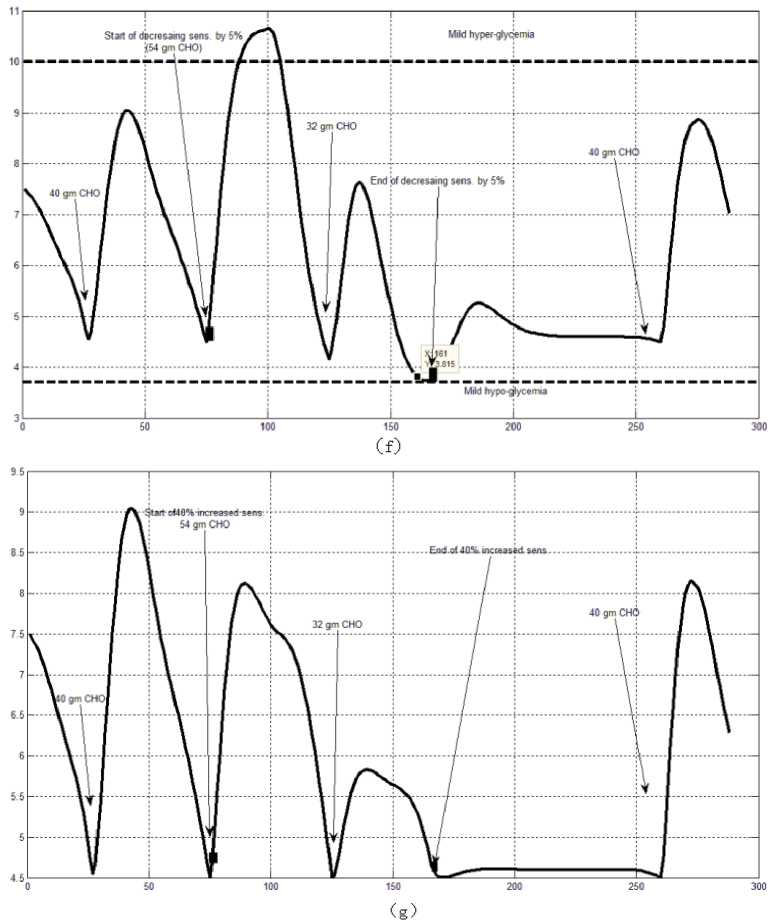
Fig.6: the controlled glucose of patient #1 using the proposed control system for (a) fasting (no meals), (b) scheduled meals, (c) 50% increasing in a meal, (d) 10% increasing in a meal,
(e) 10% decreasing a meal, (f) 5% increasing the sensitivity, (g) 40% increasing the sensitivity(increasing the sensitivity).
Conf rolled Farting Glucrose (mmoUL)
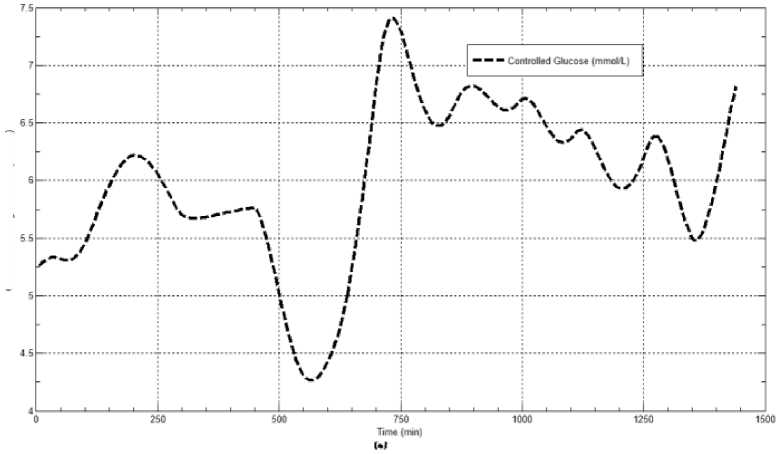
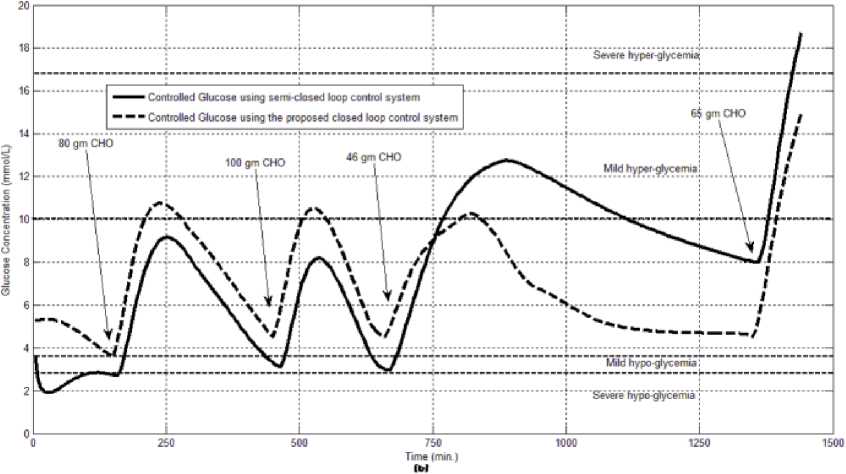
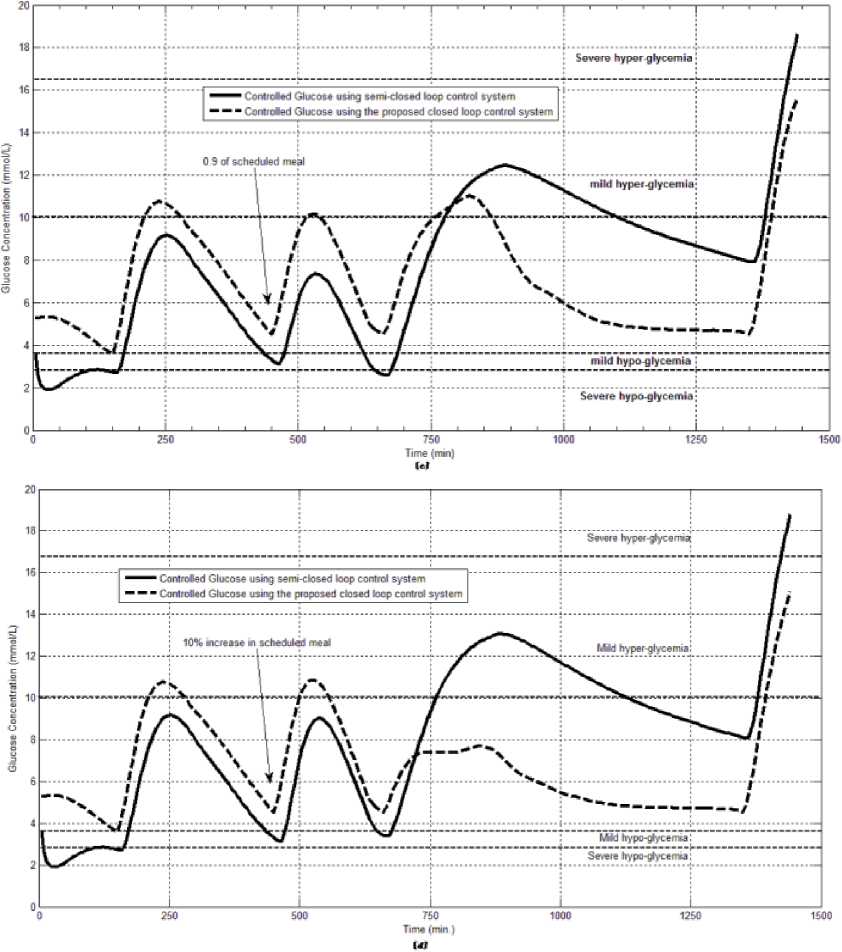
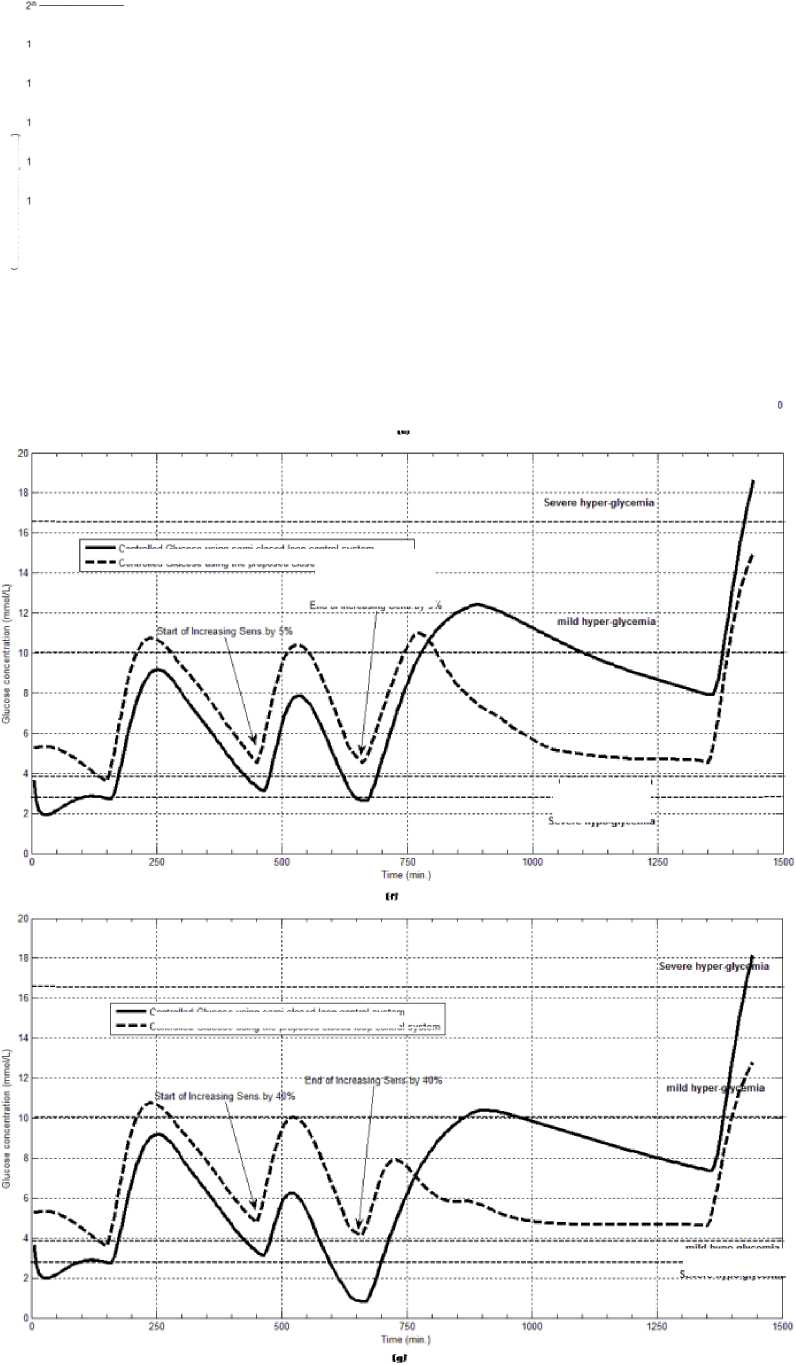
Fig.7: The controlled glucose for patient #2 using the proposed control system for (a) fasting (no meals), (b) scheduled meals, (c) 50% increasing in the second meal, (d) 10% increasing in the second meal, (e) 10% decreasing in the second meal, (f) 5% increasing in the sensitivity, (g) 40% increasing in the sensitivity
Glucose concentration (mmoUL)
Controlled Glucose using seme-closed loop control system
Controlled Glucose using the proposed closed loop control system
End of Increasmg SenB by 54
тТУБуро-дТусннГа
Severe hypo giveemi
Controlled Glucose using serre-closed loop control system
Controlled Glucose using the proposed closed loop control system
mild hypo glycemia
Sewte bypogtycemi ।
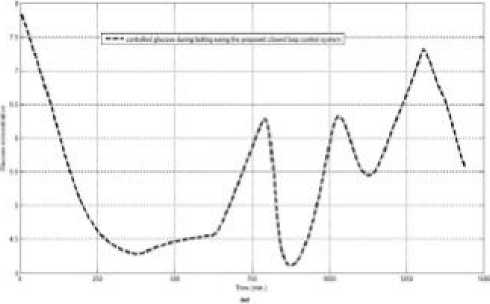


Fig.8: the controlled glucose for patient #3 using the proposed control system for (a) fasting (no meals), (b) scheduled meals, (c) 50% increasing in a meal, (d) 10% increasing in a meal, (e) 10% decreasing a meal, (f) 5% increasing the sensitivity, (g) 40% increasing the sensitivity
VI. Assessing the Proposed Control System
The glucose control is evaluated using performance measures as shown in tables (1, 2). These performance measures, as in [16], are: Per-subject average of glucose readings (mmol/L), average of per-subject glucose values (mmol/L) during the 60 minute period prior to meal times (pre-meal BG), Average of per-subject glucose values(mmol/L) over one hour beginning 60 minutes after a given meal (post-meal BG), Percentage of time (per-subject) spent with a glucose level less than or equal to 2.77(mmol/L), percentage of time (persubject) spent with a glucose level less than or equal to 3.88 (mmol/L), percentage of time (per-subject) spent with a glucose level within the user specified target range, percentage of time (per-subject) spent with a glucose level greater than 10 (mmol/L), percentage of time (per-subject) spent with a glucose level greater than 16.66 (mmol/L). Table (1) shows the performance measures of the proposed controller when it is tested on artificial diabetic patient (patient#1). Table (2) shows a comparison between the performance of the proposed closed loop control and the open loop control. All values in these tables are the average of all the tested scenarios.
Table 1: Performance Measures of the Proposed Control System for Patient#1
|
■№ |
o/o |
<№ |
% |
<№ |
Pre-meal |
Post-meal |
|
|
Time |
Time |
Time |
Time |
Time |
mean |
mean |
|
|
и PQ с |
BG |
BG |
BG |
BG |
BG |
BG |
BG |
|
5 |
<=2.77 Severe |
(2.773.88) Mild hypo |
(3.88-10) (normoglycemia) |
(10-16.66) Hyper |
>16.66 Severe |
mmol/L |
mmol/L |
|
6 |
0 |
0.5 |
96.3 |
3.12 |
0 |
5.7 |
7.14 |
Table 2: Performance Measures of the Proposed Control System and Open Loop Control System for Patien#2 and patient#3
|
Patient |
BG |
% Time BG <=2.77 Severe |
% Time BG (2.773.88) Mad hypo |
% BG (3.88-10) (normoglycemia) |
% BG (10-16.66) |
% Time BG >16.66 Severe-hyper |
Pre-meal mean BG mmol/L |
Post mean BG mmol/L |
|
s [ s e I |
6.88 |
0 |
0.65 |
84.31 |
14.2 |
0 |
5.55 |
7.5 |
|
g t |
7.88 |
9.18 |
9.75 |
52.66 |
52.66 |
1.32 |
5.29 |
6.32 |
|
111 sei |
7 |
0 |
0.11 |
84.08 |
15.7 |
0 |
6.39 |
7.72 |
|
12.22 |
0 |
0.11 |
24.3 |
61.4 |
14 |
10.44 |
12.22 |
VII. Discussion
VIII. Conclusion
The proposed closed loop control system can regulate the blood glucose of type-1 diabetic patients during the fasting, scheduled meals, fault meal estimation and exercise. The system is tuned to each patient. Calculation of IOB and prediction of the effect of each calculated dose on the future of the blood glucose level during the period of insulin action will lead to excluding sever hyper and severe hypo-glycemic event.
Список литературы Evaluation of Using a Recurrent Neural Network (RNN) and a Fuzzy Logic Controller (FLC) In Closed Loop System to Regulate Blood Glucose for Type-1 Diabetic Patients
- Oruklu ME, Cinar A, Quinn L, Smith D. Adaptive control strategy for regulation of blood glucose levels in patients with type 1 diabetes. Journal of Process Control 2009; 19: 1333~1346.
- Renard E, Costalat G, Chevassus H, Bringer J. Closed loop insulin delivery using implanted insulin pumps and sensors in type 1 diabetic patients. Diabetes Res. Clin. Pract. 2006; 74: S173~S177.
- Lee H, Wayne B. A Closed-loop Artificial Pancreas based on MPC: human-friendly identification and automatic meal disturbance rejection. Proceedings of the 17th World Congress. The International Federation of Automatic Control Seoul 2008; 6~11.
- Clarke WL, Anderson S, Breton M, Patek S, Kashmer L, Kovatchev B. Closed-Loop Artificial Pancreas Using Subcutaneous Glucose Sensing and Insulin Delivery and a Model Predictive Control Algorithm: The Virginia Experience. Journal of Diabetes Science and Technology 2009; 3 (5): 1031~1038.
- Rama E, Nagaveni N. Design Methodology of a Fuzzy Knowledgebase System to predict the risk of Diabetic Nephropathy. IJCSI International Journal of Computer Science Issues 2010; 7(5): 1694~0814.
- Kalpana M, Kumar AV. Fuzzy Expert System for Diabetes using Fuzzy Verdict Mechanism. Int. J. Advanced Networking and Applications 2011; 3(2):1128~1134.
- Grant P. A new approach to diabetic control: Fuzzy logic and insulin pump technology. Medical Engineering & Physics 2007; 29: 824~827.
- IBBINI M. A PI-fuzzy logic controller for the regulation of blood glucose level in diabetic patients. Journal of Medical Engineering & Technology 2006; 30(2): 83 ~ 92.
- Yasini Sh, Naghibi-Sistani MB, Karimpour A. Active Insulin Infusion Using Fuzzy-Based Closed-loop Control. 3rd International Conference on Intelligent System and Knowledge Engineering 2008; 429~434.
- Allam F, Nossair Z, Gomma H, Ibrahim I, Abdelsalam M. A Recurrent Neural Network Approach for Predicting Glucose Concentration in Type-1 Diabetic Patients. EANN/AIAI 2011, Part I, IFIP AICT 2011; 363: 254~259.
- Allam F, Nossair Z, Gomma H, Ibrahim I, and Abdelsalam Mona. Prediction of Subcutaneous Glucose Concentration for Type-1 Diabetic Patients Using a Feed Forward Neural Network. International Conference on Computer Engineering & Systems (ICCES’2011) 2011; 129-133.
- Diabetes Research in Children Network (DirecNet), Mar. 11, 2009, [Online]. Available: http://public.direc.net
- Hovorka R et al.; Nonlinear model predictive control of glucose concentration in subjects with type 1 diabetes. Physiological Measurements 2004; 25(4): 905~920.
- Dunn C, Eastman C, Tamada A. Rates of Glucose Change Measured by Blood Glucose Meter and the GlucoWatch Biographer During Day, Night, and Around Mealtimes. DIABETES CARE. 27 (9),September 2004.
- Campbell et al., Calculating insulin on board extended bolus being delivered by an insulin delivery device. United States Patent Application Publication, Jan. 21, 2010.
- Kovatchev B, Breton M, Dalla Man C, and Cobelli C. In silico preclinical trials: a proof of concept in closed-loop control of type 1 diabetes. Journal of Diabetes Science and Technology, 3: (44~85), 2009.
- Chassin J, Wilinska E, Hovorka R. Evaluation of glucose controllers in virtual environment: methodology and sample application. Artificial Intelligence in Medicine, 32: 171~ 181, 2004.
- Davey G, Roberts J, Patel S, Pierpoint T, Godsland I, Davies B and Mckeigue P M. Effects Of Exercise On Insulin Resistance In South Asians And Europeans. An International Electronic Journal. 3(2), April 2000.

