Evaluation of water bioresources management efficiency in domestic fishing industry

Author: Mikhailova Elena G.
Journal: Economic and Social Changes: Facts, Trends, Forecast @volnc-esc-en
Section: Branch-wise economy
Article in issue: 1 (55) т.11, 2018.
Free access
Efficient use of natural resources is an integral part of sustainable development. Resource management efficiency criteria should cover all components of sustainable development: economic, environmental and social. The purpose for the study is to assess the possibility of applying tools for measuring natural resources management efficiency in relation to water biological resources. The most developed are methodological approaches to assessing the economic efficiency of resource management. Despite the importance of environmental assessment and the availability of the methodological framework, there still remain some gaps in data availability for analyzing the impact of the fishing industry on the environment. The specific features of natural resources extraction and processing are particularly evident in indicators of environmental efficiency of resource saving. The paper substantiates the importance of taking into account emissions of water bioresources, unreported fishing, technological losses in assessing water bioresources management efficiency...
Water bioresources, fishing industry, efficiency, resource efficiency, eco-efficiency, decoupling
Short address: https://sciup.org/147224027
IDR: 147224027 | UDC: 338.001.36 | DOI: 10.15838/esc.2018.1.55.4
Text of the scientific article Evaluation of water bioresources management efficiency in domestic fishing industry
The issue of resource saving can currently be considered global. The WWF Living Planet Report 2016 notes that humanity began to consume 1.6 times more than our planet is able to sustainably reproduce [1]. A 58% decline in the global Living Planet Index (LPI) during 1970–2012 is a matter of great concern. During this period, LPI for freshwater species decreased by 81%, for marine species – by 36%. One of the main reasons for going beyond planetary boundaries is production of food on a scale leading to habitat degradation and overexploitation of natural resources, including: overfishing of water bioresources (WBR), which undermines the foundations of sustainable development.
The studies related to the issue of resource friendliness, primarily natural, or primary, creating the framework for life are carried out most often in the context of the concept of “sustainable development”. At the same time, at all levels of administration, the transition of economic systems to sustainable development is directly related to resource saving: rising prosperity should be provided by fewer amounts of resources used and by reducing the impact on the environment.
Resource saving should be seen as a tool for ensuring the economic future of the society, as well as its environmental and social well-being.
This approach has already been adopted by several international organizations. For example, the international Resource Efficient and Cleaner Production (RECP) Program aims to improve resource efficiency and reduce risks to human beings and the environment [2]. The three main areas of the program are consistent with the triad of sustainable development goals: economic production efficiency through rational use of natural resources; environmental management which involves minimizing the impact on the environment and nature, prevention of waste and pollutant emissions; human development through minimizing the risks to people and communities from enterprise activities.
In Russia, resource saving is also included in the list of strategic development goals [3, 4]. The list of main goals of the state environmental policy includes measures to reduce pollution from emissions, dumps and wastes, as well as reduce the share of energy and resource intensity of products and services. The goal is to ensure sustainable use of natural resources, involving renewable resources, such as WBR, primarily their sustainable use [5, 6].
Water bioresources play an important role in ensuring the country’s food security: fish proteins comprise 10% in the overall balance of animal protein consumption, in the meat and fish consumption balance – about 25% [7].
The well-being of many inhabitants of coastal Russian territories, where fishing and fish processing enterprises are often settlement-and city-forming, depends on the efficiency of using WBR. In many areas of the Far East and the Far North production of WBR remains a major source of live support, particularly for indigenous minorities. Accordingly, rational use of WBR should be related to strategic goals of sustainable development of Russia’s fishing industry.
To study the possibility of using theoretically justified tools for assessing the effectiveness of using WBR the following objectives were set: review the existing approaches to assessing the use of natural resources in general and to WBR; identify criteria for economic, social and environmental efficiency; quantify the indicators of performance; summarize the obtained results and identify the possibility of using decoupling in assessing the resource efficiency in the fishing industries.
Research methods and methodology
Considering the issues of resource saving at different management levels and for resources different in nature and type, the authors interpret the nature and content of the category “resource saving” in different ways [8, 9]. However, the researchers note that resource saving can not be considered only as saving raw materials. It is important to take into account their rational use – the use of resources which ensures the socio-economic development and reduces the burden on the natural environment, which, in turn, improves the quality of the natural environment as a human habitat [10].
Based on the concept of sustainable development we believe that the assessment of natural resource management, in addition to the economic and environmental aspects mentioned above, should take into account the social component of resource use. All these aspects cannot be covered by a single indicator; it is necessary to establish a system of indicators reflecting the triad of sustainable development.
Resource productivity as an integrated quantitative assessment of the economy at the international [11] and regional [12, 13] level is widely used in the scientific community. In the case of natural resources, their use efficiency and productivity are often used as synonyms. In the most general terms it is represented as the ratio of forward resource flows to backward resource flows of the economic system [14] or the correlation of the result with the costs providing it [15]. The indicators of resource efficiency calculated as the ratio of the used resources to GDP, are often called direct, other indicators indirectly reflect the results of resource saving [16].
Resource productivity can be calculated several ways. The first one is by using the performance index showing the amount of product’s added value per one unit mass of resource input. The second – technical efficiency reflecting the ratio of production volume to the amount of used resources (both indicators are measured in real terms). The third – economic efficiency, i.e. the ratio of the cost of “inputs” to the cost of used forward resources in the production system. The third way of calculating resource productivity is often used as a synonym to material efficiency.
The integrating indicator of economic efficiency of using material resources including natural resources is production material efficiency. However, the indicator of material efficiency has a number of disadvantages. First, it does not take into account resource wastes and losses at different flow stages (from extraction to consuming). Second, the rate of material efficiency may change under the influence of factors which are indirectly related to resource saving activities, for example, as a result of price fluctuations. Third, the most important drawback concerns the loss of the basic principle of determining economic efficiency – the comparability of the result with the costs which cause this result.
According to L.L. Kamenik [9], in order to eliminate these drawbacks it is possible to use the indicator of useful consumption of material resources: the numerator indicates the cost of useful resource consumption, the denominator – the cost of all used resources. This approach makes it possible to move from material costs efficiency to material resource efficiency.
Despite the obvious advantages of the indicator of useful consumption compared to material consumption, it has its disadvantages. First, the use of such an indicator requires appropriate accounting at all levels of administration. Second, complex and heterogeneous resources like WBR make assessment of applied resources even more difficult. Thus, if raw fish is processed some of its parts – trunk, hard roe, milt, and liver – have different cost many times higher than the cost of raw fish. It is quite possible that comparative efficiency of salmonid fillet production may be less than that of production of granular caviar due to higher consumption value of caviar. The paradox of assessment stems from the features of salmonids: the price of ungutted fish of several times less than the price of caviar inside.
Recognizing the identified drawbacks of the indicator of material efficiency and, accordingly, its aggregate indicators such as raw materials efficiency and fuel efficiency, we note that amid current domestic system of cost and result accounting it remains almost the only cost indicator assessing the economic efficiency of resource management.
To assess the efficiency of using WBR at the meso level it is necessary to use in addition to material efficiency which still reflects costeffectiveness, the indicator of resource efficiency defined as the ratio of resources produced to gross value added (GVA) in comparable prices.
In addition, as noted by A.M. Vasil’ev, it is the growth of value added per ton of extracted bioresources that most fully reflects their rational use [16].
In many foreign methodologies, the role of key indicator of resource efficiency belongs to resource productivity is estimated as the ratio of economic result (GDP – Gross Domestic Product ) to domestic material consumption (DMC). The use of this indicator as a key one has many drawbacks; according to experts, it is “not perfect, but practical” [17]. Its practicality consists not only in providing reliable long-term statistics, but also in the opportunity to visually reflect the effect of decoupling in the economy.
The concept of decoupling, describing the development where economic growth takes place without declining environmental performance, is based on the concept of ecoefficient economic growth. The term “ecoefficiency” was for the first time used in 1992 to characterize economic growth achieved by providing competitive goods and services which meet human needs and ensure the required quality of life by gradually reducing the impact on the environment and reducing the intensity of resource use throughout the whole life cycle of goods/services [19]. As a rule, eco-efficiency is quantified by the ratio of value added to the extent of environmental damage. To date, numerous variations of this approach have been proposed [20].
The practical and theoretical significance of eco-efficiency lies in the ability of this indicator to combine productivity by two out of three axes of sustainable development: the environment and the economy. According to some researchers [21], despite the existing problems in calculating both environmental impact indicators and economic results, eco-efficiency can be a useful tool for entrepreneurs and politicians. The concept of decoupling is widely used by domestic researchers for assessing the environmental and economic efficiency of the regional economy [22, 23, 24].
When it comes to evaluating decoupling, resource decoupling and impact decoupling are generally distinguished [25]. In the first case one could speak of “dematerialization” of economy, increase in resource productivity, i.e. declining rates of primary resource use with the same economic result: larger volume of added value falls on a unit of the used resources. The impact decoupling reflects the growth of eco-efficiency and involves an increase in production with reducing negative impact on the environment with the extraction of natural resources.
Domestic scientists interpret the decoupling effect in indicators of environmental capacity, which reflect the costs of natural resources and pollution per unit of final result, usually GDP [26]. The first form of the indicators of environmental capacity – the costs of natural resources per unit of final output – reflects the efficiency of using natural resources at all stages of production process and corresponds to resource decoupling. The second form – specific values of pollution per unit of final product – demonstrates pollutant emission intensity, which corresponds to the decoupling effect.
Negative environmental impacts in the fishing industry arise from the destruction of the seabed during trawling, pollution of the water area with fuel. Poaching causes especially serious damage to WBR. Illegal fishing can reach 11–26 million tons per year, which is 12–28% of the world’s annual catch [27]. Another global problem is the loss of fish at the field stage. According to experts of the Food and Agriculture Organization (FAO), 27% of unloaded fish is lost due to losses or spoilage between the stages of unloading and consumption. The third equally important issue concerns discarding of fish – about 8% of catches [28]. The real amount of catches of WBR is much higher than official data.
It is difficult to use the above estimates of WBR losses to analyze the management efficiency since such estimates are of a momentary nature, they often cannot be compared in dynamics due to different calculation methods used by experts. The current statistics of environmental protection at the macro level in our country to date does not cover all types of economic activity. Fishing industries and fish farming are not mentioned in terms of a negative impact on the environment neither by emissions of atmospheric pollutants, nor by waste water discharge, nor by waste generation and discharge.
The existing gaps in the availability of statistics in the fishing industry prevent the full use of the decoupling technique; it is necessary to continue working on the development of indicators. The possible indicators for assessing decoupling are WBR catches and manufacture of fish products compared with to consumption [29]. However, such an approach reflects the resources consumed, rather than the impact on the environment.
Taking into account the fact that the most significant fuel consumption is carried out at the time of the active part – trawling – we present the duration of trawling as a proxy indicator of environmental damage from pollutant emissions. Based on vessel time budget provided by the sectoral monitoring system (Federal Fishery Agency – FAR) it is possible to determine the duration of trawling as an indicator of the negative impact on the environment: the less hours of trawling providing bigger catch fishing, the better are the fishing results. Accordingly, we suggest using the ratio of the catch amount to the trawling period as an indicator of ecoefficiency. Such an indicator is the closest to the indicators of industrial fishing efficiency in content [30].
The social efficiency of using WBR should take into account both the fishing industry itself and consumption. If the interests of the industry workers are considered, social efficiency can be reflected by the ratio of average wage in the industry to average wage in the country (industry wage lead factor) [31].
Social efficiency can also express the interests of consumers of fish products. With advanced increase in real income over growth, let alone the falling price of fish products, consumers will be able to conditionally receive additional “income” or benefit. In case of equal income and price growth, the index equals unity (no gain, no loss); in case of faster growth of consumer prices consumers “lose”. The gain index of consumers of fish products is defined as the ratio of the growth rate of real disposable money income of the population to consumer price index for fish and fish products.
The specific features of extraction and processing of natural resources is particularly evident in the indicators of eco-efficiency of using WBR. Lack of complete and reliable information about the impact of economic activities on the environment seriously affects the accuracy of both environmental (waste efficiency, pollution intensity) and economic indicators (resource efficiency, material efficiency) of efficiency. Therefore, efficient use of WBR will be overestimated distorting the real trend of resource exploitation.
Discussion
The calculation of aggregated indicators of efficiency of using WBR has been carried out during 2010–2015.The choice of the time period is due to both availability of recent data and the need to take into account the comparability of individual indicators due to changes in the methodology of statistical accounting. The most significant for the research is the adjustment of data on the extraction of fishery products into line with the all-Russian classification of products by activity in 2010.
The economic efficiency of using material resources in domestic fisheries ( Tab. ) despite a certain slowdown in 2011–2012, tends to increase. In 2015, material efficiency was 31% higher than in 2010, both revenue and cost increased. However, revenue growth rates were ahead of the cost and material expenditures growth rates (with the exception of 2011 and 2012). This has affected the positive dynamics of material efficiency. The fuel efficiency
Performance of material efficiency and fuel efficiency in the fishing industry in Russia
|
Indicator |
2010 |
2011 |
2012 |
2013 |
2014 |
2015 |
|
Material efficiency |
2.79 |
2.61 |
2.44 |
2.60 |
2.92 |
3.65 |
|
Fuel efficiency |
5.97 |
5.60 |
5.33 |
5.88 |
7.03 |
10.46 |
Source: calculated by the author according to the Federal State Statistics Service of the Russian Federation.
increased especially noticeably – almost 2 times to the level of 2010. With the overall growth in material expenditures (by 3% during 6 years), the share of fuel expenditures in the cost structure decreased by 5%. The growth rate of fuel expenditures significantly lagged behind the growth rate, the cost, and material expenditures, which in general influenced the positive performance of fuel efficiency.
Assessment of the resource efficiency of WBR demonstrating how much gross value added is created using one unit of resource is shown in Figure 1 . The performance of resource efficiency has a positive trend. In 2015, each harvested kilogram of WBR has brought the national fisheries 26 rubles of value added. On average, the annual growth rate of resource efficiency for the period under review was not more than 2%.
To identify the effect of resource decoupling in the fishing industry in Russia the following indicators are used:
-
• GVA created in fisheries reflecting the economic result (data provided to the prices of 2010);
-
• catch of WBR characterizing the used resources.
As can be seen in Figure 2 , synchronous change in the economic result and WBR catch does not confirm resource decoupling in fisheries. The coefficient of correlation between these indicators is 0.84, which indicates a strong positive relations between WBR and production volumes.
The fishing industry demonstrates fluctuating trends in growth rates of WBR catch and GVA performance ( Fig. 3 ), growth rates of WR catch exceed GVA growth rates in 2011 and 2014. Thus, no absolute resource decoupling has been revealed during the period under review. In some years – 2012, 2013, 2015 – relative resource decoupling is observed. Water bioresources detected during these periods are used most efficiently (see Fig. 1).
Figure 1. Performance of resource efficiency in the fishing industry in Russia, rubles/kg
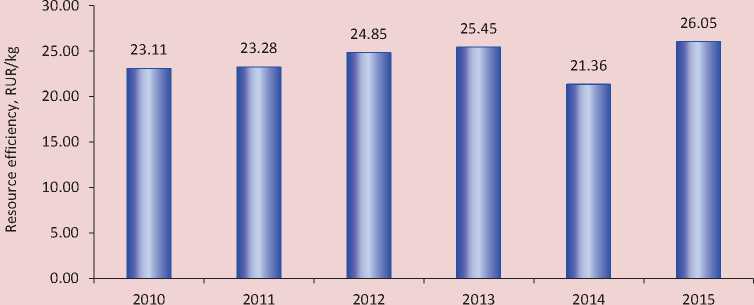
Source: calculated by the author based on: official website of the Federal State Statistics Service of the Russian Federation. Available at: ; FAR official website. Available at:
Figure 2. Performance of WBR catch and performance of GVA in fisheries in Russia, thousand tons
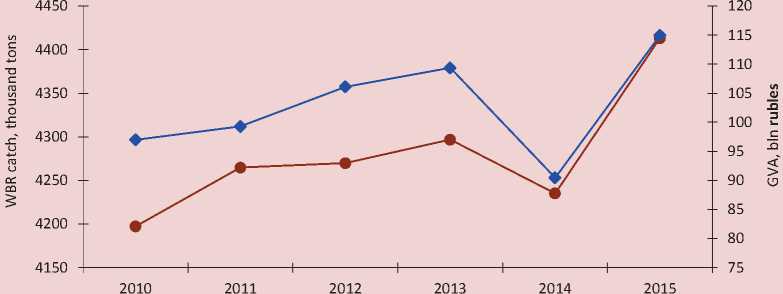
—•— WBR catch in Russia, thousand tons ж GVA in fisheries, billion rubles in the prices of 2010
Source: compiled from: official website of the Federal State Statistics Service of the Russian Federation. Available at: ; FAR official website. Available at:
Figure 3. Performance of GVA growth rate in fishing and WBR catch in Russia, %
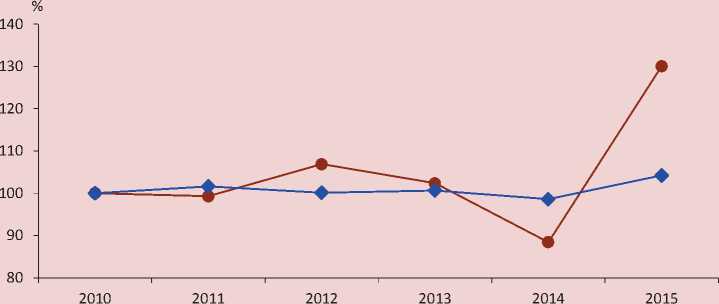
—•— GVA growth rate
— ♦ — WBR catch growth rate
Source: calculated by the author from: official website of the Federal State Statistics Service of the Russian Federation. Available at: ; FAR official website. Available at:
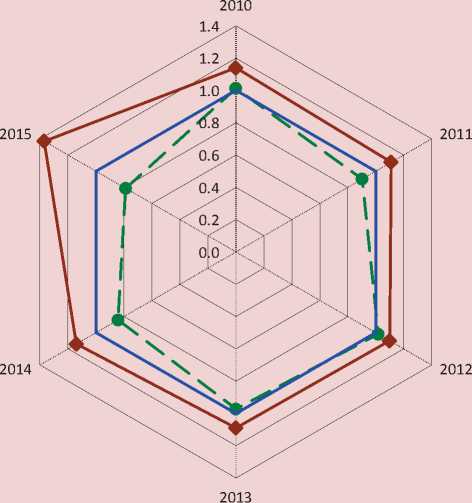
In order to study of eco-efficiency determined by the WBR catch produced per hour of trawling we use data on pollock fishing. It is pollock that for a long time has been the most significant object of fishing in Russia: its share in the total WBR catch is about 40%. As can be seen in Figure 4, over the past six years the eco-efficiency of pollock fishing has increased. In 2010, as a result of one hour of trawling 1.14 tons of pollock was extracted;
Figure 4. Pollock fishing eco-efficiency
-
1.8 q
-
1.6 - ----- ----- ----

-
1.4 - _____
-
1.2 - _____
-
1.0 -
-
0.8 -
-
0.6 -
-
0.4 -
-
0.2 -
-
0.0 -1--------- ------- ---------т--------- ------- ---------т--------- ------- ---------т--------- ------- ---------т--------- ------- ---------т--------- -------
2010 2011 2012 2013 2014 2015
Source: calculated by the author from: data of the sectoral monitoring system Federal Agency for Fisheries of the Russian Federation; FAR official website. Available at:
Figure 5. Ratio of growth rates of marketable pollock products to time spent on pollock trawling

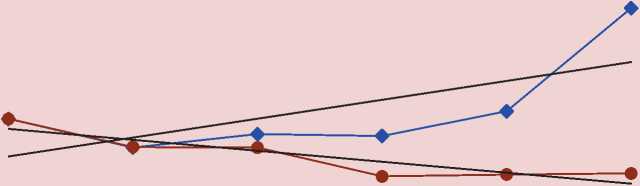
2010 2011 2012 2013 2014 2015
— ♦ — Commercial output
-----Line (Commercial output)
—•— Time of trawling
------Line (Time of trawling)
Source: calculated by the author from: data of the sectoral monitoring system Federal Agency for Fisheries of the Russian Federation; official website of the Corporate Information Disclosure Center. Available at: by 2015, the catch increased to 1.6 tons. The growing eco-efficiency is provided mainly by the reduction in the absolute expression of the time of trawling.
The ratio of dynamics of basic growth rate (to the level of 2010) of the cost of marketable pollock products and the time spent on trawling (Fig. 5) help notice the effect of relative impact decoupling on pollock fishing. Since 2011, the growth of the economic result has been accompanied by the reduction in the time of trawling.
Assessment of indicators of social performance using indices ( Fig. 6 ) provides both dynamic and normative analysis. If the index value reaches or exceeds unity (in the figure unity – “threshold level”) we can talk about effective use of WBR in terms of the social component of industry development.
The indicator of potential benefit of fish products customers is beyond the threshold value. This is confirmed by overperforming growth rates of prices for fish products compared to the population’s real income, which may also affect consumption which declined significantly in 2015. In that year, the wage lead factor in fisheries had the highest values. Note that growth rates of wages in fisheries exceed growth rates of WBR. At the same time, the production profile has changed significantly, which suggests the redistribution of the effect from consumers to producers through the price mechanism, rather than an increase in social efficiency.
Conclusion
It is advisable to analyze the performance of indicators of efficient use of WBR in domestic fisheries from the standpoint of economic, environmental and social components since 2010 due to limited data comparability. It is difficult to talk about trends over such a short period of time. However, the indicator of costeffectiveness (material efficiency and fuel efficiency) demonstrate a fairly steady growth. The performance of other indicators is unstable; even if there is an increase as in resource efficiency, it is extremely insignificant. At the same time, a high level of correlation between
Figure 6. Indicator performance of social efficiency of using WBR in fishery in Russia
-
♦ Wage lead factor in the fishing industry
-
• Benefit of
potential consumers of fish products
-------Threshold level
Source: calculated by the author from: official website of the Federal State Statistics Service of the Russian Federation. Available at:
WBR and the amount of catch indicates teh predominance of extensive growth factors.
In order to assess resource decoupling we used generally accepted methods of research depending on the volume of WBR production and created GVA. The research results indicate that the absolute resource decoupling in fisheries is not revealed but in some periods it is possible to note relative resource decoupling.
The full use of decoupling as a tool for assessing environmental and economic efficiency in fisheries, as opposed to other industries, is limited by the availability of statistics. We propose an indicator of the trawling duration as a proxy indicator of the environmental impact. Analysis of the relation between the time of trawling and the cost of marketable pollock products in the case of pollock fishing helps draw an indirect conclusion about the growth of eco-efficiency of the fishery and identify the relative impact decoupling. We believe that fuel consumption in natural terms along with the cost assessment of fuel costs can be considered as one of the most promising indicators of environmental impact in fisheries.
It is important to bridge the gap between the theoretically justified indicators of ecoefficiency and the opportunities of practical calculation based on the existing statistical framework. In order to ensure effective management of resource use in fisheries, it is necessary to continue to improve the methodology for assessing the use of WBR.
References Evaluation of water bioresources management efficiency in domestic fishing industry
- Doklad "Zhivaya planeta 2016" . WWF, Global Footprint Network, Water Footprint Network. London: Zoological Society, 2016. Available at: http://www.wwf.ru/resources/publ/book/1102 (Accessed: 24.02.2017).
- Resource Efficient and Cleaner Production. Available at: http://www.unep.fr/scp/cp/(Accessed: 20.04.2017).
- A.M. Shelekhov (Ed.). Osnovnye polozheniya strategii ustoichivogo razvitiya Rossii . Moscow, 2002. 161 p. Available at: http://www.sbras.ru/win/sbras/bef/strat.html (Accessed: 22.11.2016).
- Strategiya razvitiya pishchevoi i pererabatyvayushchei promyshlennosti Rossiiskoi Federatsii na period do 2020 goda . Available at: http://www.government.ru/media/2012/4/26/49762/file/559_pril.doc (Accessed: 24.11.2016).
- Natsional’naya Strategiya sokhraneniya bioraznoobraziya Rossii . Moscow, 2002. Available at: http://www.caresd.net/img/docs/530.pdf (Accessed: 22.11.2016).
- Ekologicheskaya doktrina Rossiiskoi Federatsii . Available at: http://www.mnr.gov.ru/regulatory/detail.php?ID=133908 (Accessed: 22.11.2016).
- Strategiya razvitiya rybokhozyaistvennogo kompleksa RF na period do 2020 goda, utv. prikazom ot 30 marta 2009 g. № 246 . Available at: http://www.fish-forum.ru/files/112.doc (Accessed: 24.02.2017).
- Gizyatov I.I. Revisiting the nature of resource saving. Vestnik TISBI=Bulletin of TISBI University of Management, 2010, no. 4. Available at: http://old.tisbi.org/science/vestnik/2010/issue4/Econom/Gizatov.html (Accessed: 24.02.2017)..
- Kamenik L.L. Resursosberegayushchaya politika i mekhanizm ee realizatsii v formate evolyutsionnogo razvitiya . Saint Petersburg: GUAP, 2012. 476 p.
- Volovich V.N. Ways and forms of rational use of natural resources in the conditions of the intensification of the social production. Obshchestvo. Sreda. Razvitie=Society. Environment. Development, 2013, no. 3 (28), pp. 20-24..
- Bleischwitz R. International economics of resource productivity-Relevance, measurement, empirical trends, innovation, resource policies. International Economics and Economic Policy, 2010, no. 7(2-3), pp. 1-18.
- Making the Case for Resource Efficiency in Ireland and Options for Taking it Forward (2011). Available at: https://www.epa.ie/pubs/reports/waste/prevention/prevention/COMHAR%20ResourceEfficiency%202011.pdf (Accessed: 24.02.2017).
- Schandl H., West J. Resource use and resource efficiency in the Asia-Pacific region. Global Environmental Change, 2010, no. 20, pp. 636-647. Available at: http://www.sciencedirect.com/science/article/pii/S0959378010000592 (Accessed: 24.02.2017).
- Resource Efficiency Indicators. Proceedings of the Workshop. Brussels, 14 April 2015. Available at: http://www.europarl.europa.eu/RegData/etudes/STUD/2015/542206/IPOL_STU(2015)542206_EN.pdf (Accessed: 20.04.2017).
- Fedotov Yu.V. Organizational performance measurement: principles of DEA (data envelopment analysis) approach. Rossiiskii zhurnal menedzhmenta=Russian management journal, 2012, vol. 10, no. 2, pp. 51-62. Available at: http://ecsocman.hse.ru/data/2012/08/11/1265221393/fedotov_org_pef_meas_rjm_2_12.pdf (Accessed: 24.11.2016)..
- Measuring material flows and resource productivity. Volume I. The OECD Guide, 2008. Available at: https://www.oecd.org/environment/indicators-modelling-outlooks/MFA-Guide.pdf (Accessed: 24.02.2017).
- Vasil’ev A.M. Deep processing -the main direction in enhancing the efficiency of fish utilization. Ekonomicheskie i sotsial’nye peremeny: fakty, tendentsii, prognoz=Economic and social changes: facts, trends, forecast, 2013, no. 5 (29), pp. 89-97..
- Reisinger H., Tesar M., Read B. Workshop on Resource Efficiency Indicators. Policy Department A: Economic and Scientific Policy. Brussels, 14 April, 2015. Available at: http://www.europarl.europa.eu/RegData/etudes/STUD/2015/542206/IPOL_STU(2015)542206_EN.pdf (Accessed: 20.04.2017).
- Schmidheiny S., Zorraquin F. Eco-efficiency and the Financial Markets. Chapter 1: Financing Change: the Financial Community. Eco-efficiency, and Sustainable Development, 1996. Available at: http://environment.yale.edu/publication-series/documents/downloads/0-9/101schmidheiny.pdf (Accessed: 24.02.2017).
- Kuosmanen T. Measurement and analysis of eco-efficiency: An economist’s perspective. Journal of Industrial Ecology, October 2005, no. 9(4), pp. 15-18.
- Ehrenfeld J. R. Eco-efficiency: Philosophy, theory and tools. Journal of Industrial Ecology, 2005, vol. 9, no. 4, pp. 6-8.
- Akulov A.O. Decoupling effect in the industrial region (the case of the Kemerovo Oblast). Ekonomicheskie i sotsial’nye peremeny: fakty, tendentsii, prognoz=Economic and social changes: facts, trends, forecast, 2013, no. 4, pp. 177-185..
- Samarina V.P. Decoupling effect in economic development of the Murmansk Region. Sever i rynok: formirovanie ekonomicheskogo poryadka=The North and the market: forming the economic order, 2014, vol. 2, no. 39, pp. 24-30..
- Yashalova N.N. Analysis of the decoupling effect in ecological and economic activity of a region. Regional’naya ekonomika: teoriya i praktika=Regional economics: theory and practice, 2014, no. 39, pp. 54-61..
- Decoupling natural resource use and environmental impacts from economic growth. A Report of the Working Group on Decoupling to the International Resource Panel. UNEP, 2011. 174 p. Available at: http://www.unep.org/resourcepanel/decoupling/files/pdf/decoupling_report_english.pdf (Accessed: 24.02.2017).
- Zakharov V.M. (Ed.). Na puti k ustoichivomu razvitiyu Rossii. "Zelenaya" ekonomika i modernizatsiya. Ekologo-ekonomicheskie osnovy ustoichivogo razvitiya . Moscow: Institut ustoichivogo razvitiya, 2012. 90 p.
- Agnew D.J., Pearce J., Pramod G., Peatman T., Watson R., Beddington J.R., Pitcher T.J. Estimating the worldwide extent of illegal fishing. PLoS ONE, 2009, 4(2). Available at: http://journals.plos.org/plosone/article?id=10.1371/journal.pone.0004570 (Accessed: 24.02.2017).
- Sostoyanie mirovogo rybolovstva i akvakul’tury 2016. Vklad v obespechenie vseobshchei prodovol’stvennoi bezopasnosti i pitaniya . Rim: FAO, 2016. 216 p.
- Indicators to measure decoupling of environmental pressure from economic growth, 2002. 108 p. Available at: http://www.oecd.org/officialdocuments/publicdisplaydocumentpdf/?doclanguage=en&cote=sg/sd(2002)1/final (Accessed: 24.02.2017).
- Mel’nikov A.V., Mel’nikov V.N. Catch per unit effort and catchability as relative indicators of fishing effort. Vestnik AGTU=Vestnik of Astrakhan State Technical University. Series: fishing industry, 2011, no. 1. Available at: http://cyberleninka.ru/article/n/ulov-na-usilie-i-ulavlivaemost-kak-otnositelnye-pokazateli-promyslovogo-usiliya (Accessed: 24.02.2017)..
- Mikhailova E.G. Types of fishing industry efficiency. Vestnik KamchatGTU=Bulletin оf Kamchatka State Technical University, 2016, no. 35, pp. 98-109..
