Evaluation of Water Purification Plant at Kosti City - Sudan

Author: Nahla Hussien, Abdel Moneim Babikr, Mortada Elhesain, Yasir Mohamed
Journal: Вестник Воронежского государственного университета инженерных технологий @vestnik-vsuet
Section: Пищевая биотехнология
Article in issue: 3 (89), 2021.
Free access
The objective of this study is to evaluate the purification level of water plant in Kosti city to supply water with high quality. This study was done to investigate the drinking water quality of Kosti city. Five sites of water network were selected, during March 2017 - May 2017. Thirty (30) samples of water from different areas of Kosti city were collected to evaluate water purification by using some laboratory tests for physical, chemical properties and microbiological. The results obtained showed that the turbidity level ranged between (4.2 – 150 NTU) thus exceeding the permissible level of WHO 1993 standards (5 NTU).The PH value was ranged between (6.3 – 8.2) and level of TDS (111 - 157 mg/L) ,hardness (43 - 89 mg/L) , residual chlorine (0.1 - 0.4 mg/L) , EC (116 - 234 μs/cm) . All these values fall below the values of national and international standards of (WHO, 1993) and Sudanese Organization for Standardization and Metrology 2008. The level of COD (86 – 584.4 mg/L), BOD (16 -144mg/L). Biological tests were conducted to determine the presence of fecal coliform the results showed that the samples of water limits according to the specifications of the Sudanese Organization for Standardization and Metrology(SOSM, 2008) and the World Health Organization (WHO, 1993) by 100%.
Water, Physical properties, Chemical properties, microbiological, Evaluation, Purification Plant, water
Short address: https://sciup.org/140259871
IDR: 140259871 | UDC: 66.047.3 | DOI: 10.20914/2310-1202-2021-3-121-128
Text of the scientific article Evaluation of Water Purification Plant at Kosti City - Sudan
DOI:
Water is considered as the most essential element on earth for all kinds of living creatures to maintain their life. In many time with rapid urban and rural expansion, the demand for water supply has increased many times as a result of more water has been used in domestic, agriculture and industrial sectors. (Al-Jlil, et al ., 2014).
Drinking water is the most important natural resource as only less than 1% of the total water on the planet is potable and accessible. Sustained supply of safe and potable drinking water is of paramount significance in promotion of health and well-being of the people. The performance evaluation of a treatment plant is a process to measure the functioning efficiencies based on some established performance indicators such as degree of removal of pollutants such as turbidity, colour, suspended impurities etc (Absar and Syed, 2018).
Poor drinking water quality remain one of the major threats to human health. According to the World Health Organization (WHO, 1993), 1.7 billion people are diagnosed with diarrheal diseases annually, 88% of which are attributed to unsafe water supply, inadequate sanitation and hygiene. Every one hour about 87 children under five are dying because of diarrhea (WHO; UNICEF, 2013).
Therefore, water is an important natural resource in the world, and life cannot exist and most industries could not operate without water
(Tebbutt, 1997). It is very necessary to treat water to purify water sources, make them suitable for human consumption through the removal and killing of pathogenic organisms, and remove the taste, smell, and other undesirable chemical and physical constituents (Mohammed and Shakir, 2012). In evaluation of a water treatment plant depending on treatment process efficiency, all involved processes could be assessed or a key unit is chosen to decide whether the plant operates in acceptable way or not (Wei, et al ., 2010). Clean and safe drinking water is very scarce on the earth. Every day due to industrialization and uncontrolled urbanization the source of pure water are getting polluted. Cleaning the polluted water and making it safe for drinking is the main challenge in today’s world (Baroniya et al ., 2012).
The public health significance of water quality cannot be over emphasized. Many infectious diseases are transmitted by water through the fecal oral route. Diseases transmitted through drinking water kill about 5 million children annually and make 1/6th of the world population sick (WHO, 2004). Water used in Sudan derives almost exclusively from surface water resources, as groundwater is used in only very limited areas. Surface water is provided mainly by the River Nile (Ell-Amin etal ., 2010). Water for domestic use is required to be both wholesome and safe. For health, reasons a number of chemical, physical and bacteriological quality of water are need to be considered (Tsadik, 2013).
Nahla Babiker Hussien, Abdel Moneim Osman, Mortada H.A. Elhesain, Yasir A. Mohamed. Evaluation of Water Purification Plant at Kosti City -Sudan // Вестник ВГУИТ. 2021. Т 83. № 3. С. 121–128.
This is an open access article distributed under the terms of the Creative Commons Attribution 4.0 International License
Table 1.
Comparison between the Sudanese Standards and Metrology Organization (SSMO, 2008) and the World Health Organization (WHO, 1993) Physical and Chemical Parameters)
|
Physical and Chemical Parameters and Characters |
Sudan Permissible Maximum |
WHO Guide Line Value |
|
Colour |
- |
15 TCU |
|
Turbidity. NTU |
5.0 NTU |
15.0 NTU |
|
Odor and Taste |
Acceptable |
- |
|
рН |
6.5 – 8.5 |
6.5 – 8.5 |
|
TDS |
1000 mg/L |
1000 mg/L |
|
Chloride |
250 mg/L |
250 mg/L |
|
Sulphate |
500 mg/L |
400 mg/L |
|
Fluoride |
1.3 mg/L |
1.5 mg/L |
|
Hardness as Са-СО3 |
- |
500 mg/L |
|
Manganese |
0.27mg/L |
0.1 mg/L |
|
Iron |
0.3mg/L |
0.3 mg/L |
|
Sodium |
250mg/L |
200 mg/L |
|
Copper |
1.5 mg/L |
1 mg/L |
|
Zinc |
- |
5 mg/L |
|
Nitrate as NО 3 |
50 -200mg/L |
50mg/L |
|
Nitrate as N |
0.03 mg/L |
0.05 mg/L |
|
Arsenic |
0.03 mg/L |
0.05 mg/L |
|
Lead |
Ns |
Ns |
|
Barium |
Ns |
0.005 mg/L |
|
Cadmium |
- |
0.01 mg/L |
|
Selenium |
0.04 mg/L |
0.05 mg/L |
|
Chromium |
Ns |
0.001 mg/L |
|
Mercury |
- |
Ns |
|
BOD |
- |
5mg/L |
|
Diedrin |
0.2 mg/L |
0.3 mg/L |
|
Chlordin |
- |
- |
|
COD |
- |
10mg/L |
|
Iodine |
- |
- |
|
Calcium |
0.002mg/L |
- |
|
Magnesium |
0.27mg/L |
- |
|
Aluminum |
0.13mg/L |
- |
|
Residual Chlorine |
0.2 – 0.4mg/L |
0.3 – 0.5 mg/L |
|
Electrical Conductivity |
Ns |
1600 mi-cromohs/cm |
|
Ns = No standard – = Not found |
||
The problem of supplying adequate amount of safe water for distribution to the public does not end with the construction of water works recently, in Kosti city drinking and general-purpose water is supplied by the White Nile. The water of the White Nile is very turbid, therefore, it is expected to be contaminated with chemicals, as well as microorganisms and accordingly it may cause health problems such as toxicity and some diseases and disorders. Therefore, the present investigation was carried out in an attempt to study the drinking water quality in Kosti city.
Materials and Methods
Location of the Study Area
This study was carried out on drinking water samples collected from different locations at city Kosti, White Nile State. It is located on the west bank of the White Nile. Furthermore, Kosti is considered as a central point of travel and communication as it is largest river port in Sudan, which connects north of Sudan government to the south of Sudan government. In recent years Kosti has grown fast due to war and draught that affect southern and western regions of the Sudan
Process Description
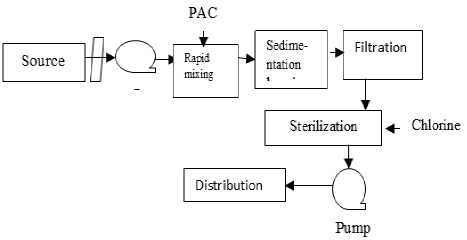
Water is taken from water source (White Nile) The water is drawn from the supplier with pull pumps They have filters to prevent the entry of large materials such as wood, fish and plants.
Water is transferred to rapid mixing tanks, where the water is mixed with a hydraulic mixer powered by water in order to break the large particles attached to facilitate the deposition process the poly-aluminum chloride is added to its high efficiency in removing the suspended materials the water is then transferred from the rapid mixing basin to the settling basin where the suspended material is deposited in the bottom of the basin and disposed of by a shovel located at the bottom of the basin. The pure water is transferred to the filtration basin. The water is collected after removing it from the filters in the sterilization tanks where the chlorine is added in either the form of liquid, solid or gas, which is the most efficient, then the water is left for a period ranging from 2.5 to 4 hours and then the water is distributed to the transport networks by the pumps.
-
Figure 1. Schematic diagram of the Stages of Water Purification, in Kosti City
Sampling
Samples were collected from different sites along the network line of drinking water system that supply Kosti city. Five sites were selected for sampling was as followed:
Site 1: The Raw water in plant.
Site 2: The Treated water in plant.
Site 3: 27 quarter.
Site 4: El Hila El Gadida quarter.
Site 5: El Nasri quarter.
Sampling Techniques
Water samples were collected aseptically in sterile bottles. The opening of the tap was cleaned, sterilized by alcohol, and flaming.
The tap was then opened, first stream was discarded, and after 2 minutes, the target sample was collected in sterile bottle. The bottle was tightly closed and immediately transported to laboratory for chemical and bacteriological analysis. The chemical and bacteriological analysis was carried out in Chemistry Laboratory at University of El-imam El-Mahdi and Kosti Water Analysis Laboratory.
Materials
The materials used throughout this study include:
-
1. Sample of water.
-
2. Media Macconky Broth.
-
3. Media M-Endo Agar LES.
-
4. Media Brillint Green Bile Broth-2%.
-
5. Distilled Water.
-
6. Sulphuric Acid (Н 2 SО 4 ).
-
7. Starch Indicator.
-
8. Sodium Iodine (NаI).
-
9. Manganese Sulphate (МnSО4).
-
10. Copper Sulphate (СuSО 4 ).
-
11. Potassium permanganate (КМnО 4 ).
-
12. Sodium Oxalate (0.025N) (Nа 2 С2О 4 ).
-
13. Sodium Thiosulfate (Nа2S2О3).
-
14. Ammonium Chloride (NН4 Cl).
-
15. Ammonium Hydroxide (NН4 OH).
-
16. EDTA solution.
Equipment and Devices
The apparatus used throughout this study include:
-
1. Turbdiymeter tуре2100N made in Japan.
-
2. Ectype 214 Conductivity Meter made in Portugal.
-
3. Ph–type 211 Microprocessor PH – meter made in Portugal.
-
4. Incubation type 06287 Akyoet made in Turkey.
-
5. Water Bath – Mumbai type 400013mаdе in India.
-
6. Electronic Digital Balance type О512mаdеin China.
-
7. TDS/TEMP type 122 TDS Meter made in China.
-
8. Autoclave type H Т30 psi made in Turkey.
-
9. Laboratory glass Equipment's, thermometer rang of (0–50℃); burette capacity (0–100 Ml); different type of cylinder (10–500 Ml); test tube; Petri dishes; different type of beakers (50–100– 250 mL); different type of funnels (50–100–150– 250–1000 ML).
-
10. Laboratory Consumptions (gloves – facemask – Cotton – soap).
Physical Tests
Measurement of the temperature . 100 ml of water sample was taken in a beaker to measure the temperature by using thermometer device then the readings were recorded.
Test of Total Dissolved Solids (IDS). 100 ml of water sample were taken in a beaker to measure the amount of total dissolved solids by using TDS meter device then the readings were recorded.
Test of Turbidity . Sample of water was taken in device tube turbdiymeter after calibration the device tube is empty then the readings were recorded.
Test of Electrical Conductivity (EC) . 100 ml of drinking water was put in a beaker and, a conduct meter was used to measure the conductivity of water after calibration the device by buffer solution then the readings were recorded.
Chemical Tests
Measuring the degree of Ph. 100 ml of water sample was put in a beaker, Ph – meter was used to measure the Ph and then the readings were recorded.
Residual Chlorine Test. 10 ml of water sample was put in the comparison scale and then put the diethyl phenylnediamine (DPD) and dissolved in the water in the comparison scale and then the readings were recorded by comparing with the color closest to it.
Total Hardness. 1ml ammonia buffer solution and about 30mg of eriochrome black T indicator was added to 50ml water sample in 250ml conical flask .the solution was then titrated with the 0.01МЕDТА solution until the color changes from wine red to blue end point and then the readings were recorded.
Наrdnеss СаСо mg/L = ( ∗ ∗ ) (1) ml of sample where A – ml of EDTA required for titration; B – mgs of СаСо3 equivalent to 1mоlе EDTA.
Determination the Chemical Oxygen Demand (C.O.D). 10ml of the sample were taken in 100ml bottle then 5ml of соnсеntrаtе Н 2 SО 4 wаsаddеd and about 1gm of copper sulphate (СuSO 4 ) also added. Then 3ml of prepared (0.025N) КМn04 solution was added and immersed in boiling water for 30 minutes while keeping the surface of boiling water at higher level than the surface of the sample. Three moles (3ml) were then prepared (0.025N) of sodium oxalate Nа2 С2 О4wаs added and immediately titrated with (0.025N) potassium permanganate (КМnО4) until the violet colour was appeared. The experiment repeated for the blank separately under the same condition using 10 ml of distilled water instead of 10 ml of sample.
COD as mg/L
s amp 1 e оf ml В*A*8000*0.025 ML OF SAMPLE
where A – ml of КМnО4 used sample; B – ml of KMnO 4 used blank; 0.025 (—) - Normality of КМnО 4 ; 8000 – ml equivalent weight of oxygen in 1000 ml/L.
Determination of Biological Oxygen Demand (B.O.D) . Twenty five mls sample was taken in each bottle and 75 mls of the sample was added to each of bottles then the bottles closed well .one bottle was kept in the in Cuba for at (20-22T) for 5 days. then 10 mls of manganese sulphate solution and 2mls of alkali – 10 ml (NаI) solution was added to the of bottle below the surface of the liquid by using a syringe .then the bottle were closed and mixed by inverting it several times when the precipitate settles leaving a clear supernatant above the precipitate, shaken again slowly by inverting the bottle and when the setting has produced at least 50mls superhot at 8 mls of conc Н 2 SО 4 wаs added. Then the bottle was closed and mixed by gentle in version until dissolution was completed. One – hand red mls of the sample was titrated in the 0.025М Nа2S2О3 sоlutiоn until a pale yellow solution was reached. Then 2mls of freshly preparer starch solution was added and titration was continued until a blue colour appeared. the proceed me was then repeated using 100mls distilled water (blank) then, repeated for in au bated sample for 5 days and then the readings was recorded.
BOD as Mg/L = 16(V 1 -V 2 ) (3)
(Garcia and Stamatis, 2013)
where V1 – ml of Nа2 S2 О3 used for the sample before incubation; V 2 – ml of Nа 2 S 2 О 3 used for the sample after incubation.
Microbial Load Determination
Detection of total coliform bacteria . 7.3 gm of Media Macconky Broth was added to 100 ml of distilled water the mixture was heated in Bunsen burner and then put in the autoclave for 20 minutes, then leave until cooled and then add 100 ml of the sample water and entered the incubator in the temperature of 37 °C for 24 hours change color From darkviolet to yellow proof positive of the existence of total coliform bacteria.
Detection of Fecal Coliform Bacteria. Prepare the media Brillint Green Bile Broth-2% in the same way, bring the media in the same way with the replacement of the weight of the media by 8 grams the former and placed on tubes containing the Graham tube and add 1 ml of positive sample in the test of coliform and enter in the incubator at a temperature of 45OC for a period of 24 hours occurrence of turbidity in the color with gas surges in the Graham tube evidence of the presence of Fecal Coliform Bacteria.
Detection of Escherichia coli E. Coli Bacteria. Prepare the media M-Endo Agar LES in the same way before with the replacement of the weight of the media by 5.2 grams and then placed on the Petri dishes then was sprinkled with a positive sample of the Fecal Coliform bacteria test and placed in the incubator for 24 hours in the reference temperature 37T note gold colonies are bright in the positive samples evidence of existence E.coli bacteria.
Results and Discussions
Table 2.
The рН of Kosti water network distribution pipeline at five sites during the period March 2017 and May 2017
|
Date |
Raw water |
Treated Water |
A |
B |
C |
|
1/3/2017 |
7.6 |
7.6 |
7.3 |
7.2 |
7.2 |
|
15/3/2017 |
6.8 |
6.9 |
6.5 |
6.3 |
6.3 |
|
29/3/2017 |
7.8 |
7.8 |
7.8 |
7.6 |
7.4 |
|
1/5/2017 |
8.2 |
8.2 |
8.2 |
8.2 |
8.2 |
|
15/5/2017 |
7.8 |
7.8 |
7.5 |
7.3 |
7.2 |
|
29/5/2017 |
7.8 |
7.8 |
7.4 |
7.3 |
7.2 |
|
A: 27 Squarer – B : El Hila Elgadida – C: El Nasri Squarer |
|||||
It was noticed from the Table 2 that the рН values are almost constant, the highest рН was found in May (8.2) on the 1/5/2017, while March had the lowest рН value (6.3) on the 15/3/2017 in B and C respectively.
We note that the рН values are almost constant the same for the Nile water, with a slight difference due to the quality of the water and Materials suspended with water and distribution lines of the network .
The change in рН i.e. in May (8.2) and in March (6.3) may be due to improper water treatment on that day and i.e present of same Alkalinity and acidic materiel for May and March respectively.
The high рН in the first of May was attributed to some rain fall in this period. This rain fall increase the Alkalinity of water due to some alkaline substance dissolved by the rain and PH increase in Alkalinity direction.
This result was in agreement with (Reda, 2016) finding, in her study Physicochemical Analysis of Drinking Water Quality of Arbaminch Town. She found that the values of Ph were 7.5, 7.1, 7.7. We find рН values that falls within the permissible limit (6.5–8.5).
Table 3.
The Electrical conductivity (μs/cm) of Kosti water network distribution pipeline at five sites during the period March 2017 and May 2017
|
Date |
Raw water |
Treated water |
A |
B |
C |
|
1/3/2017 |
160 |
158 |
162 |
156 |
174 |
|
15/3/2017 |
140 |
128 |
122 |
116 |
154 |
|
29/3/2017 |
144 |
130 |
135 |
130 |
144 |
|
1/5/2017 |
214 |
213 |
216 |
210 |
224 |
|
15/5/2017 |
224 |
223 |
226 |
220 |
234 |
|
29/5/2017 |
220 |
219 |
222 |
216 |
224 |
The results obtained showed that the conductivity varied among months for all locations with the highest value (234 μs/cm) obtained during May at station (C) 15/5/2017 and the lowest value (116μs/cm) obtained during March at station (B) 15/3/2017. These results show that electrical conductivity increases near the autumn season and decreases in the summer. The different in conductivity between Raw and Treated Water may be attributed to the fact that when raw water was treated some materials were removed and this cause the low thermal conductivity in Treated Water.
Table 4.
The turbidity level (NTU) and removal rate%of Kosti water network distribution pipeline at five sites during the period March 2017 and May 2017
|
Date |
Raw water |
Treated water |
A |
B |
C |
Removal rate % Raw and treated water |
Removal rate % Raw and A |
Removal rate % Raw and B |
Removal rate % Raw and C |
|
01/3/2017 |
6.3 |
6.2 |
4.2 |
4.4 |
5 |
1.6 |
58.3 |
30.2 |
20.6 |
|
15/3/2017 |
7.4 |
6.5 |
4.6 |
4.9 |
5.2 |
12.2 |
37.8 |
33.8 |
29.7 |
|
29/3/2017 |
12.1 |
8.4 |
4.8. |
5 |
6.1 |
30.6 |
60.3 |
58.7 |
49.6 |
|
01/5/2017 |
120 |
64 |
35.2 |
49.3 |
50 |
46.7 |
70.7 |
58.9 |
58.3 |
|
15/5/2017 |
143 |
84.4 |
45.1 |
48.2 |
61 |
50 |
68.5 |
66.3 |
57.3 |
|
29/5/2017 |
150 |
94.5 |
55.5 |
58.3 |
60 |
37 |
63 |
61.1 |
60 |
Removal rate%=
inside turbidity – outside turbidity *100% inside turbidity
Table 4 show the highest value of turbidity (150 NTU) was reported in site raw water while the lowest value (4.2 NTU) was reported in site A. The White Nile becomes very narrow in summer and this causes difficulty in water pumping, which in turn contaminate the pumped water with solids and soil particles. Generally the turbidity was increased and stagnate in the month of May towards June and August and these month are Autumn months and as we know the turbidity of these month is very high. We find the percentages of water turbidity removed% are different, not fixed. And the maximum removal rate occurred on the 1/5/2017 amounted to 70.7%. And the lowest removal rate occurred onthe 1/3/2017 and reached.
This result was in agreement with (Siddig, 2007) finding, in her study Assessment of Drinking.
Water Quality of Kosti City. She found that the values of turbidity were 40, 70, 75 NTU. The turbidity values of Kosti water exceed the permissible level of WHO and Sudanese Organization for Standardization and Metrology (5 NTU).
Table 5.
The residual chlorine level (mg/L) of Kosti water network distribution pipeline at four sites during the period March 2017 and May 2017
|
Date |
Treated water |
A |
B |
C |
|
01/3/2017 |
0.3 |
0.2 |
0.2 |
0.2 |
|
15/3/2017 |
0.2 |
0.2 |
0.2 |
0.2 |
|
29/3/2017 |
0.4 |
0.4 |
0.4 |
0.4 |
|
01/5/2017 |
0.2 |
0.2 |
0.2 |
0.2 |
|
15/5/2017 |
0.2 |
0.1 |
0.1 |
0.1 |
|
29/5/2017 |
0.2 |
0.1 |
0.1 |
0.1 |
Pipe line were very old at some areas or places so some materials like mineral may enter in the pipe line due to some breakage or some openings.
This result was in agreement with (Abdel-magid et all ., 1984) finding, in his study Chemical and Microbiological examination of well and Nile water. he found that the values of electrical conductivity were 150,170, 305μs/cm. All the reading fall below the acceptable level of WHO and, Sudanese Standards and Metrology Organization (1600 μs/cm).
As observed in Table 5 thеrе is a fluctuation in the residual chlorine sometime decreases and sometime remains in the same level this was attributed to presence of some microorganisms needed for sterilization. This result was in agreement with (Siddig, 2007) finding, in her study Assessment of Drinking Water Quality of Kosti City. She found that the values of residual chlorine were 0.2, 0.4, 0.5 mg/L. The residual chloride between (0.1–0.4) mg/L, which means it falls minim of the permissible limits.
Table 6.
The total dissolved solids (TDS) (mg/L) of Kosti water network distribution pipeline at five sites during the period March 2017 and May 2017
|
Date |
Raw water |
Treated water |
A |
B |
C |
|
01/3/2017 |
111 |
111 |
115 |
114 |
112 |
|
15/3/2017 |
120 |
122 |
120 |
122 |
123 |
|
29/3/2017 |
123 |
122 |
124 |
123 |
120 |
|
01/5/2017 |
130 |
130 |
129 |
128 |
129 |
|
15/5/2017 |
140 |
141 |
140 |
138 |
142 |
|
29/5/2017 |
156 |
157 |
160 |
155 |
152 |
From Table (6) the highest value (157mg/L) was reported in May while the lowest one (111mg/L) was reported in March. There is no significant difference in total dissolved solids between raw water and treated water and distributed water at station A, B, C this means that all the dissolved substance and minerals in water more or less is it not reduced nor increased.
This result was in agreement with (Siddig, 2007) finding, in her study Assessment of Drinking Water Quality of Kosti City. She found that the values of total dissolved solids were 80, 101, 130 mg/L .All the readings fall below the value of the WHO standards (1000 mg/L).
Table 7.
Chemical oxygen demand (C.O.D) (mg/L) of Kosti water network distribution pipeline at five sites during the period March 2017 and May 2017
|
Date |
Raw water |
Treated water |
A |
B |
C |
|
01/3/2017 |
154.8 |
129 |
120.4 |
111.8 |
86 |
|
15/3/2017 |
240.8 |
215 |
206.4 |
197.8 |
94.6 |
|
29/3/2017 |
326.8 |
301 |
301 |
283.8 |
103.2 |
|
01/5/2017 |
412.8 |
387 |
378.5 |
369.8 |
120.4 |
|
15/5/2017 |
498.8 |
473 |
464.4 |
455.5 |
206.5 |
|
29/5/2017 |
584.8 |
559 |
550.4 |
541.8 |
292.5 |
Table 9.
Caption
|
Date |
Raw water |
Treated water |
A |
B |
C |
|
01/3/2017 |
+ |
- |
- |
- |
- |
|
15/3/2017 |
+ |
- |
- |
- |
- |
|
29/3/2017 |
+ |
- |
+ |
- |
- |
|
01/5/2017 |
+ |
- |
- |
- |
+ |
|
15/5/2017 |
+ |
+ |
+ |
+ |
+ |
|
29/5/2017 |
+ |
+ |
+ |
+ |
+ |
|
+ The presence of bacteria in the sample; – There are no bacteria in the sample |
|||||
From Table (7) the highest value of COD (584.8mg/L) was reported in site raw water, while the lowest one (86 mg/L) was reported in site C. The highest value of COD in raw water was attributed to high turbidity of water and contamination which may include some of organic matter that need more COD to be converted to inorganic matter.
This result was in agreement with (Sharma and Gupta, 2013) finding, in his Study of amount of Oxygen (BOD, OD, COD) in water and their effect on fishes he found that the values of chemical oxygen demand wеrе12.2, 34.2, 12.9 mg/L. The COD values of Kosti water exceed the permissible level of WHO standards (10 mg/L).
Table 8.
Biological Oxygen Demand (B.O.D) (mg/L) of Kosti water network distribution pipeline at five sites during the period March 2017 and May 2017
|
Date |
Raw water |
Treated water |
A |
B |
C |
|
01/3/2017 |
54.5 |
36 |
17 |
16 |
32 |
|
15/3/2017 |
136 |
96 |
64 |
19.5 |
16 |
|
29/3/2017 |
144 |
104 |
72 |
32 |
17 |
|
01/5/2017 |
128 |
35.5 |
48 |
35.2 |
32 |
|
15/5/2017 |
112 |
36 |
32 |
36.2 |
17 |
|
29/5/2017 |
96 |
70.5 |
16 |
17 |
33 |
From Table (8) the highest value of BOD (144 mg/L) was reported in site raw water, while the lowest one (16 mg/L) was reported on 29/5/2017 in station A. The highest value of BOD was reported in raw water this is an indicator for the presence of microorganisms in water and microorganisms need oxygen.
This result was in agreement with (Sharma and Gupta, 2013) finding, in his Study of amount of Oxygen (BOD, OD, COD) in water and their effect on fishes he found that the values of Biological oxygen demand were 5.2, 8. 3,3.2 mg/L. The BOD values of Kosti water exceed the permissible level of WHO standards. (5mg/L).
Total coliform Bacteria per 100 ml of Kos-ti water network distribution pipeline at five sites during the period March 2017 and May 2017.
From Table (9) there is presence of microorganisms in treated water on the days 15/5/2017 and 29/5/2017 in station A, B, C this means that the treatment of water was not sufficient and consequently there was presence of positive signal (+) which means the presence of Total coliform Bacteria. This result was in agreement with (B . et all . 2008) finding, in his Study Physico Chemical and Bacteriological Analyses of Water Used for Drinking and Swimming Purposes in Abeokuta, Nigeria. The Contents of Microorganisms According to Sudanese Specifications and Sudanese Organization for Standardization and Metrology 2008 recommended that the permissible Total coliform Bacteria count be around 0.0.
Table 10.
Fecal Coliform Bacteria per 100 ml of Kosti water network distribution pipeline at five sites during the period March 2017 and May 2017
|
Date |
Raw water |
Treated water |
A |
B |
C |
|
1/3/2017 |
+ |
- |
- |
- |
- |
|
15/3/2017 |
+ |
- |
- |
- |
- |
|
29/3/2017 |
+ |
- |
- |
+ |
- |
|
1/5/2017 |
+ |
- |
- |
- |
+ |
|
15/5/2017 |
+ |
+ |
+ |
+ |
+ |
|
29/5/2017 |
+ |
+ |
+ |
+ |
+ |
|
+ The presence of bacteria in the sample; – There are no bacteria in the sample |
|||||
From Table (10) there is presence of microorganisms in treated water on the days 15/5/2017 and 29/5/2017 in station A, B, C this means that the treatment of water was not sufficient and consequently there was presence of positive signal (+) which means the presence of Fecal Coliform Bacteria. This result was in agreement with (B. et all ., 2008) finding, in his Study
Physico Chemical and Bacteriological Analyses of Water Used for Drinking and Swimming Purposes in Abeokuta, Nigeria.
The Contents of Microorganisms According to Sudanese Standards and Metrology Organization (2008) recommended that the permissible Fecal Coliform Bacteria count be around 0.0.
Table 11 .
Escherichia coli (E. coli) per 100 ml of Kosti water network distribution pipeline at five sites during the period March 2017 and May 2017
|
Date |
Raw water |
Treated water |
A |
B |
C |
|
1/3/2017 |
+ |
- |
- |
- |
- |
|
15/3/2017 |
+ |
- |
- |
- |
- |
|
29/3/2017 |
+ |
- |
- |
+ |
- |
|
1/5/2017 |
+ |
- |
- |
- |
+ |
|
15/5/2017 |
+ |
+ |
+ |
+ |
+ |
|
29/5/2017 |
+ |
+ |
+ |
+ |
+ |
|
+ The presence of bacteria in the sample; – There are no bacteria in the sample |
|||||
From Table (11) there is presence of microorganisms in treated water on the days 15/5/2017 and 29/5/2017 in station A, B, C this means that the treatment of water was not sufficient and consequently there was presence of positive signal (+) which means the presence of Escherichia coli.
This result was in agreement with (B. et all , 2008) finding, in his Study Physico Chemical and Bacteriological Analyses of Water Used for Drinking and Swimming Purposes in Abeokuta, Nigeria.
The Contents of Microorganisms According to Sudanese Organization for Standardization and Metrology (2008) recommended that the permissible Escherichia coli Bacteria count be around 0.0.
The overall results there were presence of Total coliform Bacteria, Fecal Coliform Bacteria and Escherichia coli all Microorganisms on their days (15/5 and 29/5/2017) this is strong evidence for the contamination on these periods.
Conclusion
The quality of Kosti city drinking water under the study was found to be in the required range according to Sudanese Standards and Metrology Organization (2008) and World Health Organization (WHO, 1993).
References Evaluation of Water Purification Plant at Kosti City - Sudan
- Niu J., Kasuga I., Kurisu F., Furumai H. et al. Evaluation of autotrophic growth of ammonia-oxidizers associated with granular activated carbon used for drinking water purification by DNA-stable isotope probing. Water research. 2013. vol. 47. no. 19. pp. 7053-7065. doi: 10.1016/j.watres.2013.07.056
- Khan A.A., Ahmad S.K. Performance evaluation of water treatment plant at nangloi. New Delhi: a case study ijret: International Journal of Research in Engineering and Technology. 2018.
- Al-Jlil S.A., Alromaih H., Alshabonah F., Alsoubaei F. et al. Evaluation of Performance of Wastewater Treatment Plant at KACST, Riyadh Saudi Arabia. Research Journal of Environmental Sciences. 2014. vol. 8. no. 2. pp. 117-122.
- Shittu B.O., Olaitan O.J., Amusa S.T. Physico-Chemical and Bacteriological Analyses of Water Used for Drinking and Swimming Purposes in Abeokuta, Nigeria. African Journal of Biomedical Research. 2008. vol. 11.
- Mamta B., Singh B. S., Monica J. Operation and maintenance of water treatment plant at BNP Campus Dewas, In-dia: A case study. ISCA Journal of Biological Sciences. 2012. vol. 1. no. 1. pp. 83-86.
- Ell-Amin A.M., Sulieman A.M.E., El-Khalifa E.A. Quality characteristics of drinking water in Khartoum state and Wad-Medani District, Sudan. 14th international water technology conference, IWTC. 2010. vol. 14. no. 2010. pp. 863-876.
- Verma N., Singh A.K. Development of biological oxygen demand biosensor for monitoring the fermentation indus-try effluent. International Scholarly Research Notices. 2013. vol. 2013. doi: 10.5402/2013/236062
- Mohammed A.A., Shakir A.A. Evaluation the performance of Al-wahdaa project drinking water treatment plant: A case study in Iraq. International Journal of Advances in Applied Sciences. 2012. vol. 1. no. 3. pp. 130-138.
- Reda A.H. Physico-chemical analysis of drinking water quality of Arbaminch Town. J Environ Anal Toxicol. 2016. vol. 6. no. 2. pp. 1-5.
- Sharma P., Gupta S. Study of amount of Oxygen (BOD, OD, COD) in water and their effect on fishes. American International Journal of Research in Formal, Applied and Natural Sciences. 2014. vol. 7. no. 1. pp. 53-58.
- Somani S., Ingole N., Patil S. Performance evaluation of natural herbs for antibacterial activity in water purifica-tion. International Journal of Engineering Science and Technology. 2011. vol. 3. no. 9. pp. 7170-7174.
- SSMO, (2008) Sudanese Standards and Metrology Organization.
- Kpan W.B., Koné M.W., Bonfoh B., Kamanzi K. Evaluation of eighteen west african plants for water purification, potential use for rural water treatment. Journal of Water Chemistry and Technology. 2017. vol. 39. no. 5. pp. 310-316. doi: 10.3103/S1063455X17050101
- Tsadik T.G Performance Evaluation of Drinking Water Gambella Town Drinking Water Treatment Plant. School of Graduate Studies of Addis Ababa University fulfillment of the Degree of Chemical Engineering M.S.c. Science in Environ-mental Engineering. 2013.
- Wei J., Ye B., Wang W., Yang L. et al. Spatial and temporal evaluations of disinfection by-products in drinking wa-ter distribution systems in Beijing, China. Science of the Total Environment. 2010. vol. 408. no. 20. pp. 4600-4606. doi: 10.1016/j.scitotenv.2010.06.053
- WHO. Water Sanitation and Health Programmed. Managing water in The home: accelerated health gains from im-proved water sources. World Health Organization. 2004. Available at: www.who.int
- WHO. UNICEF. WHO / UNICEF Joint Monitoring Programme (JMP) for Water Supply and Sanitation. Retrieved December 11, 2013. Available at: http://www.wssinfo.org/definitions methods/introduction/
- Jordanowska J., Jakubus M. Evaluation of effectiveness technological process of water purification exemplified on mod-ernized water treatment plant at Otoczna. Civil and Environmental Engineering Reports. 2014. doi: 10.2478/ceer-2014-0014
- Verma S.K., Singhal P., Chauhan D.S. A synergistic evaluation on application of solar-thermal energy in water pu-rification: Current scenario and future prospects. Energy conversion and Management. 2019. vol. 180. pp. 372-390. doi: 10.1016/j.enconman.2018.10.090
- Elasaad H., Bilton A., Kelley L., Duayhe O. et al. Field evaluation of a community scale solar powered water puri-fication technology: A case study of a remote Mexican community application. Desalination. 2015. vol. 375. pp. 71-80. doi: 10.1016/j.desal.2015.08.001
