Evaluation of Websites of Wireless Telecommunications Companies in Algeria Using Z-number TOPSIS

Author: Boumediene M., Boumediene D., Benlebbad M.
Journal: Science, Education and Innovations in the Context of Modern Problems @imcra
Article in issue: 7 vol.8, 2025.
Free access
The rapid growth of digital services has made website evaluation a critical tool for assessing competitiveness, particularly in the telecommunications sector. This study evaluates the service websites of Algeria’s three major wireless telecom providers—Djezzy, Mobilis, and Ooredoo—using the Z-number TOPSIS method, which integrates data reliability and uncertainty into decision-making. Five key criteria were analyzed: usability, content quality, design, security, and organization. Results indicate clear performance distinctions among the companies. Djezzy’s website ranked highest, excelling particularly in security and usability, followed by Mobilis and then Ooredoo. Notably, security was identified as the most influential criterion, reflecting user priorities in an era of cyber threats, while organization had the least impact. These findings suggest that while all companies meet basic functional standards, disparities in user trust and interface efficiency significantly differentiate their digital platforms. The study underscores the importance of continuous benchmarking in Algeria’s evolving telecom market. Recommendations include prioritizing security enhancements and adopting best practices from top-performing competitors. By addressing these gaps, companies can better align their digital services with consumer expectations. This research contributes a structured evaluation framework applicable to emerging markets, offering actionable insights for improving website quality and customer satisfaction.
E-services websites, Z-number Topsis, Evaluation
Short address: https://sciup.org/16010897
IDR: 16010897 | DOI: 10.56334/sei/8.7.76
Text of the scientific article Evaluation of Websites of Wireless Telecommunications Companies in Algeria Using Z-number TOPSIS
An organization’s official website serves as its digital representation in the online environment, making corporate websites a matter of paramount importance. To remain competitive, an organization’s website must be effective—and measuring this effectiveness requires clarity on what to evaluate and how to evaluate it (Schmidt et al., 2008). Our research is motivated by the absence of a comprehensive website assessment model that incorporates qualitative criteria from the enduser perspective, particularly for e-service platforms.
Against this backdrop, this paper focuses on evaluating the websites of Algeria’s major wireless telecommunications providers—namely Mobilis, Djezzy, and Ooredoo—using a novel hybrid approach that integrates Multi-Criteria DecisionMaking (MCDM) models with the WEBQUAL scale.
Theoretical background:
The World Wide Web (WWW) is an extensive information resource that offers a vast amount of publicly accessible information from virtually any location, making it the largest data source in the world (Pant et al., 2004). Over the past decade, the WWW has experienced significant growth. This growth has been driven by factors such as advancements in hardware technologies, increased ease of use of software, and the vast opportunities the Web offers for businesses (Bing et al., 2011). Additionally, the emergence of a new generation of web applications, known as "Web 2.0," has contributed to this growth, with user-generated content playing a substantial role, as user engagement with the WWW continues to rise (Aghaei, 2012). The Web is increasingly being integrated into daily life, enabling activities such as shopping, banking, conferencing, and social networking, all of which offer numerous additional benefits (Bargh et al., 2004).
The World Wide Web (WWW) was invented by Sir Tim Berners-Lee in 1989 while working at the European Organization for Nuclear Research (CERN), where the term "World Wide Web" was coined for the project. The WWW (or web) is the largest and most widely used repository of hypertext content in the world (Bing, L., 2011). Content on the web is distributed and heterogeneous in nature, and the web's integration into nearly all aspects of society is evident. Content publishing on the web follows a simple concept: hypertext documents can be linked to other documents distributed across the web (Pant et al., 2004). Content publishing on the web is not controlled or managed by a central authority in any way. Due to the lack of editorial control, it allows for the publication of any content on any topic in any format. The easy and unrestricted publication of content provides a platform with many advantages for numerous applications and could offer a promising future for open and democratic communication by any participant (Bing, L., 2011).
The organization of information distributed on the web is determined by the author or publisher of the information. An example of this is the organization of content into a set of web pages that constitute a website. This content may be linked (hyperlinked) to other related content across domains or physical locations according to the publisher's or author's guidelines. This organizational structure is generally understood by other users. However, this open and unrestricted environment can have negative effects when viewed from an information retrieval perspective, as there are no strict, enforced guidelines on how content should be published, described, and disseminated on the web. The size of the web and its continuous and rapid growth prevent users from easily accessing the desired content. Therefore, software is necessary to help retrieve information from this vast data source (Dieter et al., 2011).
The World Wide Web (WWW) is considered one of the most important developments on the internet. Some view it as the second revolution in the emergence of the internet. It gave the internet a popular character, transforming it from a tool used by private scientific researchers in various disciplines into a means of mass communication and information, used by millions of ordinary people around the world.
Easley et al. (2010) defined websites as applications created by Tim Berners-Lee between 1989 and 1991 to allow the sharing of information and documents over the internet. They provide a mechanism for website administrators to make documents easily available online via web pages that can be created and stored on a computer. These pages are requested and browsed over the internet using various internet browsers.
Website evaluation is an active area of research that combines elements from various fields (Chiou et al., 2010), including the technical aspects of e-service websites as well as administrative issues, such as how website features relate to service processes and customer behavior. In a study by Doush and Almiraj (2019), the researchers evaluated web accessibility issues facing people with disabilities in Kuwait in an effort to identify problems, raise government awareness, and promote inclusion. To assess the accessibility of e-government services in Kuwait, they applied both automated and expert evaluation to the top 17 e-government services in Kuwait in 2018. The results showed that 13 of the evaluated e-services were impossible to use, revealing a serious lack of compliance with Web Content Accessibility Guidelines (WCAG 2.0) Level A for most of the evaluated websites. Furthermore, the study demonstrates the importance of a task-based approach when assessing website accessibility, as navigating between different pages after completing each task can help identify additional accessibility issues.
Website evaluation is an active area of research that combines elements from various fields (Chiou et al., 2010), including the technical aspects of e-service websites as well as administrative issues, such as how website features relate to service processes and customer behavior. In a study by Doush and Almiraj (2019), the researchers evaluated web accessibility issues facing people with disabilities in Kuwait in an effort to identify problems, raise government awareness, and promote inclusion. To assess the accessibility of e-government services in Kuwait, they applied both automated and expert evaluation to the top 17 e-government services in Kuwait in 2018. The results showed that 13 of the evaluated e-services were impossible to use, revealing a serious lack of compliance with Web Content Accessibility Guidelines (WCAG 2.0) Level A for most of the evaluated websites. Furthermore, the study demonstrates the importance of a task-based approach when assessing website accessibility, as navigating between different pages after completing each task can help identify additional accessibility issues.
In a statistical analysis study, researchers Salome et al. (2022) identified the relevant dimensions of e-service quality related to e-channels. The paper proposed an e-service quality model consisting of seven dimensions of e-service quality (website appearance, usability, reliability, security, customization, implementation, and responsiveness) and overall e-service quality. The study used a cross-sectional research design and a quantitative research approach. The researchers collected data via a questionnaire from 400 e-channel users in Lagos State, Nigeria. However, 318 copies of the questionnaire were found to be useful. The data were analyzed using mean, frequency, percentages, correlation, and multiple regression analysis. The results showed that the relevant e-service quality dimensions that influence overall e-service quality are reliability, security, fulfillment, ease of use, and responsiveness. These e-service quality dimensions are expected to provide managers with information to evaluate and improve the service delivery of their e-channels.
Further, in the study by Handayani et al. (2020), the researchers determined the level of user satisfaction with website services using the Webqual 4.0 method, a method for measuring website quality based on the perception of end users. The researchers relied on Webqual variables: usability, information quality, service interaction quality, and user satisfaction. They used the smartPLS application to process the research data to determine the validity and reliability of the data obtained. The results showed that ease of use, information quality, and service interaction had a positive impact on user satisfaction. Therefore, it can be concluded that usability, information quality, and service interaction quality affect user satisfaction with the covid19.kalbarprov.go.id website.
Researchers Suryani et al. (2020) studied the dimensions that determined website quality and e-service quality in small and medium-sized enterprises (SMEs) in Indonesia. As one of the important dimensions determining website quality, the study was conducted using a survey method with a questionnaire in which 379 SME customers participated. Website quality dimensions were measured using a Likert scale with five alternative answers. The results of the analysis conducted using Smart PLS showed that there are four dimensions of website quality determinants, the most influential of which were e-service quality, information quality, system quality, and image quality. Furthermore, for the dimensions of e-service quality, three important dimensions were identified, including achievement, responsiveness, and system availability.
In other studies, multi-criteria decomposition methods (MCDM) have been used to evaluate websites. Researchers Koliouska et al. (2021) evaluated the content of the websites of alternative tourism service providers in the Chania region of Greece. The sample consisted of 28 websites, which were evaluated across 11 performance criteria using the ELECTRE III multi-criteria method. The results of this study revealed differences in rankings between the two groups of websites based on company type, with the average ranking of resorts slightly lower than that of tour operators (i.e., resorts performed better). However, the difference was not found to be statistically significant.
Researchers Shayganmehr and Montazer (2021) then proposed a model for evaluating municipal e-service websites. They extracted the most effective evaluation indicators from previous studies, such as website design, responsiveness, security, content and information quality, citizen engagement, trustworthiness, support and maintenance, and service and usability, comprising 73 indicators. The indicators were weighted and grouped using the analytic hierarchy process (AHP) and the PROMETHEE method, respectively. Due to the ambiguity of some of the extracted indicators, fuzzy set theory was applied to the uncertainty model. Finally, the proposed model was used to evaluate the e-service websites of ten major Iranian municipalities. The final results showed that Qom and Kermanshah had the highest and lowest readiness for eservice websites, respectively.
In Li and Sun's (2020) study, the researchers evaluated and prioritized factors for designing a business-to-consumer (B2C) e-commerce website. They used the analytic hierarchy process (AHP) and the preferential ranking by similarity to an ideal solution (TOPSIS) technique to form FAHP and TOPSIS-Grey to minimize the possibility of error. Five main factors and nineteen sub-factors were selected. FAHP prioritized the factors based on their importance, and based on the results of FAHP, TOPSIS-Grey ranked five alternatives (e-commerce websites). The FAHP identified "service quality" as the most important factor in successful website design, while TOPSIS-Grey reported that "Website-3" was the most successful, after listing the factors required for successful website design.
In Muhammad et al.'s (2020) study, the researchers focused on identifying and prioritizing factors related to the design quality of e-learning systems using a hierarchical quality model. A comprehensive literature review was conducted to identify the factors that significantly influence the quality of web-based e-learning systems. The selected sample included 157 participants, including e-learning designers, developers, students, teachers, and education administrators. A second instrument was distributed to 51 participants to pairwise compare and rank the criteria according to their relative importance. The AHP approach was used to assign relative weights to key quality factors. The identified and prioritized factors were classified into four main categories. Of these four factors,
Then, in Table No. 01, we will summarize some of the tools used to evaluate websites in some previous studies.
Table 01. Tools used to evaluate websites:
|
Evaluation Tool Methodology |
Studies |
Brief description of the methodology or tool |
|
DEA model |
Wen et al. (2003) |
DEA does not require specific numerical weights or modeling preferences for analysis. Thus, this method uses DEA to provide ranked alternative assessments by requiring less information from decision makers. |
|
2QCV3Q model |
Arrue et al. (2007) |
It evaluates the quality of a website based on seven dimensions: who, what, why, when, where, how, by what means, and by what devices. |
|
WebQual |
Loiacono and Watson (2007) |
WebQual's consumer evaluation tool for websites. It was refined through a literature review and interviews with web designers and users, and tested using four samples of web consumers. WebQual includes 12 dimensions (task-relevant information, tailored information, trustworthiness, response time, ease of understanding, intuitive processes, visual appeal, innovation, emotional appeal, consistent image, online completeness, and relative advantage). |
|
Delphi method |
Alnsour et al. (2010) |
A multi-stage process designed to integrate individual opinions into a collective consensus. The method requires knowledgeable and experienced contributors to individually answer questions about the website and present their findings to a central moderator. The moderator processes the contributions and reports the results to the respondents. Respondents are then asked to re-present their opinions, aided by input from the moderator. This process continues until the moderator believes a consensus has been formed. The goal of this technique was to eliminate potential bias when diverse groups of experts come together. In the Delphi technique, experts do not know who the other experts are during the process. |
|
Analytic Hierarchy Process |
Dominic et al. (2013) |
AHP is a popular model for combining multiple criteria for decision making. |
|
DEMATEL-based analysis and the Analytical Network Process (ANP) (DANP) |
Chen et al. (2015) |
A new method combining DEMATEL and the Analytical Network Process (ANP) (DANP) The Decision-Making and Evaluation Laboratory (DEMATEL) method deals with the interrelationship between evaluation criteria and transforms the cause-and-effect relationships of the criteria into a visual structural map. |
|
ELECTER III |
Koliouska et al. (2021) |
The multi-criteria methods of the ELECTRE family use a higher-order relationship as a preference model to evaluate a set of alternatives. The ELECTRE III method is used for ranking purposes. The higher-order framework in this approach takes into account the strengths and weaknesses of each alternative against its peers. |
Source: Prepared by researchers based on previous studies
Study Tools and Methodology:
To prepare this study, a sample of 20 experts was collected in April 2025 to evaluate the e-services websites of wireless network companies operating in Algeria:
• Djezzy website:
-
• Ooredoo website: http://www.ooredoo.dz
-
• Mobilis website: https://www.mobilis.dz
The criteria reviewed in the literature were used to evaluate these three companies, as follows:
-
• Content : Web content refers to the audio, visual, or textual content available on a website. Content means that a website must be creative in terms of applications, text, images, e-services, and data (Li & Sun, 2020).
-
• Design : Design is the visual appearance of a website. A well-designed website can be very useful in attracting new customers and retaining existing ones, while a poorly designed website can have a negative impact (Iqbal et al., 2018).
-
• Organization : This criterion relates to the structure of website elements to help the user quickly access the required
information, navigate the website easily, feel comfortable within the consistency of its layout, and remain aware that they are still on the same website (Muhammad et al., 2020).
-
• Ease of Use : The primary purpose of providing service innovation is to enhance and provide ease of use for the customer and the target audience when using that particular service. This way, they can return, ultimately strengthening the relationship between customers and the organization, leading to increased profitability (Yang et al., 2014).
-
• Security : The degree to which a website is secure and protects all user information (H, Nomdoe et al., 2007).
Since criteria often have inconsistent dimensions in multi-criteria problems, this can create evaluation problems. Therefore, to avoid this issue, a fuzzy set system or logic is necessary (Kang et al., 2016).
-
1 / Fuzzy Z-Numbers: The Z-Number, introduced by Zadeh (2011), represents an ordered pair of fuzzy numbers, z = (A ̃ ⋅ B). Z-numbers include two types of fuzzy elements: the evaluation score and the reliability.
Generally, when facing a problem with incomplete or uncertain information, the degree of uncertainty can be represented using fuzzy numbers. However, Z-numbers provide more depth by including another important factor, which is the level of reliability associated with the information itself.
That is, measuring certainty by gathering the available fuzzy data and evaluating the level of confidence associated with this data. Recent research (Hsu et al., 2021) has shown that Z-numbers can be used in the context of multi-criteria decisionmaking (MCDM) methods, where they are used to evaluate different alternatives by combining fuzzy evaluations with their corresponding confidence levels.
The Z-number consists of two fuzzy numbers, z = (A ⋅ B), where A is the evaluation score and B is the reliability score, as follows:
A ̃ = ⌈ (f ⋅ μ _A ̃ ) ⌉ | x ∈ [0, 1] and B ̃ = ⌈ (x ⋅ μ _B ̃ ) ⌉ | x ∈ [0, 1]
The required triple (X, A, B) is referred to as a Z-evaluation (Aliev et al., 2020). A Z-evaluation defined by a set of the form (X, A, B) can be understood as X = (A, B), where X is the variable, A is a fuzzy set used to describe the constraint (variable), and B is a fuzzy number describing the partial reliability of A. Z-evaluations can be used to model sentences such as: “The temperature in winter will definitely be very low,” where X is the temperature variable, A is a fuzzy set representing "very low,"
and B is a fuzzy value representing "definitely." Since Z-numbers represent a relatively new concept, some operations, such as the distance between two Z-numbers, have not yet been defined.
We will therefore present a procedure for converting Z-numbers to fuzzy numbers proposed by B. Kang et al. (2012). Converting Fuzzy Z-Numbers to Ordinary Fuzzy Numbers: In this study, we will rely on triangular fuzzy numbers (TFNs) due to their ease of use and widespread application in many studies.
The Z-number is represented as z = (A ⋅ B), where A is the evaluation score and B is the reliability score, as follows: A ̃ = ⌈ (f ⋅ μ _A ̃ ) ⌉ | x ∈ [0, 1] and B ̃ = ⌈ (x ⋅ μ _B ̃ ) ⌉ | x ∈ [0, 1] i.e., = (lA, mA, uA) A ̃ and = (lB, mB, uB) B ̃ Triangular Fuzzy Numbers (TFN).
-
1-1 Converting Z-Number to Fuzzy Number:
Kang et al. (2012) defined a process to convert Z-numbers to fuzzy numbers by calculating fuzzy expectation.
This method can be summarized in the following two steps:
Step 1: Given a Z-number (A, B), the reliability B is converted to a crisp number using the midpoint method:
∫ ХНв ( X ) dx
=
∫ Ив ( х ) dx
For the triangular fuzzy number, the midpoint is calculated as follows:
а=(lB + тв + UB) ∕ 3 (1)
Step 2: Calculate the fuzzy number Za from the Z-number (A, B):
za ={ ⟨ х , Ha ( ХА ) ⟩ | На ( ХА )= «На ( х ), х ∈ √ ах }
Za =(√alA ⋅√ОСУПд ⋅√ОС И д) (
-
1-2 Linguistic Variables and Fuzzy Numbers: AA
According to Zadeh, traditional quantitative measurement methods are insufficient to express complex or uncertain situations. He emphasizes that this task requires linguistic variables. In this study, for the evaluation degree A, the linguistic variables "Very Good" (VG), "Good" (G), "Acceptable" (F), "Poor" (P), and "Very Poor" (VP) were used as categories for measuring the performance values of alternative websites. Fuzzy numbers defined by Quang et al. (2013) were used. As for the reliability degree B, the linguistic variables "Absolutely Sure", "Sure", "Almost Sure", "Uncertain", and "Absolutely Uncertain" were used. Fuzzy numbers defined by Nguyen et al. (2024) were employed.
The following table shows the linguistic scales and the corresponding membership functions for both the evaluation degree and the reliability level of fuzzy Z-numbers.
Table No. 02: Linguistic variables and ambiguous numbers
|
confidence level |
Evaluation score |
||
|
Membership function |
Linguistic scale |
Membership function |
Linguistic Scale |
|
(0.7 ، 1 ، 1) |
Very sure |
(0.8, 0.9, 1) |
Very Good |
|
(0.5 ، 0.7 ، 0.9) |
Sure |
(0.6, 0.7, 0.8) |
Good |
|
(0.3 ، 0.5 ، 0.7) |
Almost sure |
(0.4, 0.5, 0.6) |
Average |
|
(0.1 ، 0.3 ، 0.5) |
Not sure |
(0.2, 0.3, 0.4) |
Weak |
|
(0 ، 0 ، 0.3) |
Not very sure |
(0, 0.1, 0.2) |
Very Weak |
Source: Prepared by researchers based on the study (Quang et al., 2013) and the study (Nguyen et al., 2024)
-
1-3 Data Collection:
When using fuzzy numbers to evaluate or make a decision based on the opinions of multiple experts, the experts' opinions are aggregated to systematically reflect all perspectives. The goal of this method is to arrive at a fuzzy number that represents the group's collective assessment. In this study, we will use the aggregation method proposed by D. Kang et al. (2016), which states the following: D = (d^ dm. d)) :
dL = m in( d))
-
d m ^ d m
du = mad (d^)
where krepresents the number ofexperts
-
1- TOPSIS method:
The use of fuzzy numbers in TOPSIS to analyze criteria makes the evaluation process easier. Z-TOPSIS is therefore a simple and realistic form of modeling and compensation method that includes or excludes alternative solutions based on fixed pieces.
The idea of TOPSIS can be expressed in a series of steps (Olson, 2004):
-
(1) Obtain performance data for n alternatives across k criteria.
The initial measurements are usually standardized, and the initial measurements xijx_{ij}xij are converted to standardized measures.
-
(2) Establish a set of importance weights for each criterion. The basis for these weights can be anything, but it is usually a custom reflection of relative importance. The scale is not problematic if standardization was achieved in step (1).
-
(3) Identify the positive ideal solution (maximum performance for each criterion is A+A^+A+).
-
(4) Identify the negative ideal solution (minimum performance for each criterion is A - A^-A - ).
-
(5) Establish a distance measure on each criterion for both the ideal (D+D^+D+) and negative (D - D^-D - ).
-
(6) For each alternative, determine the ratio RRR, equal to the distance to the negative ideal divided by the sum of the distance to the negative ideal and the distance to the positive ideal. The best alternative is the one with the largest RRR value.
3 -Rank Order Centroid Method( ROC)
wj (ROC= - Z^-- where w_j represents the weight of the criteria, n is the number of criteria, and rk is the order of the criteria.
4-Case Study:
In this study, the weights of the criteria were calculated based on the ranking of the experts who responded to the questionnaires. Each expert ranked the criteria according to their own preferences. Data related to the rankings was then collected for all experts. We ranked the criteria from 1 to 5, with the smallest total ranking being 1, and so on, as shown in the following table:
Table No. 04: Criteria weights
|
Design DES |
Ease of Use EU |
Content CON |
Security SEC |
Regulation ORG |
|
|
Total |
69 |
60 |
48 |
44 |
79 |
|
Ranking |
4 |
3 |
2 |
1 |
5 |
|
Criteria Weight |
0.09 |
0.157 |
0.257 |
0.457 |
0.04 |
Source: Prepared by researchers using Excel 2016
To obtain the weights for the criteria, we compiled the rankings for each expert and for each criterion. From this compilation, the main criteria were re-ranked, with the best criterion, or the criterion that obtained first place, being the one with the smallest total. Table 4 shows that the security criterion ranked first, with a weight of 0.457 based on the ROC method equation. The organization criterion ranked last, with a weight of 0.04. The remaining results are shown in the following figure.
Figure 01: Weight of main criteria
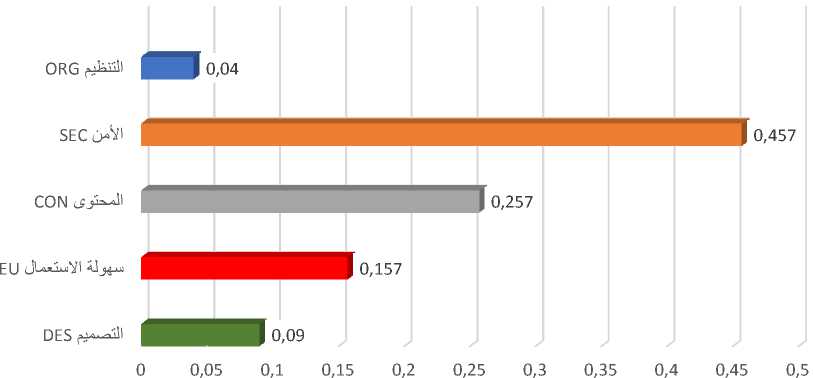
Source: Prepared by researchers
Figure 1 shows that the most influential dimension is the security criterion, which received the highest relative weight (45.7%). This highlights the importance of securing websites against cyber threats and protecting user data. Content ranked second (25.7%), reflecting the importance of aesthetics and modern links. Ease of use ranked third (15.7%). The least influential dimensions were design and organization, which received lower weights (9% and 4%, respectively). This indicates that users may prefer technical functionality and security over aesthetics.
Creating a Decision Matrix
In this study, five criteria and three alternatives were ranked based on the Z-TOPSIS method. The table below shows the type of criterion and the weight assigned to each criterion. This was based on the opinions of twenty experts: nine experts with a state engineering degree specializing in artificial intelligence, five experts with an engineering degree specializing in information technology, and six university professors in the field of marketing.
The alternatives were evaluated based on the various criteria, and the results of the decision matrix are shown as follows.
Table No. 05: Decision Matrix
|
Design DES |
Ease of Use EU |
Content CON |
Security SEC |
Regulation ORG |
|||||||||||
|
Djezzy website |
0.504 |
0.6521 |
0.95 |
0.504 |
0.6616 |
0.95 |
0.504 |
0.6532 |
0.95 |
0.504 |
0.6704 |
0.95 |
0.504 |
0.6711 |
0.95 |
|
Ooredoo website |
0.504 |
0.67495 |
0.95 |
0.504 |
0.6451 |
0.95 |
0.504 |
0.6623 |
0.95 |
0.504 |
0.6272 |
0.84 |
0.504 |
0.6539 |
0.95 |
|
Mobilis website |
0.504 |
0.6521 |
0.95 |
0.504 |
0.6711 |
0.95 |
0.504 |
0.6605 |
0.95 |
0.504 |
0.6514 |
0.95 |
0.504 |
0.6616 |
0.95 |
Source: Prepared by researchers
- Creating a unified decision matrix
Based on the positive and negative optimal solutions, the unified decision matrix can be calculated using the following relationship:
л/
’и
(aij ^ij cij\
, ,
\c i ci ci
; i = maxi Cij ; Positive ideal solution
̃u =( , , ) ; di = ; Negative ideal solution cij ^ij aij
The unified decision matrix is shown in the table below.
Table 6: Unified Decision Matrix
|
Standard weights |
0.09 |
0.157 |
0.257 |
0.457 |
0.04 |
||||||||||
|
Design DES |
Ease of Use EU |
Content CON |
Security SEC |
Regulation ORG |
|||||||||||
|
Djezzy website |
0.5305 |
0.6864 |
1.0000 |
0.5305 |
0.6964 |
1.0000 |
0.5305 |
0.6876 |
1.0000 |
0.5305 |
0.7057 |
1.0000 |
0.5305 |
0.7064 |
1.0000 |
|
Ooredoo website |
0.5305 |
0.7105 |
1.0000 |
0.5305 |
0.6791 |
1.0000 |
0.5305 |
0.6972 |
1.0000 |
0.5305 |
0.6602 |
0.8842 |
0.5305 |
0.6883 |
1.0000 |
|
Mobilis website |
0.5305 |
0.6864 |
1.0000 |
0.5305 |
0.7064 |
1.0000 |
0.5305 |
0.6953 |
1.0000 |
0.5305 |
0.6857 |
1.0000 |
0.5305 |
0.6964 |
1.0000 |
Source: Prepared by researchers
- Creating a weighted standard decision matrix
Given the different weights for each criterion, the weighted standard decision matrix can be calculated by multiplying the weight of each criterion by the standard decision matrix, according to the following formula.
. ̃ ij = ̃ ij . ̃ ij
حیث ̃ jj یمثل وزن Cj
The following table shows the weighted decision matrix.
Table No. 07: Weighted Decision Matrix
|
Weighted Normalized fuzzy decision matrix |
|||||||||||||||
|
Standard weights |
0.09 |
0.157 |
0.257 |
0.46 |
0.04 |
||||||||||
|
Design DES |
Ease of Use |
EU |
Content CON |
Security SEC |
Regulation ORG |
||||||||||
|
Djezzy website |
0.0477 |
0.0618 |
0.0900 |
0.0833 |
0.1093 |
0.1570 |
0.1363 |
0.1767 |
0.2570 |
0.2425 |
0.3225 |
0.4570 |
0.0212 |
0.0283 |
0. |
|
Ooredoo website |
0.0477 |
0.0639 |
0.0900 |
0.0833 |
0.1066 |
0.1570 |
0.1363 |
0.1792 |
0.2570 |
0.2425 |
0.3017 |
0.4041 |
0.0212 |
0.0275 |
0. |
|
Mobilis website |
0.0477 |
0.0618 |
0.0900 |
0.0833 |
0.1109 |
0.1570 |
0.1363 |
0.1787 |
0.2570 |
0.2425 |
0.3134 |
0.4570 |
0.0212 |
0.0279 |
0. |
Source: Prepared by researchers
Determine the fuzzy positive ideal solution (FPIS A+) and the fuzzy negative ideal solution (FNIS A-). The FPIS and - FNIS alternatives can be defined as follows:
A+ ={ ̃1+ , ̃ * ,
A- ={ ̃ i , ̃2,
max vij | i ∈ В ),(min vij | i ∈ C )} min vij | i ∈ В ), (max vij | i ∈ C )}
Where ̃ is the maximum value of i
̃ -^ is the minimum value of i for all alternatives. B and C represent the optimal solutions.
Table 8: Positive and Negative Ideal Solutions
|
Positive solution |
negative solution |
|
|
Design |
(0.0477, 0.0639, 0.0900) |
(0.0477,0.0618 ,0.0900 ) |
|
Ease of Use |
(0.0833, 0.1109, 0.1570) |
(0.0833, 0.1066, 0.1570) |
|
Content |
(0.1363, 0.1792, 0.2570) |
(0.1363, 0.1767, 0.2570) |
|
Security |
(0.2425, 0.3225, 0.4570) |
(0.2425, 0.3017, 0.4041) |
|
Organization |
(0.0212, 0.0283, 0.0400) |
(0.0212, 0.0275, 0.0400) |
- Source: Prepared by researchers
- Calculate the distance between each alternative and the vague positive ideal solution. Д+ The distance between each alternative and the ideal solution is negative and ambiguous. Д “
The distance between each alternative and the FPIS and the distance between each alternative and the FNIS are calculated respectively as follows:
5 * = ^= i d( Vj, V*) i=1,2,^,m
S~ = ?}=id( vj, v~) i=1,2,^,m d It is the distance between two fuzzy numbers, given two triangular fuzzy numbers.
( a i ,ft i ,c i ) = Mi
And ‘ (a2 ,b2 ,c2 ) = M
The distance e between the two numbers can be calculated as follows::
dv (Mi,M2)= ^O—ij2-^^
We mark that d^Vij, V*)j ((v,], V~) became non vague numbers
The table below shows the distance from the positive and negative ideal solutions.
Table No. 09: Distance from positive ideal solutions
|
Distance from FPIS |
5 * |
|||||
|
Djezzy website |
0.0012 |
0.0009 |
0.0014 |
0.0000 |
0.0000 |
0.0036 |
|
Ooredoo website |
0.0000 |
0.0025 |
0.0000 |
0.0328 |
0.0004 |
0.0357 |
|
Mobilis website |
0.0012 |
0.0000 |
0.0003 |
0.0053 |
0.0002 |
0.0070 |
- Source: Prepared by researchers
Table 10: Distance from negative ideal solutions
Source: Prepared by
- Calculating the convergence coefficient and ranking the alternatives:
The convergence coefficient can be calculated for each alternative as follows:
The best alternative is the one closest to the FPIS and farthest from the FNIS. The convergence coefficient for each alternative and its ranking order are shown in the table below.
Table 11: Convergence coefficient
|
Convergence coefficient Ci |
Arrangement ا |
|
|
Djezzy website |
0.9068 |
1 |
|
Ooredoo website |
0.0696 |
3 |
|
Mobilis website |
0.8329 |
2 |
- Source: Prepared by researchers
Discussion of the Results:
We note that the convergence coefficient for the Djezzy website is greater than the convergence coefficient for the Mobilis and Ooredoo websites. Therefore, based on the opinions of the experts who were relied upon to answer the questionnaire, and after applying the Z-TOPSIS and ROC methods, this study concludes that the best website is the DDjezzy website, followed by the Mobilis website, and then the Ooredoo website. The results confirmed that security, content, and ease of use are the primary factors determining the effectiveness of websites, which requires decisionmakers to focus on improving these aspects to ensure the provision of high-quality electronic services.
Conclusion:
Website quality assessment is inherently a multi-criteria problem that must consider both quantitative and qualitative attributes. While quantitative criteria, such as load speed or number of errors, can be measured objectively, qualitative criteria, such as user satisfaction and design appeal, often require subjective judgment. This makes the evaluation process more complex and imprecise. As a result, users tend to base their judgments on ambiguous or fuzzy numbers, which are easier to interpret than precise numerical values in cases where complete certainty is not possible.
In this study, we used the fuzzy Z-TOPSIS approach to evaluate the electronic service websites of wireless telecommunications companies in Algeria. The fuzzy Z-TOPSIS method is particularly useful for situations where uncertainty exists, as it allows for the incorporation of expert opinions expressed in fuzzy terms rather than precise measurements. Our proposed model consisted of five key evaluation criteria: security, content, ease of use, design, and organization. We evaluated three websites—DDjezzy, Mobilis, and Ooredoo—using this model.
The first step in our approach involved gathering evaluations from 20 experts, each contributing their opinions based on the five criteria. These experts were from various backgrounds, including engineering, information technology, and marketing, ensuring a broad perspective on the websites' performance. After collecting the data, we applied the Z-TOPSIS and ROC methods to aggregate the expert evaluations and generate an overall performance rating for each website. The results indicated that DDjezzy ranked first, followed by Mobilis, and finally Ooredoo.
The findings of this study underscore the importance of three primary factors—security, content, and ease of use—in determining the effectiveness of websites. These dimensions play a critical role in users' overall experience, and their importance should not be underestimated by decision-makers. Given that security and ease of use are essential for ensuring a positive user experience, it is crucial for organizations to continually improve these aspects. Ensuring robust security features and a seamless, user-friendly interface will help attract and retain customers, ultimately contributing to the success of the website.
The results also highlight the need for further exploration in the field of website evaluation. While the Z-TOPSIS approach provided valuable insights, it would be beneficial to compare these findings with results from other fuzzy multicriteria decision-making (MCDM) methods such as AHP, VIKOR, ELECTRE, and PROMETHEE. These methods could offer different perspectives on website performance and allow for more comprehensive analysis. Additionally, future studies could focus on refining the criteria and incorporating other dimensions, such as customer support, visual appeal, and responsiveness, to better capture the complexities of website quality.
Moreover, as websites continuously evolve, regular re-assessments using such methods will ensure that businesses stay aligned with user expectations and technological advancements. In conclusion, the application of fuzzy MCDM methods like Z-TOPSIS offers a practical approach for evaluating website quality, providing decision-makers with actionable insights that can be used to enhance their services and improve customer satisfaction.
