Evoked Brain Activity in Food Preference Decisions: Links to Eating Behavior and General Nutritional Knowledge

Author: Pavel Ermakov, Ekaterina Denisova, Daria Kirpu, Anastasia Gosteva, Nadejda Sylka
Journal: International Journal of Cognitive Research in Science, Engineering and Education @ijcrsee
Section: Original research
Article in issue: 1 vol.13, 2025.
Free access
The article explores the characteristics of evoked brain activity during food preference decisions, emphasizing the role of psychological and neurophysiological mechanisms. The relevance of studying eating behavior as a multifaceted phenomenon is highlighted, with attention to the cognitive, emotional, and physiological factors that influence food preferences. The study involved 40 participants (70% female). Psychological testing included the Dutch Eating Behavior Questionnaire (Russian version by I.G. Malkina-Pykh, 2007), the Thought and Behavior Questionnaire (adapted by A.V. Anikina and T.A. Rebeko, 2009), the Three-Factor Eating Questionnaire (Russian version, 2018), and the General Nutrition Knowledge Questionnaire (translated version of Kliemann, 2016). Neurophysiological data were collected using EEG tasks based on a Go/NoGo paradigm. Mathematical and statistical methods included the Shapiro-Wilk test, Mann-Whitney U test, Student’s t-test, and k-means cluster analysis. The study revealed significant differences in brain activity between groups with varying psychological characteristics and levels of nutritional knowledge. These findings align with previous research, confirming the link between cognitive control, impulsivity, and food preferences. Enhanced activation in the temporo-occipital regions was observed in participants with higher nutritional awareness. The role of psychological traits was found to outweigh knowledge levels in shaping dysfunctional eating patterns, highlighting the need for individualized approaches in prevention and treatment. The limitations, including the sample size and absence of participants with clinical eating disorders, are discussed alongside recommendations for future research.
Eating behavior, rational consumption, cognitive control, evoked activity, ERP, Food Preference
Short address: https://sciup.org/170209042
IDR: 170209042 | UDC: 159.91, 612.82-008.6 | DOI: 10.23947/2334-8496-2025-13-1-15-31
Text of the scientific article Evoked Brain Activity in Food Preference Decisions: Links to Eating Behavior and General Nutritional Knowledge
In recent years, research on the psychophysiological mechanisms of eating behavior has expanded into several distinct directions. Numerous studies highlight distinctive patterns of brain activity in individuals with eating disorders, with meta-analyses identifying key research areas ( Wonderlich et al., 2021 ). One of these focus areas includes examining cognitive control and reward system mechanisms through neuroscience-derived approaches.

© 2025 by the authors. This article is an open access article distributed under the terms and conditions of the Creative Commons Attribution (CC BY) license .
Building on the understanding of the reward system’s role in eating behavior, cognitive control has also emerged as a critical factor influencing maladaptive weight-loss strategies in eating disorders. Deficits in cognitive control are closely linked to impulsivity, a key predictor of pathological overeating ( Пичиков et al., 2018 ; Oliva et al., 2019 ). Studies demonstrate that individuals with compulsive overeating exhibit reduced inhibitory control and attentional selectivity, which also impacts cognitive task performance. For instance, differences in brain activity during Go/NoGo tasks have been observed predominantly in individuals with severe disorders manifestations ( Berner et al., 2023 ; Lyu et al., 2018 ). Moreover, cognitive control levels have been shown to predict treatment outcomes in cognitive-behavioral therapy (CBT) for eating disorders, particularly binge eating and obesity, as well as the durability of remission. For example, individuals struggling with interference control in the Stroop task exhibited lower treatment efficacy ( Hamatani et al., 2021 ).
ERP studies have highlighted distinct neural correlations of eating behavior in individuals with excess weight, particularly the P300, N200, and P200 components. These components reflect variations in cognitive control, behavioral regulation, and appetite response. A systematic review ( Chami, 2019 ) of ERP studies of neural responses to food and non-food stimuli among individuals with eating and weight disorders revealed an enhanced attentional bias toward food stimuli, as evidenced by elevated P300 and LPP amplitudes, across groups of individuals with excess weight from those of healthy weight. However, among individuals with obesity, the N200 amplitude positively correlated with caloric intake, while the P300 amplitude was sensitive to hunger levels ( Chami, 2019 ).
P300 amplitude increase in response to food stimuli, regardless of type, has been observed in groups with excess weight. Interestingly, the presence of this component, coupled with a preference for low-calorie food in experimental settings, also predicted snack frequency within the sample. Similarly, the emergence of the N200 component has been associated with low levels of eating behavior control in obesity ( Biehl et al., 2020 ). The P200 component has also been highlighted in several studies, showing increased prevalence in individuals with excess weight in response to food stimuli ( Liu et al., 2020 ; Schwab et al., 2021 ). This component has been linked to appetite suppression when a discrepancy arises between expected and actual food stimuli ( Schwab et al., 2021 ). However, the relationship between cognitive control and obesity remains ambiguous, as some animal studies suggest that rather than cognitive control deficits causing obesity, obesity itself might lead to diminished cognitive control ( Davidson et al., 2019 ). At the same time, lifestyle factors may amplify or modify these neural predispositions. Research suggests that diets rich in ultra-processed foods not only distort reward system functioning but also reinforce habitual overeating, creating a feedback loop that exacerbates obesity risk ( Edwin and Tittgemeyer, 2020 ). Moreover, the interaction between behavioral patterns and reward system activity may perpetuate maladaptive eating behaviors. For instance, repetitive exposure to specific food-related cues can alter the reward system’s sensitivity, maintaining disordered eating tendencies and shaping long-term dietary habits ( Frank et al., 2021 ). So, these findings may also suggest that while neural activity in response to food cues is heightened in individuals with eating and weight disorders, its manifestation may depend on specific states (e.g., hunger) or traits (e.g., restrained eating). Furthermore, prolonged exposure to food-related cues has been linked to weakened cognitive control, potentially contributing to overeating and other maladaptive behaviors.
Several other studies have demonstrated that cognitive control weakens in individuals with obesity or dieting tendencies under prolonged exposure to triggers, leading to deteriorations in eating behavior, such as overeating ( Schienle et al., 2019 ). Simultaneously, the anticipation of food rewards decreases attention and increases impulsivity ( Schiff et al., 2021 ), which is supported by improvements in cognitive control when the reward anticipation is more distant. The automatic and controlled aspects of eating behavior are interrelated, and avoiding contextual triggers can improve cognitive control and lead to healthier eating behavior ( Fürtjes et al., 2020 ). Additionally, cognitive-behavioral therapy (CBT) integrated with cognitive training exercises has shown promise in improving inhibitory control, a key factor in preventing compulsive overeating ( Manasse et al., 2020 ). Emerging evidence also supports the effectiveness of combining cognitive training and CBT for regulating eating behaviors, including those within normative ranges ( Yang et al., 2019 ). Additionally, interventions such as guided self-help CBT have shown potential in reducing maladaptive eating behaviors, highlighting the impact of cognitive and behavioral regulation on managing these risks ( Setsu et al., 2018 ).
Thus, the data on the psychophysiological mechanisms of eating behavior confirms the significance of cognitive control and the reward system in regulating eating habits and their role in the development of eating disorders. Investigating evoked brain activity in food preference decisions and its relationship to eat- ing behavior and general nutritional knowledge can provide valuable insights into the neural mechanisms underlying behind rationality of food preferences and consumption. Such an approach will be contributing to the development of more precise and personalized interventions for preventing and treating eating disorders.
Materials and Methods
The sample consisted of 40 participants aged 18 to 25 years (70% female). EEG data were collected from 26 participants aged 18 to 33 years (80% female). None of the participants reported diagnosed disorders or complaints related to eating behavior. Participation was voluntary. All participants were briefed on the study’s objectives and procedures and provided written informed consent.
Participants were asked to report their gender, age, and answer a series of questions regarding general nutritional knowledge using the translated version of the General Nutrition Knowledge Questionnaire ( Kliemann et al., 2016 ).
To study the psychological aspects of eating behavior, the following methods were employed: Dutch Eating Behavior Questionnaire (DEBQ) (T. VanStrien et al., 1986; Russian adaptation by I.G. Malkina- Pykh, 2007 ), Thoughts and Behaviors Questionnaire (TBQ) (M. Cooper, G. Todd, R. Woolrich, 2006; Russian adaptation by A.V. Anikina, T.A. and Rebeko, 2009 ), Three-Factor Eating Questionnaire (TFEQ) ( A. Stunkard, S. Messic, 1985 ; Russian version, 2018).
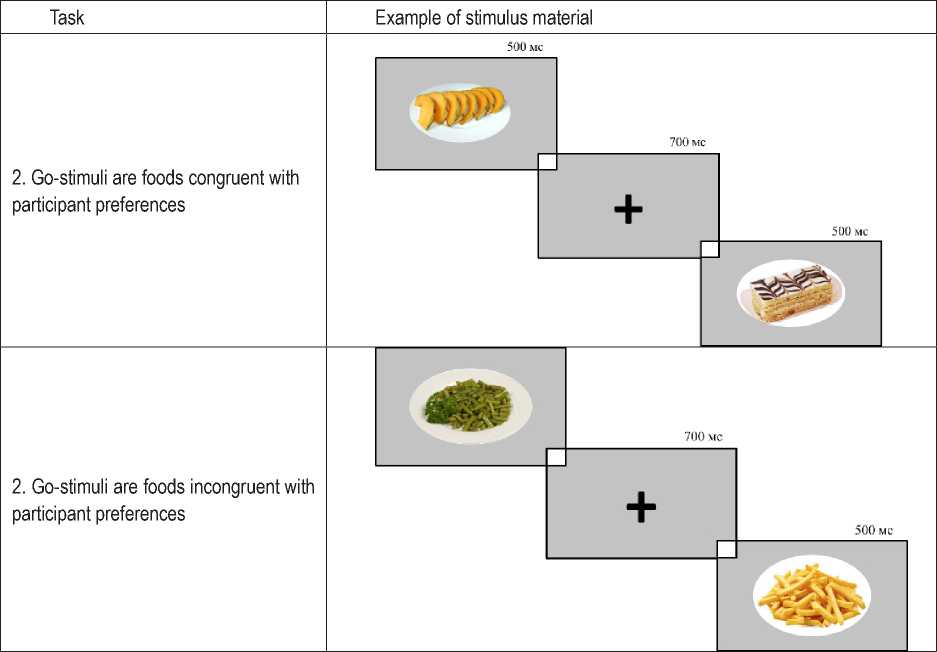
To explore food preferences, a protocol for an experimental psychophysiological study was developed, which included two types of tasks. Computerized tasks were programmed and performed using the PsychoPy software and included high-resolution images of food items collected from the Internet (examples are shown in Table 1).
The task was modeled as a variation of the Go/NoGo paradigm. Stimuli consisted of images of various food items. The test was conducted in two series: the first series involved selecting food stimuli congruent with the participant’s preferences; the second series involved selecting food stimuli incongruent with the participant’s preferences. Images of various food items that matched (first series) or did not match (second series) the participant’s preferences were used as target stimuli with a Go response. Each series included 150 stimuli presented in random order, with a stimulus exposure time of 500 ms.
Table 1. Examples of stimuli by series
ERP was recorded using a “Neurovisor 136” electroencephalograph, in 128 channels (monopolar montage with A1 and A2 ear electrodes as a references). EEG data were processed using WinEEG software. For ERP pre-stimulus interval was limited to 200 ms, and the post-stimulus interval was set to 700 ms.
Statistical methods: distribution parameter analysis was conducted using the Shapiro-Wilk test. Comparative analyses were performed using the Mann-Whitney U test and Student’s t-test, with effect sizes calculated using Cohen’s d and biserial correlation coefficients. Additional analyses included oneway analysis of variance (ANOVA), Spearman’s rank correlation coefficient, and k-means cluster analysis.
Results
To classify participants based on multiple indicators of eating behavior, a cluster analysis (K-means clustering) was conducted. The following variables were used for clustering: restrictive, emotional, and external eating behavior (Dutch Eating Behavior Questionnaire); negative, positive, and permissive thoughts; dieting and overeating; concerns about clothing, weight, and shape; food-related behaviors and the eating process (Thoughts and Behavior Questionnaire); as well as restraint, disinhibition, and hunger susceptibility (Three-Factor Eating Questionnaire). As a result, two distinct clusters were identified, differing in the severity of eating behavior traits, cognitive patterns, and behavioral aspects of nutrition. Cluster 1 (n = 25, 22 women, 3 men, mean age = 29) was characterized by low to moderate levels across these indicators, reflecting a healthy eating behavior style. Cluster 2 (n = 15, 14 women, 2 men, mean age = 29) exhibited moderate to high levels of the same indicators, suggesting a tendency toward disordered eating patterns.
Table 2. Results of the analysis of differences between clusters based on the indicators used for clustering
|
Indicator |
Cluster 1 |
Means Cluster 2 |
Between-group variance |
Within-group variance |
F |
Significance level |
|
Restrictive eating behavior |
1,94 |
2,91 |
9,30 |
23,30 |
15,57 |
0,000 |
|
Emotional eating behavior |
1,78 |
2,59 |
6,29 |
28,47 |
8,62 |
0,006 |
|
External eating behavior |
2,76 |
3,18 |
1,68 |
10,69 |
6,13 |
0,018 |
|
Negative thoughts |
6,46 |
42,05 |
12360,95 |
8351,00 |
57,73 |
0,000 |
|
Positive thoughts |
4,40 |
30,19 |
6487,76 |
5264,44 |
48,06 |
0,000 |
|
Permitting thoughts |
22,23 |
48,57 |
6769,97 |
10269,67 |
25,71 |
0,000 |
|
Diet |
15,00 |
30,86 |
2453,85 |
7996,00 |
11,97 |
0,001 |
|
Overeating |
14,57 |
38,39 |
5536,76 |
4794,88 |
45,03 |
0,000 |
|
Clothing |
12,56 |
50,88 |
14322,33 |
10627,91 |
52,56 |
0,000 |
|
Weight and shape |
7,12 |
39,25 |
10071,58 |
10519,64 |
37,34 |
0,000 |
|
Behavior associated with food |
17,87 |
32,08 |
1971,65 |
12728,11 |
6,04 |
0,019 |
|
The process of eating |
17,20 |
31,09 |
1883,28 |
8466,11 |
8,68 |
0,005 |
|
Restriction |
4,40 |
7,75 |
109,49 |
575,00 |
7,43 |
0,010 |
|
Disinhibition |
2,88 |
6,44 |
123,47 |
244,58 |
19,69 |
0,000 |
|
Sensitivity to hunger |
3,08 |
4,25 |
13,36 |
172,84 |
3,01 |
0,090 |
In the analysis of group differences, significant variations were observed in eating behavior traits, as measured by the Dutch Eating Behavior Questionnaire (DEBQ) (Table 2). Cluster 1 displayed scores at the lower boundary of normative values for restrictive and external eating behaviors, with notably low scores for emotional eating. Restrictive eating scores (1.9) suggest that respondents in this cluster do not make intentional efforts to lose or maintain weight. Furthermore, their need for food likely aligns more closely with actual hunger cues (external eating behavior score: 2.76). The low emotional eating score characterizes this group as exhibiting a healthy eating style, without a tendency to use food as a coping mechanism for stress.
In contrast, Cluster 2 demonstrated elevated scores across all three scales of the DEBQ. The restrictive eating score (2.9) indicates a preoccupation with weight gain and attempts to restrict food intake. Higher emotional eating scores reflect a propensity to use food as a means of coping with emotional distress. Regarding external eating behavior, participants in this cluster are less guided by internal hunger signals and more influenced by external food-related stimuli when making decisions about eating.
Eating-related thought processes also significantly differed between clusters. Respondents in Cluster 1 scored low across all scales, indicating minimal engagement with negative, positive, or permissive thoughts regarding food. Conversely, Cluster 2 exhibited substantially higher scores, mostly within average ranges, suggesting a stronger tendency to associate food with guilt, loss of control, weight gain, and punishment. Permissive thoughts in Cluster 2 appeared to counterbalance negative ones, allowing participants to justify food-related behaviors.
Behavioral patterns further highlighted differences: Cluster 1 scored low across all measures, while Cluster 2 showed higher scores for behaviors such as “Clothing,” “Weight and Shape,” and “Overeating.” These scores suggest that individuals in Cluster 2 are more prone to overeating and tend to conceal their bodies with specific clothing to mask their shape.
The Three-Factor Eating Questionnaire (TFEQ) revealed notable differences between clusters as well. Cluster 1 had consistently low scores across all three factors, whereas Cluster 2 showed scores for restraint and disinhibition twice as high as those in Cluster 1, although still within the lower end of the normative range. This suggests that participants in Cluster 2 are more inclined to restrict their food intake to manage body weight and size and are also more prone to impulsive eating behaviors. The “Hunger Susceptibility” factor remained within normal limits for both groups, indicating a general ability to manage hunger and cravings in both clusters.
Considering the absence of high scores across both clusters, it can be concluded that the sample overall does not exhibit dysfunctional eating patterns.
In summary, the two groups differ significantly in the extent of restrictive, emotional, and external eating behaviors; the presence of negative, positive, and permissive thoughts; behavioral patterns; and restraint and disinhibition in eating. Cluster 1 is characterized by a healthier eating style, whereas Cluster 2 shows greater concern with weight management or reduction.
Regarding differences in general awareness and knowledge about nutrition and health, Cluster 2 showed significantly higher levels of both general awareness and specific knowledge about the effects of food on health compared to Cluster 1, which exhibited lower scores in these areas. The results of the statistical analysis are presented in Figure 1.
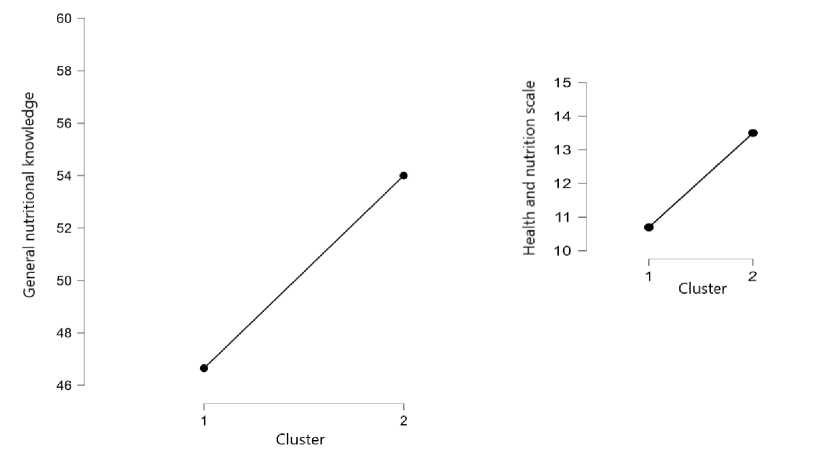
Figure 1. Differences Between Clusters in General Awareness of Nutrition and Health (p<0.05)
These defferences align with the hypotheses proposed earlier. The findings likely reflect the characteristics of the clusters. Since Cluster 2 is generally more concerned with weight maintenance and reduction, as well as dietary control, their higher levels of general awareness of nutrition and health may reflect a greater interest in these topics.
Task 1: congruent choice
jl ii|ll l|
„ j Deserts„ , rood food vegetables
-
■ Cluster 1 15,42 10,08 17,5419,71
-
■ Cluster 2 19,07 12,36 22,0724
Figure 2. Analysis of Food Preferences Among Respondents
An analysis of average scores for food preferences among respondents in both clusters revealed a tendency to select healthier options, particularly vegetables and fruits. Respondents from both clusters showed the least preference for desserts (Cluster 1: 10.08; Cluster 2: 12.36). Differences in food preferences between the two clusters indicate that respondents in Cluster 2 had higher average scores across all food categories, with a particularly noticeable gap in the selection of low-calorie foods (Cluster 1: 17.54; Cluster 2: 22.07) and fruits and vegetables (Cluster 1: 19.71; Cluster 2: 24). Respondents in Cluster 2 also scored higher in their preference for fatty foods (Cluster 1: 15.42; Cluster 2: 19.07).
Task 2: incongruent choice
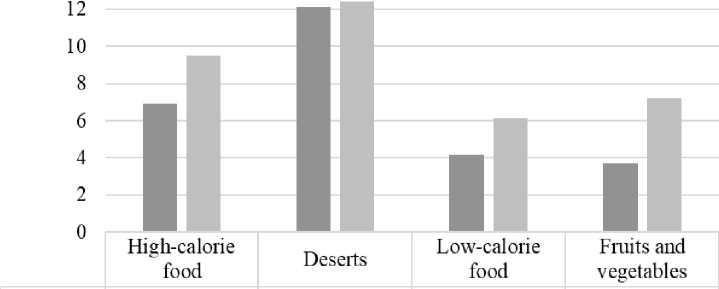
■ Cluster 1 6,92 12,13 4,17 3,71
■ Cluster 2 9,5 12,43 6,14 7,21
Figure 3. Analysis of Food Choices Incogruent to Preferences
When analyzing food choices that diverged from respondents’ stated preferences, Cluster 2 participants again demonstrated higher average scores across all food categories. For both clusters, desserts were the least chosen items. The smallest difference between clusters was observed in desserts as a category of non-preferred food (Cluster 1: 12.13; Cluster 2: 12.43). Low-calorie foods and fruits/vegetables were less frequently chosen as non-preferred items, with Cluster 1 participants more frequently selecting low-calorie foods (Cluster 1: 4.17; Cluster 2: 6.14), while Cluster 2 participants favored fruits and vegetables (Cluster 1: 3.71; Cluster 2: 7.21). Fatty foods, as non-preferred items, were also selected more often by Cluster 2 participants than Cluster 1 (Cluster 1: 6.92; Cluster 2: 9.5).
Overall, both clusters showed a general preference for healthier food options, particularly fruits and vegetables, and the least preference for desserts. However, Cluster 2 participants displayed higher average scores across all food categories, especially in the selection of low-calorie foods and fruits/veg-etables. These findings suggest that respondents in Cluster 2 are inclined toward more differentiated food choices, which aligns with the overall characteristics of the cluster.
Heatmap analysis revealed higher amplitudes of evoked potentials during congruent food choice tasks in the first series for Cluster 2 participants. These increased amplitudes were observed in early- and mid-latency components across all types of stimuli (Figure 4).
High-calorie food
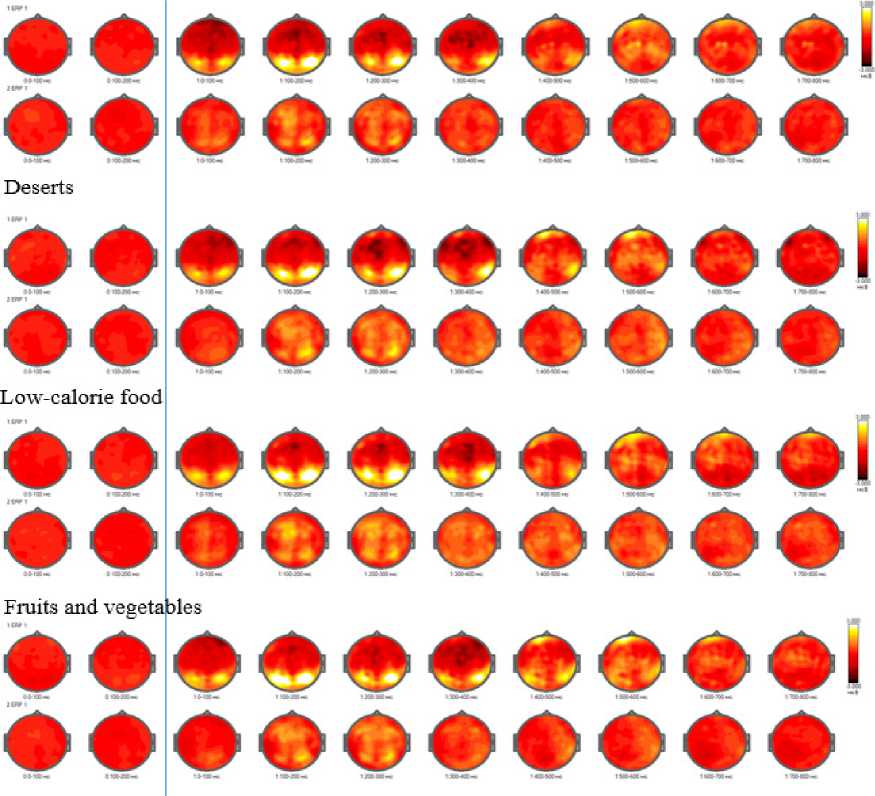
Figure 4. Temporal Dynamics of Average Amplitude of Evoked Potentials (EP) in Food Preference Task 1 in Clusters Based on Psychological Eating Behavior Characteristics (Cluster 1 - Bottom Row, Cluster 2 - Top Row)
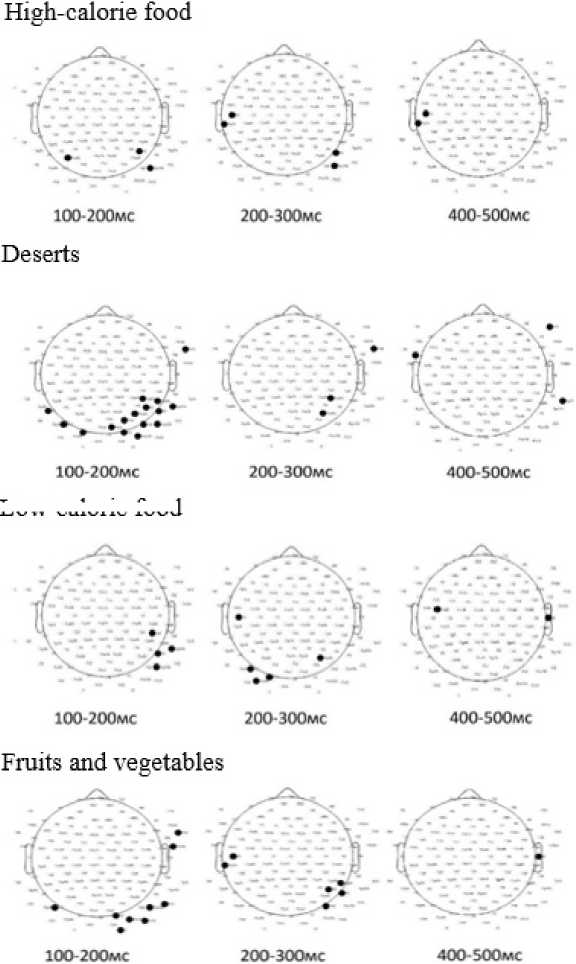
Statistically significant differences between the clusters were found in tasks involving congruent food choices. When accessing low-calorie dishes, differences were observed in the central-parietal region at 100–200 ms, in the central and temporal regions at 200–300 ms, in the left frontal area at 300–400 ms, and in the left fronto-central region at 400–500 ms. Similar differences were noted when viewing dessert images, with distinctions appearing in the temporal region at 100–200 ms, in the central, parietal, and frontal regions at 200–300 ms, in the frontal region at 300–400 ms, and in the left fronto-temporal and fronto-central regions at 400–500 ms. For fruits and vegetables, significant differences emerged in the occipital region at 100–200 ms, in the temporal regions at 200–300 ms, in the temporal region and a single frontal electrode at 300–400 ms, and at single electrodes in the left fronto-central region at 400–500 ms. In response to high-calorie foods, differences were detected in the central-parietal region at 100–200 ms, in the central-frontal and parietal regions at 200–300 ms, in the left frontal area at 300–400 ms, and in the left fronto-central and right fronto-temporal regions at 400–500 ms.
The observed temporal and topographical differences in processing various food types (low-calorie, high-calorie, desserts, fruits, and vegetables) suggest variability in cognitive and emotional responses depending on the food category. More pronounced differences in the temporal and frontal regions for desserts and high-calorie foods may indicate greater involvement of reward-related and cognitive control areas.
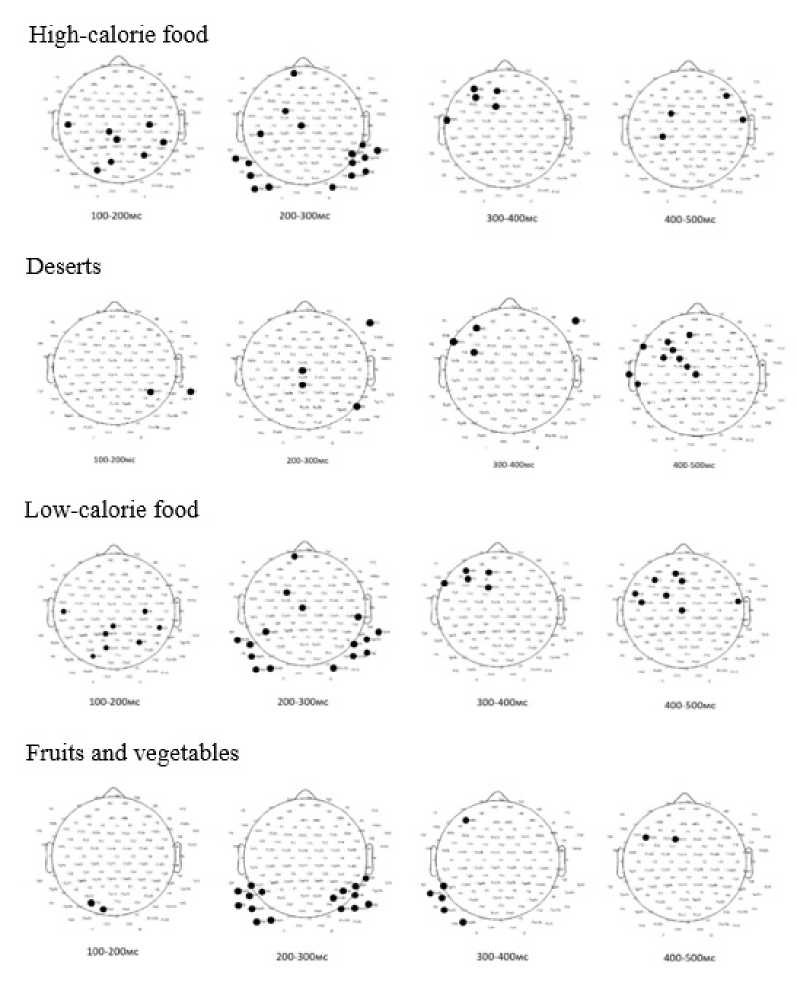
Figure 5. Analysis of Differences in Average EP Amplitude in Food Preference Task 1 in Clusters Based on Psychological Eating Behavior Characteristics (p<0.05)
When performing the task of making food choices incongruent with dietary preferences in the second series, a higher amplitude of evoked potentials (EP) of early and middle latency was also observed in the second cluster, regardless of stimulus type (Figure 6).
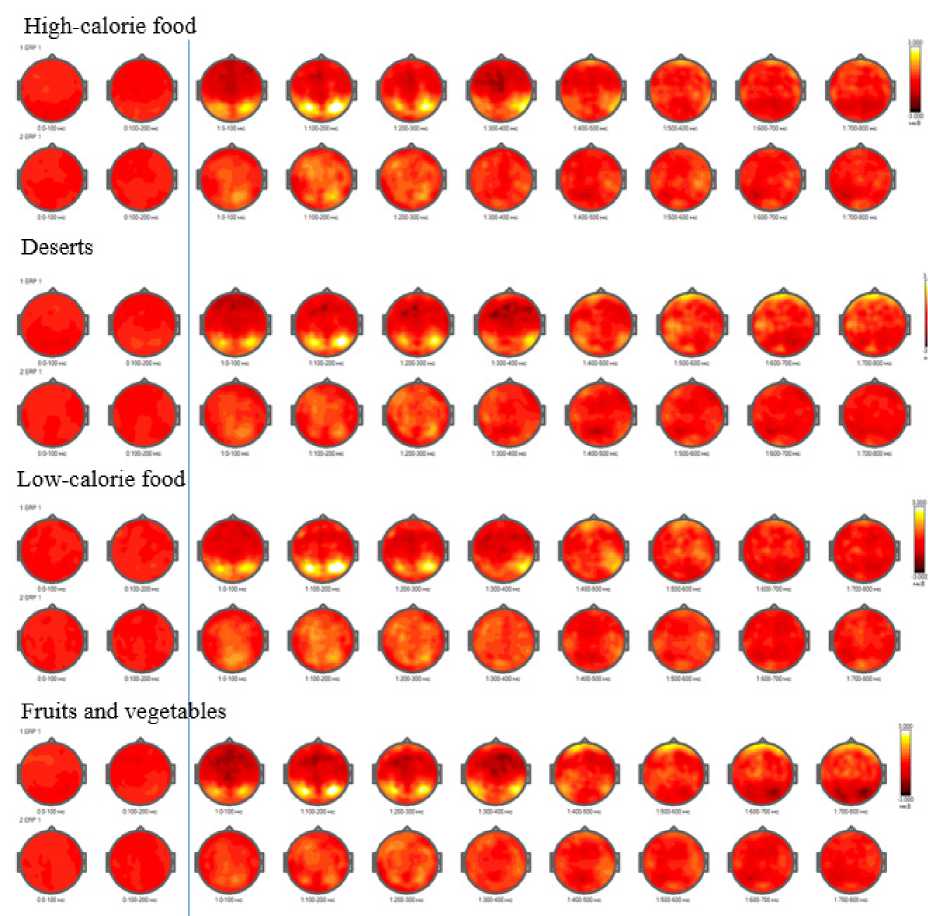
Figure 6 . Temporal Dynamics of Average Amplitude of Evoked Potentials (EP) in Food Preference Task 2 in Clusters Based on Psychological Eating Behavior Characteristics (Cluster 1 - Bottom Row, Cluster 2 - Top Row)
Statistically significant differences between clusters were identified during the task of making food choices incongruent with individual preferences for specific stimulus types. High-calorie food images elicited differences at 100–200 ms in the central-parietal and left temporal regions. The 200–300 ms interval showed differences in the frontal-central, left temporal, and temporo-parietal regions. Between 300 and 400 ms, significant activity appeared in the left frontal and central regions, while the 400–500 ms interval involved the left frontal-temporal region and a single right frontal-temporal channel. For dessert images, no differences were observed at 100–200 ms; however, significant activity emerged during the 200–300 ms interval in the central, left-lateralized frontal, and parietal regions, followed by activity in the frontal region at 300–400 ms and the left frontal-central and temporal regions at 400–500 ms. Low-calorie food images showed differences during the 100–200 ms interval in the central-parietal region. At 200–300 ms, significant activity was detected in the left-lateralized frontal, central, and temporal regions. By 300–400 ms, activity persisted in the frontal and central regions, with left lateralization, and at 400–500 ms, in the left frontal-temporal region. For fruits and vegetables, differences were first noted during the 100–200 ms interval in the central-parietal region. Subsequent differences were observed at 200–300 ms in the left-lateralized frontal, central, and temporal regions, followed by activity at 300–400 ms in the left-lateralized frontal and central regions, and at 400–500 ms in the left frontal-temporal region.
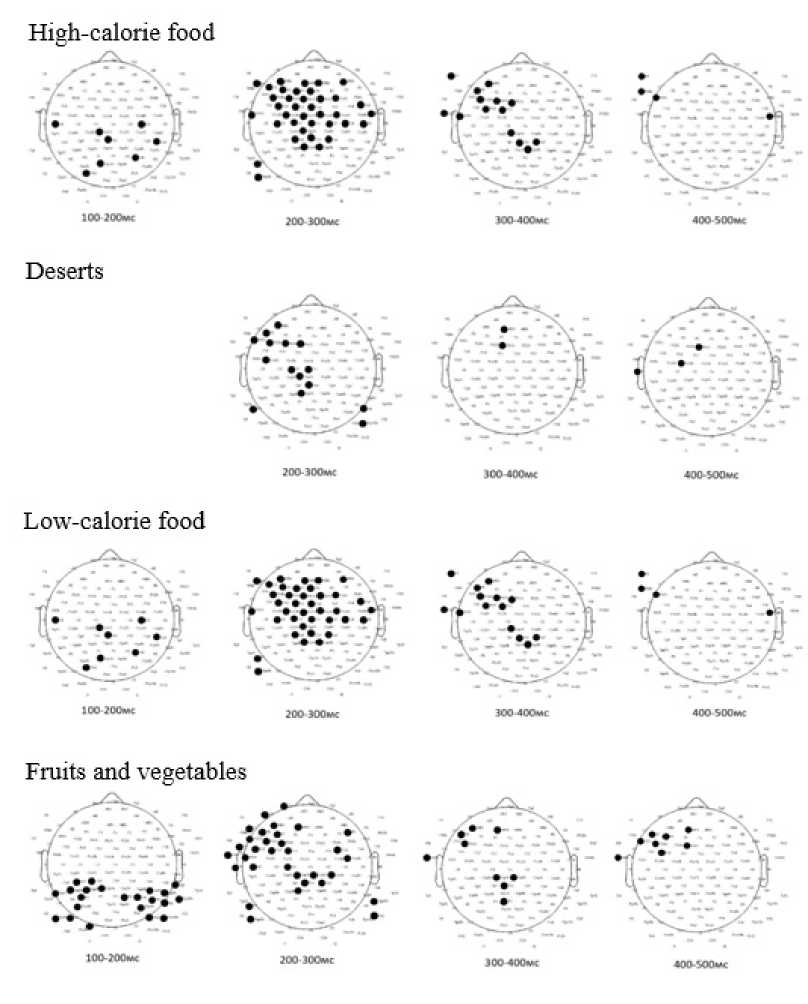
Figure 7. Analysis of differences in averaged EP amplitude values in Food Preference Task 2 in Clusters Based on Psychological Eating Behavior Characteristics (p<0,05)
Overall, significant differences between clusters identified by eating behavior traits were predominantly observed in the temporo-occipital regions across all stimulus types. For high-calorie food, Cluster 1 showed higher amplitudes during early processing stages (100–200 ms), while Cluster 2 exhibited greater amplitudes at later intervals (200–300 ms and 400–500 ms). For low-calorie food and fruits/vegetables, significant differences were primarily localized in the parietal-occipital regions, with Cluster 1 demonstrating consistently higher amplitudes in early intervals (100–300 ms). These findings suggest distinct neural processing patterns between clusters, reflecting differences in attentional or evaluative responses to food stimuli. These findings highlight the role of cognitive control and attentional modulation in decisions that deviate from habitual food preferences, reflecting their importance in regulating eating behavior.
Next, to test the hypothesis that brain activity characteristics in food preference choice tasks may differ depending on the level of awareness in nutrition and health, a comparative analysis was conducted between the group with above-average results (group 1) and the group with below-average results (group 2). Respondents with average results were excluded from the sample during the calculations.
Visual differences between the heatmaps of the groups with different levels of awareness in nutrition and health are minimal. However, an increase in the amplitude of event-related potentials (ERPs) was observed in the first group of participants, characterized by higher levels of awareness, in the occipital area between 100-400 ms during the first series, regardless of the type of stimulus (Figure 8).
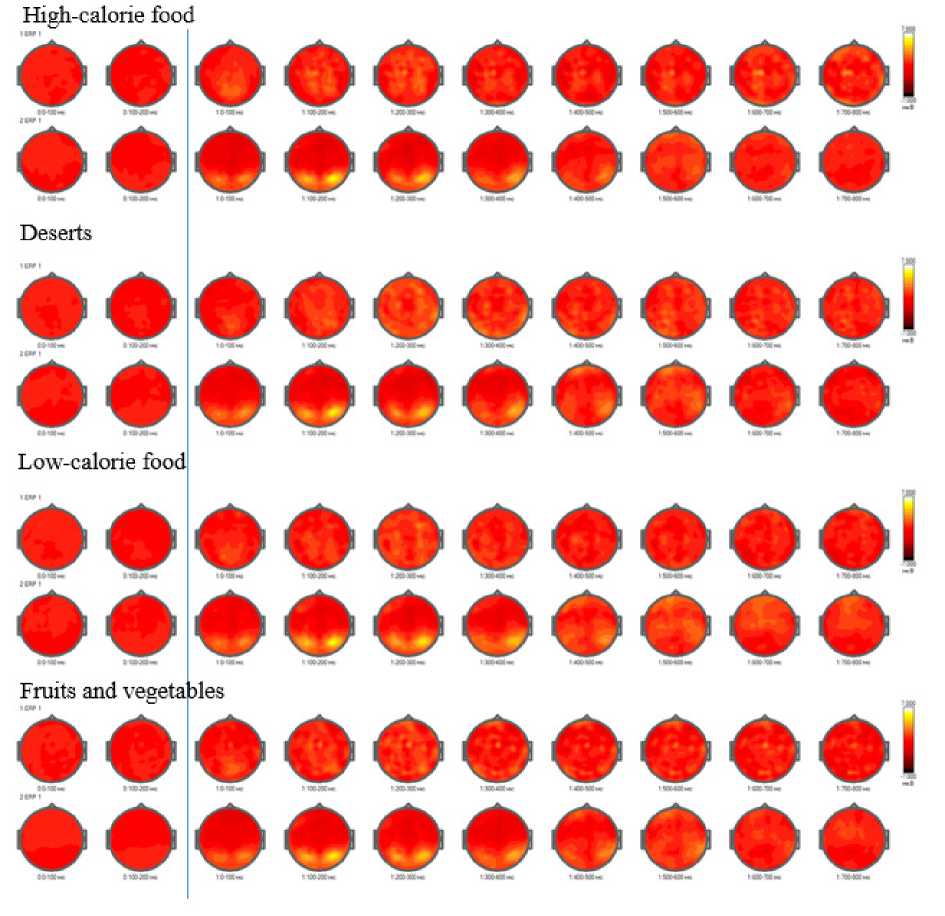
Figure 8. Temporal Dynamics of Average Amplitude of Evoked Potentials (EP) in Food Preference Task 1 in groups depending on the level of awareness in nutrition and health (results for group 1 in the lower row of images, for group 2 in the upper row).
Since the distribution in the selected groups for several indicators differed from normal (Shapiro-Wilk test), the analysis was conducted using both a parametric criterion (Student’s t-test) and a nonparametric criterion (Mann-Whitney U-test). Significant differences between the first and second groups in the congruent food choice task during the first series, when demonstrating images of high-calorie foods, were found in the 100-200 ms interval in the temporal areas, in the 200-300 ms interval in the left and right temporal areas, and in the 400-500 ms interval in the left central-temporal area. No statistically significant differences were found in the 300-400 ms interval (Figure 9).
Low-calorie food
Figure 9. Analysis of Differences in Average EP Amplitude in Food Preference Task 1 in groups depending on the level of awareness in nutrition and health (p < 0.05).
Statistically significant differences in averaged ERP amplitude values across participant groups depending on the level of awareness in nutrition and health were predominantly localized in the temporo-occipital regions. For dessert images at 100–200 ms, differences emerged in the parietal-occipital regions, in the 200–300 ms interval, significant activity was detected at a single electrode in the fronto-temporal and temporal regions, while at 400–500 ms, differences were observed in the left temporo-parietal, frontotemporal, and right frontal regions. For low-calorie dishes, significant differences appeared at 100–200 ms in the right temporo-parietal region. During the 200–300 ms interval, differences were noted at individual electrodes in the central, parietal, and left parieto-occipital regions. By 400–500 ms, significant differences were observed at individual electrodes in the temporal and fronto-central regions. When fruits and vegetables were presented, differences were observed at 100–200 ms at individual electrodes in the left parieto-occipital, fronto-temporal, and right parieto-occipital regions. At 200–300 ms, significant activity was seen in the left centro-temporal and right parieto-occipital regions. Finally, during the 400–500 ms interval, differences were observed at a single electrode in the right temporal region.
In the second task, the heatmaps also show an increase in the amplitude of the P300 in the occipital region during the 100-300 ms interval for the first group of participants (Figure 10).
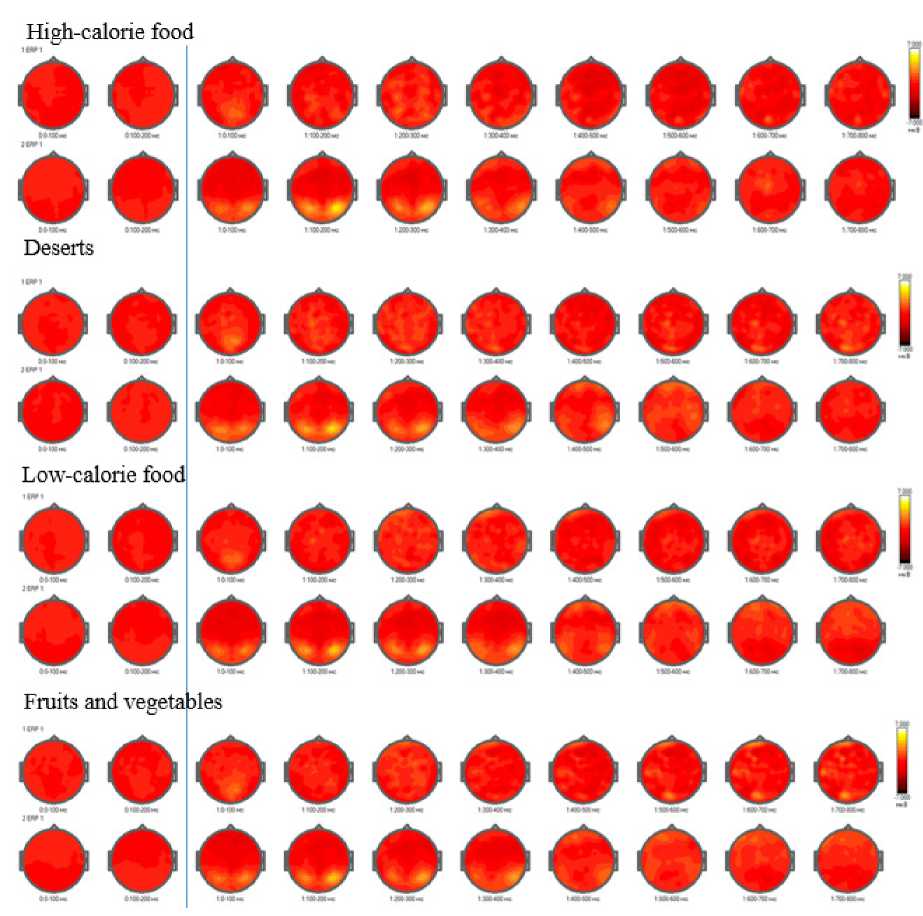
Figure 10. Temporal Dynamics of Average Amplitude of Evoked Potentials (EP) in Food Preference Task 2 in groups depending on the level of awareness in nutrition and health (results for group 1 in the lower row of images, for group 2 in the upper row).
Statistically significant differences in ERP amplitude between the first and second groups during the incongruent food choice task were predominantly observed in temporo-occipital regions (Figure 11).
Hieh-calone food
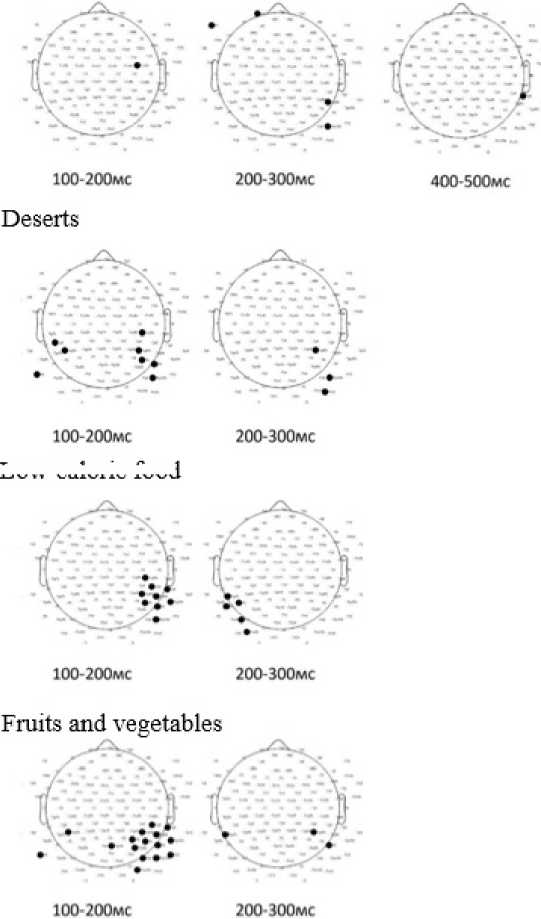
Low-calone food
Figure 11. Analysis of Differences in Average EP Amplitude in Food Preference Task 2 in groups depending on the level of awareness in nutrition and health (p<0.05).
For high-calorie food, significant differences were found at 100–200 ms in the fronto-central region (single electrode), at 200–300 ms in the left frontal and right temporo-occipital regions, and at 400–500 ms in the right temporo-parietal region, with no differences at 300–400 ms. For desserts, differences were detected at 100–200 ms in the left and right centro-parietal regions and at 200–300 ms in the right parietooccipital region, with no significant differences at 300–400 ms or 400–500 ms. For low-calorie food, differences appeared at 100–200 ms in the right temporo-central region (single electrode) and at 200–300 ms in the left parieto-occipital region, with no differences observed at later intervals. For fruits and vegetables, significant differences were observed at 100–200 ms in the left parietal, centro-parietal, temporo-parietal, and parieto-occipital regions, and at 200–300 ms at single electrodes in the left and right temporo-parietal regions, with no significant differences at 300–400 ms or 400–500 ms.
So, differences between groups with varying levels of nutritional and health awareness were primarily observed in temporo-occipital regions across both series. In the first series, higher amplitudes were noted in the more aware group during early stages of stimulus processing (100–400 ms), while the less aware group exhibited higher amplitudes at later stages (400–500 ms), regardless of stimulus type. In the second series, the less aware group showed higher amplitudes at 100–200 ms and 400–500 ms for high-calorie food, whereas the more aware group demonstrated higher amplitudes at 100–200 ms (excluding high-calorie food) and 200–300 ms, irrespective of stimulus type.
Discussion
The results of this study confirm the importance of psychophysiological mechanisms in the regulation of eating behavior and their relationship with psychological factors, as well as with the level of general awareness in nutrition and health. The obtained data, demonstrating differences in the characteristics of brain activity between the identified clusters and respondent groups, align with findings from previous research. For instance, the observed differences in the average P300 amplitude during the 200–300 ms interval between clusters support earlier evidence linking cognitive control, impulsivity, and food preferences. The observed activation in the fronto-central region during the 600–700 ms interval, particularly in response to non-food stimuli, highlights the role of cognitive control in suppressing impulsive reactions.
Additionally, the more pronounced activation of the temporal-occipital region in participants with a higher level of nutritional awareness aligns with the idea that greater awareness may facilitate heightened attentional processing of food-related stimuli. However, the relatively limited number of statistically significant differences associated with the level of awareness could reflect the small sample size or lend support to the hypothesis that psychological traits (such as impulsivity or cognitive control) outweigh knowledge levels in determining food preferences and potentially in shaping these preferences.
The findings for the second cluster, characterized by heightened sensitivity to external food stimuli, further support the hypothesis that excessive responses to food triggers may be associated with insufficient cognitive regulation. This aligns with prior evidence suggesting that individuals who exhibit strong external sensitivity may struggle with attentional control or emotion regulation in food-related contexts.
Several limitations should be noted. The small sample size may reduce the statistical power of the results, and the inclusion of individuals without diagnosed eating disorders limits the generalizability of these findings to clinical populations. While this approach provides valuable insights into eating behavior in the general population, its applicability to groups with clinical concerns remains unclear.
In conclusion, this study emphasizes the importance of a comprehensive approach to examining food preferences, integrating cognitive, emotional, and neurophysiological factors. Future research should aim to expand sample sizes, include clinical populations, and investigate the interplay between knowledge, psychological traits, and neurophysiological responses in greater detail.
Conclusion
The aim of this study was to investigate the characteristics of brain activity in food preference tasks, depending on psychological characteristics of eating behavior, as well as the level of general awareness in proper nutrition.
The identified differences between the clusters indicate that respondents with healthier eating behaviors demonstrate lower reactivity to external food stimuli, which is related to a higher level of cognitive control. In contrast, respondents with less healthy eating behaviors are characterized by increased sensitivity to external triggers, which supports the significance of psychophysiological mechanisms in regulating behavior.
Overall, the differences in brain activity between the first and second clusters, depending on the psychological characteristics of eating behavior, and between the identified groups of respondents, depending on their level of awareness in nutrition and health, in tasks involving congruent and incongruent food preference choices, are aligned with both the characteristics of the studied groups and the type of tasks performed.
The obtained results may be useful for creating prevention and treatment programs for eating behavior disorders, tailored to the individual characteristics of respondents, and open up opportunities for further study. In particular, it is important to investigate the nature of the relationship between cognitive control indicators and various aspects of eating behavior, and whether different forms of interventions aimed at developing executive functions can influence long-term changes in eating habits.
Acknowledgements
The study was carried out with the financial support of a grant for the implementation of research projects carried out under the supervision of young scientists of DSTU “Science-2030” (project “Psychological and psychophysiological mechanisms of eating behavior of young people in the context of the transition to a rational consumption model”, 2023-2024).
Conflict of interests
The authors declare no conflict of interest.
Author Contributions
