Execution of local budgets in 2014: tension is not decreasing
Автор: Povarova Anna Ivanovna
Журнал: Economic and Social Changes: Facts, Trends, Forecast @volnc-esc-en
Рубрика: Social finances
Статья в выпуске: 2 (38) т.8, 2015 года.
Бесплатный доступ
Vladimir Putin’s “May decrees” have received the status of a national goal. On the background of decreasing economic performance exacerbated by external shocks, the implementation of these decrees has become a heavy burden for regional budgets without an adequate financial support from the federal budget. As a result, almost every Russian region has suffered losses by the end of 2014. The fallacy of the ongoing course of budget policy has long been criticized by many leading scholars and experts; moreover, they proposed positive recommendations on the development of alternative policies. Unfortunately, the results of 2014 prove that the RF Government has not abandoned the policy of budget consolidation. On the contrary, gratuitous financial assistance to the regions is actively transformed into debt financing in the form of budget loans. However, the regional authorities can rely on this quasi-support, which is a temporary factor, only provided that the budget is deficit-free and at the expense of abandonment of spending on economic development and on the improvement of welfare of the population...
Region, territorial budget, deficit, loans, public debt, adjustment of budgetary policy
Короткий адрес: https://sciup.org/147223712
IDR: 147223712 | УДК: 336.14 | DOI: 10.15838/esc/2015.2.38.12
Текст научной статьи Execution of local budgets in 2014: tension is not decreasing
At first glance, the execution of subnational budgets in 2014 was successful: total and own revenues1 increased by 7–9%. However, the revenue-generating regions were the ones receiving oil rent and the federal cities2. In the majority of the RF subjects (61 of 83) the own revenue growth rate was lower than the national average.
Despite the accelerated dynamics, largely influenced by the low base effect, the growth rate of budget receipts was below the inflation rate3. In real terms of both aggregate and own revenue did not reach the 2008 level (tab. 1 ).
The main factors to reduce the revenue growth were as follows.
First, it is the drop in the growth rate of industrial production and investment caused by the general recession of the Russian economy4 (tab. 2) .
In 2014 the volume of industrial production increased by 1.7% against 5% in 2011.
All federal districts, except for the Far Eastern Federal district, have been demonstrating downward dynamics since 2012.
A number of regions have not overcome the 2008–2009 industrial downturn yet. Among them there are such major industrial centers, as Khanty-Mansi Autonomous Okrug, Yamalo-Nenets Autonomous Okrug, the Chelyabinsk Oblast, the Nizhny Novgorod Oblast, the Arkhangelsk oblast, the federal cities; it indicates long-term negative trends in the economy.
Investments in fixed capital have moved into the negative zone in 2013 and in 2014 the decline accelerated from 0.3 to 2.7%. The decrease in investment activity occurred in half of the RF subjects. Hence, the investment crisis remains.
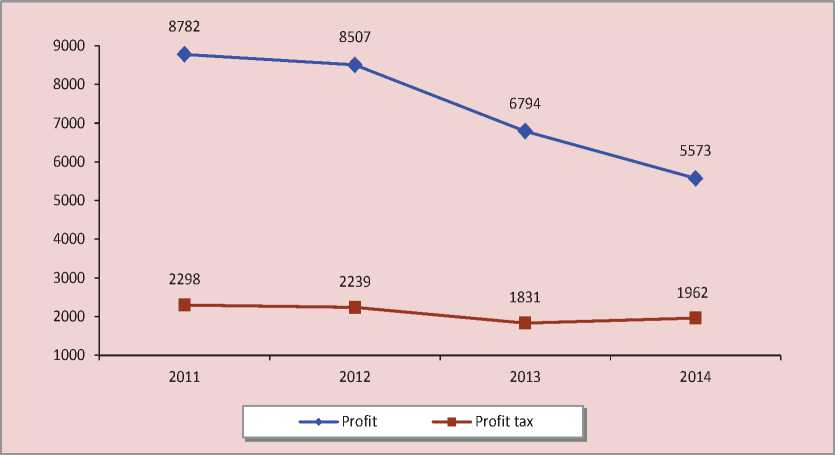
Second, it is a progressive decline in profit and, accordingly, corporate tax. In 2011–2014 the amount of economic entities’ revenues decreased by 33% and corporate tax – 15% (fig. 1) .
Table 1. Revenues of RF subjects’ budgets* in 2008–2014, billion rubles
|
Indicators |
2008 |
2009 |
2010 |
2011 |
2012 |
2013 |
2014 |
2014 to 2008, % |
|
Revenues, total |
6196 |
5924 |
6537 |
7644 |
8064 |
8165 |
8747 |
141.2 p.p. |
|
Growth rate, % |
128.0 |
95.6 |
110.3 |
116.9 |
105.5 |
101.2 |
107.1 |
-20.9 p.p. |
|
In real terms** |
9301 |
8104 |
8367 |
9112 |
9121 |
8695 |
8747 |
94.0 |
|
Growth rate, % |
118.6 |
87.1 |
103.2 |
108.9 |
100.1 |
95.3 |
100.6 |
-18 p.p. |
|
Own revenues |
4912 |
4243 |
4980 |
5827 |
6385 |
6588 |
7143 |
145.4 |
|
Growth rate, % |
120.3 |
86.4 |
117.4 |
117.0 |
109.6 |
103.2 |
108.4 |
-11.9 p.p. |
|
In real terms** |
7374 |
5805 |
6374 |
6946 |
7221 |
7016 |
7143 |
96.9 |
|
Growth rate, % |
111.4 |
78.7 |
109.8 |
109.0 |
104.0 |
97.2 |
101.7 |
-9.6 p.p. |
* To ensure the comparability of the dynamics all the indicators are net of the Crimean Federal district. ** The 2014 prices. Sources: data of the Federal Treasury; the Federal State Statistics Service of the Russian Federation; the author’s calculations.
Table 2. Index of industrial production and volume of investment in fixed assets in 2011–2014, % to the previous year
|
Federal district |
Industrial production |
Investment in fixed assets |
||||||
|
2011 |
2012 |
2013 |
2014 |
2011 |
2012 |
2013 |
2014 |
|
|
North Caucasian |
109.8 |
106.3 |
106.2 |
98.9 |
103.3 |
112.2 |
102.9 |
109.1 |
|
Ural |
101.9 |
101.6 |
101.1 |
100.1 |
114.2 |
106.4 |
98.2 |
101.3 |
|
Central |
106.9 |
105.7 |
101.4 |
101.3 |
107.2 |
112.9 |
105.0 |
98.9 |
|
Volga |
109.4 |
104.5 |
101.8 |
102.0 |
110.1 |
109.5 |
104.6 |
98.9 |
|
Siberian |
106.4 |
107.2 |
104.7 |
101.8 |
116.2 |
111.8 |
90.5 |
96.0 |
|
Far Eastern |
109.1 |
103.0 |
103.3 |
105.3 |
126.5 |
88.1 |
80.5 |
94.8 |
|
Northwestern |
107.7 |
102.6 |
99.8 |
97.6 |
110.0 |
104.0 |
77.1 |
92.4 |
|
Southern |
109.5 |
107.8 |
104.4 |
102.7 |
110.3 |
107.4 |
108.7 |
83.2 |
|
Russian Federation |
105.0 |
103.4 |
100.4 |
101.7 |
110.8 |
106.6 |
99.7 |
97.3 |
Source: data of the Federal State Statistics Service of the Russian Federation.
Figure 1. Dynamics of receipts and profit tax in RF in 2010–2014, billion rubles (the 2014 prices)
Sources: data of the Federal Treasury; the Federal State Statistics Service of the Russian Federation; the author’s calculations.
In 37 RF subjects, mainly economically developed, profit tax has not reached the 201 1 volumes, even without adjustments for inflation. It confirms the existence of problems in the regional economy once again (tab. 3) . The most negative trends have developed in the regions with large metallurgical enterprises (the Belgorod Oblast, the Kemerovo Oblast, the Volgograd Oblast, the Murmansk Oblast, Krasnoyarsk Krai). In 2014 there are only 8 subjects with the predominant share of profit tax in the structure of own revenues (in 2008 there were 18 subjects).
The total increase in profit tax paid to territorial budgets in 2014 amounted to 242 billion rubles, more than 70% of this amount was provided by 6 regions (the Sakhalin Oblast, the Tyumen Oblast, the Leningrad
Oblast, the Sakha (Yakutia) Republic, Khanty-Mansi Autonomous Okrug and Yamalo-Nenets Autonomous Okrug).
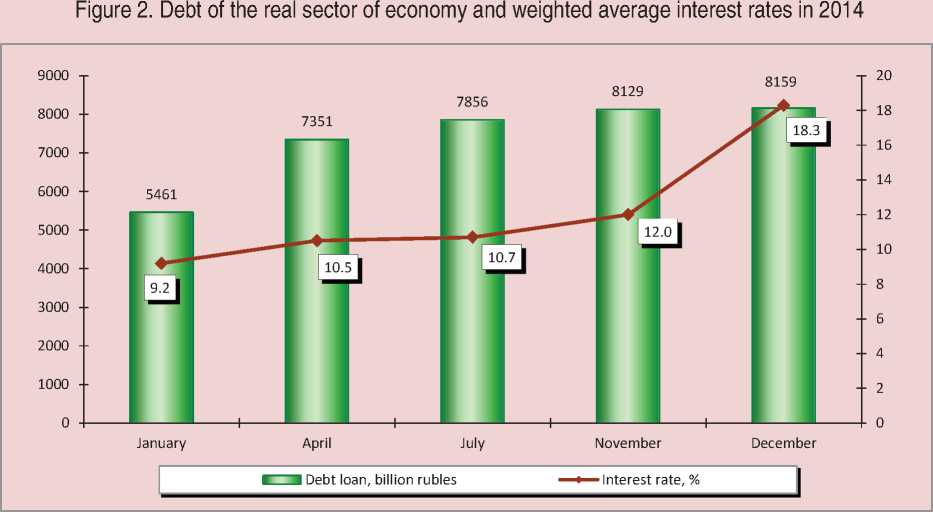
The difficult financial situation of enterprises and organizations was exacerbated by the tight credit policy. In 2014 with the 8.7% average return of the RF economy the weighted average interest rates on commercial loans doubled – from 9.2 to 18.3%, and the debt of the real sector of economy increased by half and reached more than 8 trillion rubles (fig. 2) . It is comparable to the annual volume of subnational budgets revenues.
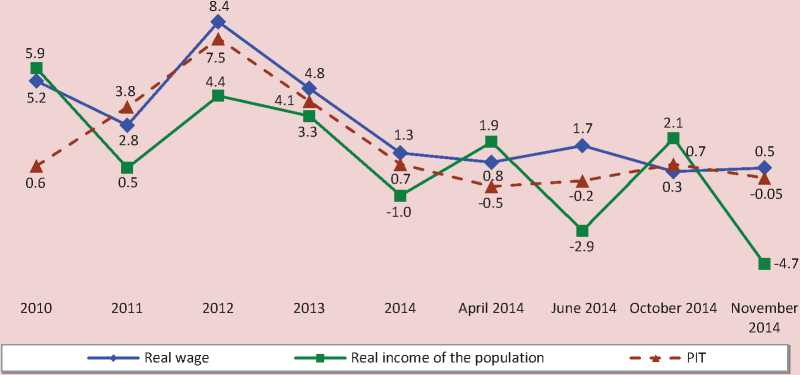
Third, it is a slowdown in the real growth rate of personal income tax (PIT) to 0.7% against 4.1% in 2013 (fig. 3) due to the sharp fall of real incomes and wages caused by the decline in oil prices, the devaluation of
Table 3. Profit tax receipt to the RF subjects’ budgets in 2011–2014, billion rubles
|
Subject |
2011 |
2012 |
2013 |
2014 |
2014, % |
|
|
to 2013 |
to 2011 |
|||||
|
Irkutsk Oblast |
30.06 |
39.96 |
29.13 |
29.72 |
102.0 |
98.9 |
|
Samara Oblast |
36.17 |
45.32 |
39.45 |
35.57 |
90.2 |
98.3 |
|
Nizhny Novgorod Oblast |
25.51 |
24.15 |
24.18 |
24.21 |
100.1 |
94.9 |
|
Tyumen Oblast |
108.62 |
105.95 |
65.96 |
102.4 |
155.3 |
94.3 |
|
Sverdlovsk Oblast |
47.25 |
55.57 |
46.36 |
43.74 |
94.4 |
92.6 |
|
Moscow |
566.95 |
545.85 |
485.72 |
485.43 |
99.9 |
85.6 |
|
Perm Krai |
33.99 |
35.48 |
33.06 |
28.52 |
86.3 |
83.9 |
|
Yamalo-Nenets Autonomous Okrug |
47.08 |
46.29 |
27.28 |
37.81 |
138.6 |
80.3 |
|
Khabarovsk Krai |
12.75 |
15.36 |
11.37 |
9.77 |
85.9 |
76.6 |
|
Krasnoyarsk Krai |
68.98 |
52.54 |
42.59 |
49.7 |
116.7 |
72.1 |
|
Murmansk Oblast |
16.3 |
10.96 |
11.17 |
11.63 |
104.2 |
71.4 |
|
Vologda Oblast |
12.01 |
10.93 |
5.96 |
7.58 |
127.3 |
63.1 |
|
Kemerovo Oblast |
35.94 |
24.57 |
15.14 |
19.21 |
126.9 |
53.4 |
|
Belgorod Oblast |
25.6 |
19.2 |
13.58 |
11.22 |
82.6 |
43.8 |
|
Russian Federation |
1927.94 |
1979.89 |
1719.67 |
1961.67 |
114.1 |
101.7 |
Sources: data of the Federal Treasury; the author’s calculations.
Source: data of the Bank of Russia [6].
Figure 3. Dynamics of real wages, real incomes of the population and receipts of personal income tax* in 2010–2014, % to the previous year
-2
-4
-6
* The 2014 prices.
Sources: data of the Federal Treasury; the Federal State Statistics Service of the Russian Federation; the author’s calculations.
the ruble and the external sanctions in the second half of 2014.
The majority (60%) of territorial budgets have showed negative dynamics in personal income tax. This means that not only profit tax, but also income tax have lost the role of a stable source of gain for the regional treasury.
The optimization of a network of social complex establishments plays an important role in the reduction of personal income tax revenues. The regional authorities often rely on it to raise salaries of public sector workers, solving the task set in the RF President decrees of 7 May 2012.
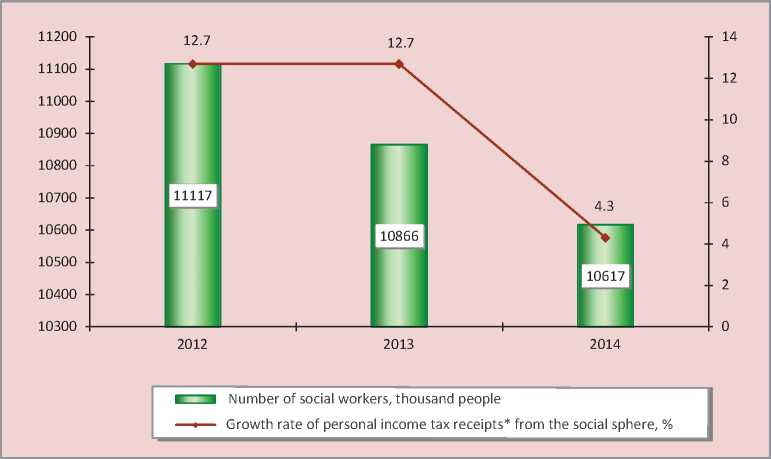
Over the past three years the number of employees in institutions of education, healthcare and culture has decreased by 500 thousand people, while the growth rate of personal income tax revenues from these industries has decreased from 12.7% to 4.3% (fig. 4).
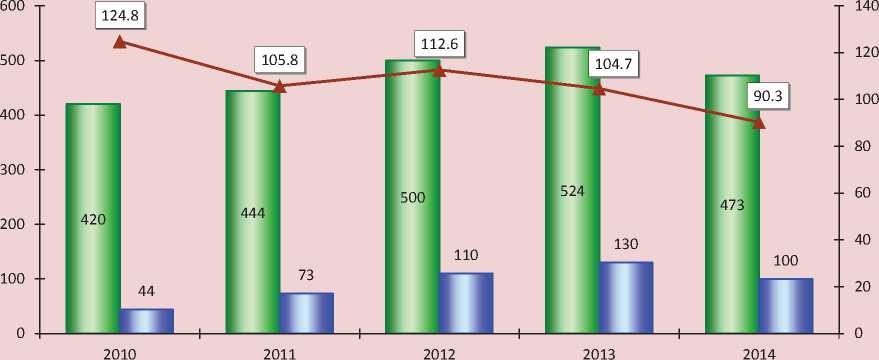
Fourth, it is a 10% decrease in the excise tax rate compared to 2013 (fig. 5) due to lower excise duties on diesel fuel.
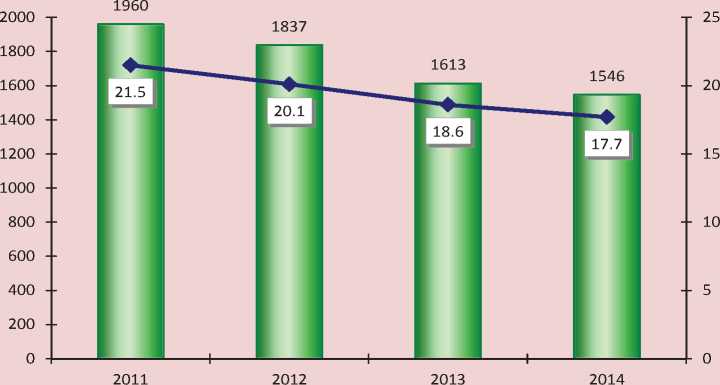
Fifth, it is gradual reduction of subsidies and subventions from the federal budget. Hence, the amount of interbudgetary transfers in real terms has decreased by 414 billion rubles or by 21% compared to 2011, while the share of subnational budgets revenues generated from non-reimbursable financial assistance has declined from 21.5 to 17.7% (fig. 6) .
Figure 4. Number of social workers and growth rate of personal income tax revenue in 2012–2014
* The 2014 prices.
Sources: data of Federal Tax Service; the Federal State Statistics Service of the Russian Federation; the author’s calculations.
Figure 5. Excise tax receipts to the RF subjects’ budgets in 2010–2014, billion rubles (the 2014 prices)
I I Total ■ ■ Excise tax on diesel fuel —*—Growth rate, %
Sources: data of the Federal Treasury; the Federal State Statistics Service of the Russian Federation; the author’s calculations.
Figure 6. Dynamics of interbudgetary transfers to the RF subjects’ budgets from the federal budget in 2011–2014* (the 2014 prices)
I I Billion rubles « Share in the budget revenue, %
* Due to the changes in the budget functional classification the data prior to 2011 are not shown.
Sources: data of the Federal Treasury; the Federal State Statistics Service of the Russian Federation; the author’s calculations.
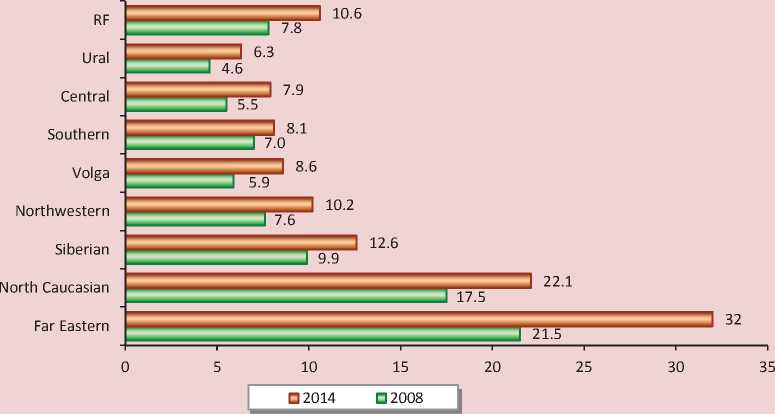
There have recently been no changes in the transfer policy of the federal center, focused on the provision maximum support to the Far Eastern Federal district, depressive republics of the North Caucasian Federal district and the Siberian Federal district. The amount of interbudgetary transfers of territories has differed fivefold (fig. 7) .
The alignment policy, as part of interbudgetary policy, has led to the marked reduction of regional polarization. In 2014 only 18 regions were self-sufficient and 63 regions had the level of budget revenue below the average even after the distribution of subsidies (fig. 8) .
Moreover, in 2011–2014 the subjects’ dependence on transfers was higher than the national average (tab. 4). Let us note that the share of transfers to the budgets of the Central Federal district regions, equal to 10.5%, can be considered relative, as, except for the Moscow agglomeration, the revenue sources of other subjects of this district were ensured by federal funds by 25% as average.
It is worth mentioning that there is a decrease in the financial assistance in the form of subsidies for the implementation of federal target programs and co-financing of capital investment (fig. 9) .
In 2008–2014 the volume of the above subsidies decreased by 93 billion rubles, or 42%, which in turn led to the reduction in capital expenditure of territorial budgets by 360 billion rubles, or 26%. Of course, this reduction of budget investment will create long-term risks to sustainable growth of taxable capacity. Half of the transfers were
Figure 7. Intergovernmental transfers to the Russian Federal districts in 2008 and 2014, thousand rubles per capita
Sources: data of the Federal Treasury; the author’s calculations.
Figure 8. Number of the RF subjects with the level of budget revenue below the average
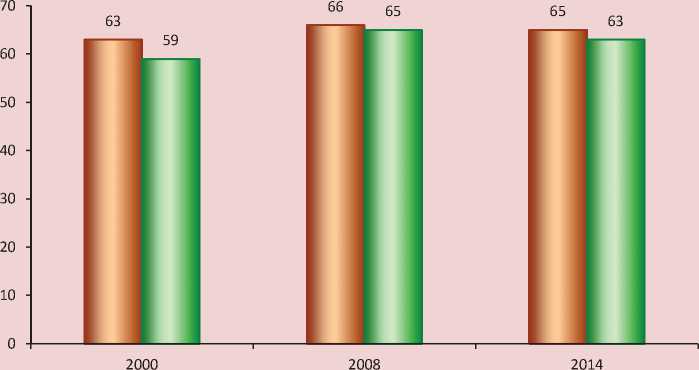
□ Before alignment □ After alignment
Source: the author’s calculations on the basis of data of the Federal Treasury and the Federal State Statistics Service of the Russian Federation.
Table 4. Interbudgetary transfers to territorial budgets from the federal budget in 2011–2014, by federal districts
|
Federal district |
2011 |
2012 |
2013 |
2014 |
||||
|
Billion rubles |
%* |
Billion rubles |
%* |
Billion rubles |
%* |
Billion rubles |
%* |
|
|
North Caucasian |
203 |
65.4 |
212 |
63.9 |
204 |
60.8 |
213 |
60.8 |
|
Far Eastern |
195 |
37.3 |
181 |
32.0 |
233 |
36.0 |
199 |
28.2 |
|
Siberian |
224 |
25.2 |
213 |
23.3 |
216 |
23.4 |
242 |
24.7 |
|
Southern |
145 |
29.9 |
146 |
26.8 |
105 |
20.1 |
113 |
20.2 |
|
Volga |
285 |
25.3 |
264 |
21.8 |
241 |
19.4 |
256 |
19.5 |
|
Northwestern |
149 |
17.1 |
145 |
16.7 |
135 |
14.9 |
141 |
14.3 |
|
Central |
335 |
13.0 |
370 |
13.5 |
305 |
11.1 |
306 |
10.5 |
|
Ural |
107 |
12.4 |
92 |
10.3 |
76 |
9.1 |
77 |
8.0 |
|
Russian Federation |
1644 |
21.5 |
1624 |
20.1 |
1515 |
18.6 |
1546 |
17.7 |
Figure 9. Subsidies for co-financing of federal target programs and capital investment, received by the RF subjects budgets from the federal budget in 2008–2014, billion rubles
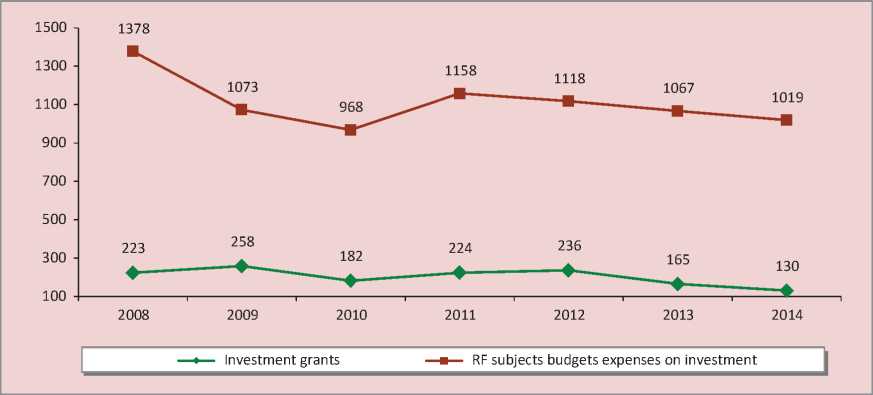
Source: data of the Federal Treasury.
received by 7 regions5, which once again emphasizes the opacity of interbudgetary interaction.
Optimization was one of the directions of the budgetary policy pursued by the regional authorities in 2013–2014. It involved the reduction in the expenditure growth rate by 0.6% in 2013 and 1.7% in 2014 (tab. 5) .
It should be noted that in 2008–2014 the share of the territorial budgets’ costs, set aside for the satisfaction of vital needs of the vast majority of people in the country6 decreased from 45% to 38% in the consolidated budget of the Russian
Federation. During the same period, the growth of federal spending was twice higher than that of regional budgets (tab. 6) . It is obvious that the role of the RF subjects in the economy is becoming less important.
Our analysis of the dynamics and the structure of the territorial budgets’ expenditure has revealed the following key trends:
1. Slower rate growth of the total expenditure on social services due to declined budgetary provision of education and healthcare. In 2014 the growth rate of educational activity financing time showed a negative trend for the first time. The decrease in healthcare costs for the second consecutive year is caused by the transfer of part of their funding to the territorial funds of obligatory medical insurance7.
Table 5. Dynamics and structure of RF subjects’ budgets expenses in 2012–2014 (the 2014 prices)
|
Expenses |
2012 |
2013 |
2014 |
||||||
|
Billion rubles |
Share, % |
To 2011, % |
Billion rubles |
Share, % |
To 2012, % |
Billion rubles |
Share, % |
To 2013, % |
|
|
Expenses, total |
9436 |
100.0 |
103.1 |
9379 |
100.0 |
99.4 |
9216 |
100.0 |
98.3 |
|
National issues |
577 |
6.1 |
103.3 |
582 |
6.2 |
106.5 |
578 |
6.3 |
99.3 |
|
National economy |
1816 |
19.2 |
115.7 |
1843 |
19.6 |
101.5 |
1759 |
19.1 |
95.4 |
|
Housing and public utilities |
997 |
10.6 |
86.3 |
960 |
10.2 |
96.4 |
901 |
9.6 |
93.9 |
|
Social services, total |
5760 |
61.0 |
107.6 |
5704 |
60.8 |
99.0 |
5673 |
61.7 |
99.5 |
|
education |
2315 |
24.5 |
112.4 |
2485 |
26.5 |
107.3 |
2452 |
26.6 |
98.7 |
|
culture |
291 |
3.1 |
103.9 |
307 |
3.3 |
105.5 |
319 |
3.5 |
103.8 |
|
healthcare |
1536 |
16.3 |
108.0 |
1332 |
14.2 |
86.7 |
1297 |
14.1 |
97.3 |
|
social policy |
1441 |
15.3 |
101.4 |
1398 |
14.9 |
97.0 |
1415 |
15.4 |
101.2 |
|
Servicing of state and municipal debt |
84 |
0.9 |
93.4 |
97 |
1.0 |
115.1 |
122 |
1.3 |
125.3 |
Sources: data of the Federal Treasury; the Federal State Statistics Service of the Russian Federation; the author’s calculations.
Table 6. Share of RF subjects budgets’ expenses in the RF consolidated budget, expenditure growth rates by budget system levels in 2008–2014, %
|
Indicators |
2008 |
2009 |
2010 |
2011 |
2012 |
2013 |
2014 |
2014 to 2008, % |
|
Share of RF subjects budgets’ expenses in the RF consolidated budget |
45.2 |
39.3 |
39.6 |
41.3 |
39.3 |
39.8 |
38.3 |
-6.9 p.p. |
|
Federal budget’s spending |
126.5 |
127.6 |
104.7 |
108.0 |
118.0 |
103.5 |
111.1 |
195.8 |
|
Expenses of RF subjects’ budgets |
130.5 |
100.0 |
106.1 |
115.7 |
108.6 |
105.6 |
104.6 |
147.3 |
|
Source: the author’s calculations on the basis of data of the Federal Treasury. |
||||||||
Table 7. Expenses of the RF subjects’ budgets on the national economy and the housing and utilities sector in 2011 and 2014
|
Subject |
Expenses |
Reference: public debt |
||||||
|
2011 |
2014 |
2011 |
2014 |
|||||
|
Billion rubles |
Share, % |
Billion rubles |
Share, % |
Billion rubles |
%* |
Billion rubles |
%* |
|
|
Russian Federation |
2285.1 |
29.8 |
2659.3 |
28.9 |
1387.3 |
23.8 |
2402.3 |
33.5 |
|
Chukotka Autonomous Okrug |
8.5 |
44.9 |
10.4 |
46.5 |
2.3 |
18.9 |
13.5 |
125.1 |
|
Yamalo-Nenets Autonomous Okrug |
61.1 |
42.0 |
65.9 |
41.3 |
3.4 |
2.9 |
36.1 |
26.9 |
|
Kaliningrad Oblast |
20.5 |
42.1 |
24.7 |
40.0 |
21.6 |
73.0 |
28.2 |
69.5 |
|
Kamchatka Krai |
18.9 |
35.2 |
22.6 |
35.6 |
6.8 |
37.9 |
7.8 |
33.9 |
|
Belgorod Oblast |
36.9 |
44.1 |
27.1 |
34.2 |
21.4 |
35.5 |
45.3 |
82.9 |
|
Pskov Oblast |
7.0 |
24.7 |
10.1 |
31.3 |
5.3 |
34.5 |
12.9 |
72.4 |
|
Kaluga Oblast |
14.1 |
29.5 |
17.9 |
30.8 |
17.4 |
50.7 |
29.0 |
65.5 |
|
Tambov Oblast |
11.7 |
30.5 |
15.9 |
31.9 |
7.4 |
36.6 |
12.6 |
50.8 |
|
Republic of Mordovia |
13.8 |
33.2 |
13.9 |
30.6 |
21.0 |
133.8 |
30.4 |
108.8 |
|
Amur Oblast |
15.2 |
27.9 |
19.6 |
30.0 |
12.5 |
40.3 |
30.0 |
81.4 |
|
Vologda Oblast |
12.6 |
21.6 |
13.0 |
21.4 |
26.9 |
67.0 |
38.0 |
82.0 |
* Share of public debt in the volume of own budget revenues.
Sources: data of the Federal Treasury; the Ministry of Finance; the author’s calculations.
Figure 10. Rate of the growth of own revenues and expenses of the RF subjects’ budgets in 2008-2014, % to 2007
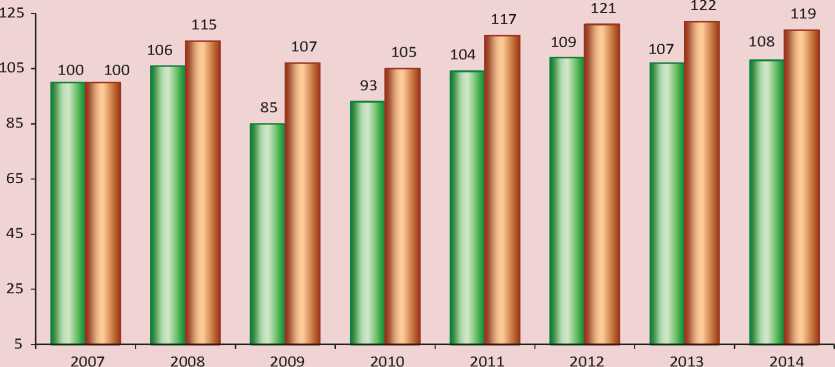
□ Own revenues □ Expenses
Sources: data of the Federal Treasury; the Federal State Statistics Service of the Russian Federation; the author’s calculations.
Table 8. Budget deficit in the RF subjects in 2008–2014, billion rubles
|
Indicators |
2008 |
2009 |
2010 |
2011 |
2012 |
2013 |
2014, plan |
2014, fact |
|
Balance deficit |
-55 |
-329 |
-100 |
-35 |
-279 |
-642 |
-222 |
-469 |
|
In % to own revenues of the budget |
1.1 |
7.8 |
2.0 |
0.6 |
4.4 |
9.7 |
2.5 |
6.6 |
|
Net deficit |
-135 |
-379 |
-202 |
-203 |
-355 |
-669 |
х |
-524 |
|
In % to own revenues of the budget |
2.8 |
10.5 |
7.7 |
6.5 |
6.4 |
11.6 |
х |
7.3 |
|
Number of the RF subjects that have budget deficit |
45 |
60 |
62 |
57 |
67 |
77 |
х |
74 |
|
Sources: data of the Federal Treasury; the author’s calculations. |
||||||||
A slight increase in spending on social policy and culture is associated with the later rise of the remuneration than in education and healthcare, in accordance with the Presidential decrees and the indexation of social support of the population.
-
2. Reduced assistance to the national economy sectors, which growth rate moved to the negative zone and amounted to 95.4%, while in 2012 they grew by 15.7%.
-
3. Steady downward trend in the expenditure on the housing and utilities sector. It
-
4. Dynamic growth of unproductive budget expenditure – interest payments on government debt servicing – 45%.
is minimization of the costs on this industry along with massive reduction of budget investment that was used by the regional authorities as a source to repay the deficit of budgetary resources required for the presidential decrees implementation. Over the past three years the housing and utilities sector financing has decreased by almost 100 billion rubles, or 10%.
The slowdown in growth of social spending has contributed to the decrease in the level of territorial budgets socialization. Although since 2011 the share of expenditure on the social sector has increased slightly (from 58.5% to 62%) due to the optimization of the network of budgetary institutions, but in 60 regions of the Russian Federation it has been above average.
However, in the conditions of acute debt problems the authorities of 17 regions have decided to allocate more than 30% of the budgetary resources to support the national economy and housing and utilities sectors. These regions mainly have medium-sized budgets. So, for example, the Republic of Mordovia has used 30.6% of the budget
expenditure for this purpose. The Vologda Oblast has spent 21.4% of the costs. The Vologda Oblast budget exceeds the Republic of Mordovia budget by a third, and the debt load amounts to 82% in relation to its own budget revenues, while in the Republic of Mordovia – 108.8%. This can also include the Pskov Oblast and the Amur Oblast, which budgets are smaller than the budget of the Vologda Oblast, but the debt load is high (tab. 7) .
The social model of regional budgets has led to the significant growth of costs, which are not supported by their own revenue sources. Compared to the pre-crisis level own incomes in real terms increased by 8% and expenditures by 19% in 2014 (fig. 10) .
As a result of faster growth of expenditure commitments 74 subject of the Russian Federation are characterized by the budget deficit, which reached 469 billion rubles in 2014, more than doubling the planned amount. Excluding 9 regions, which have positive budget balance, net deficit amounted to 524 billion rubles (tab. 8).
The regional budgets imbalance will further increase without financial assistance from the federal budget. So, in 2014 to finance the current spending8 the regions lacked 845 billion rubles, or 12% of own revenue sources (fig. 11) .
Figure 11. Deficit (-), surplus (+) of the current funding of RF subjects’ budgets in 2008–2014
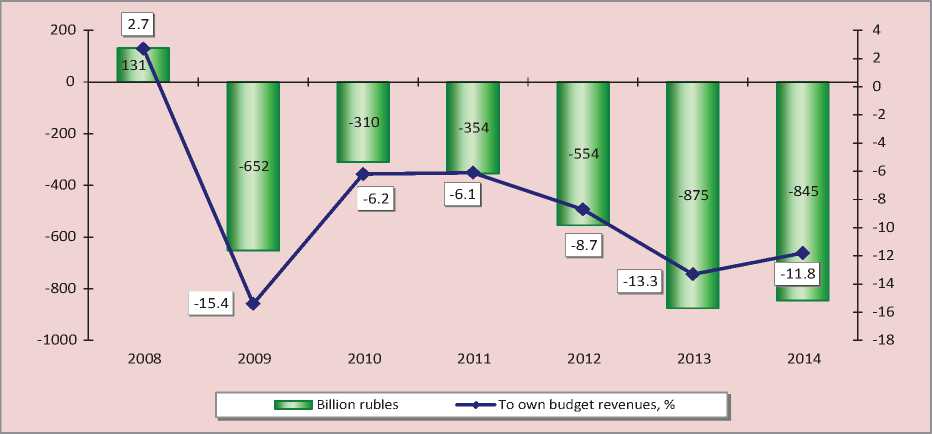
Source: calculated by the author according to the Federal Treasury.
According to our calculations, in 2014 only four subjects of the Russian Federation (the Sakhalin Oblast, the Leningrad Oblast, the Tyumen Oblast and Khanty-Mansi Autonomous Okrug) were able to fund the expenditure, not including subventions for the execution of powers of the center, at the expense of own revenues. This list does not include rich federal cities and Yamalo-Nenets Autonomous Okrug.
The significant level of current funding deficit, observed since 2009, shows that the regions have less resources to promote economic growth and even provide basic needs. Thereby, the fundamental principle of the RF budgetary system (the principle of balance) is violated. This is proved by the valid mechanism to separate expenditure powers, stipulating that the budget legislation is constantly amended to transfer the fulfilment of government commitments to the regional level without adequate financial support.
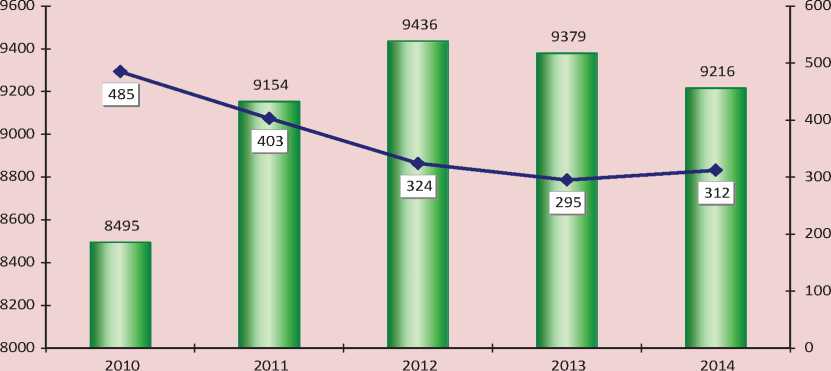
In 2010–2014 due to the governmental decisions (the implementation of the RF President decrees of 7 May 2012, the formation of regional road funds, the transfer of certain functions in the sphere of forestry, etc.) the expenses of local budgets increased by 8.5% and the subventions allocated from the federal budget for the execution of powers of the Russian Federation decreased by 36% (fig. 12).
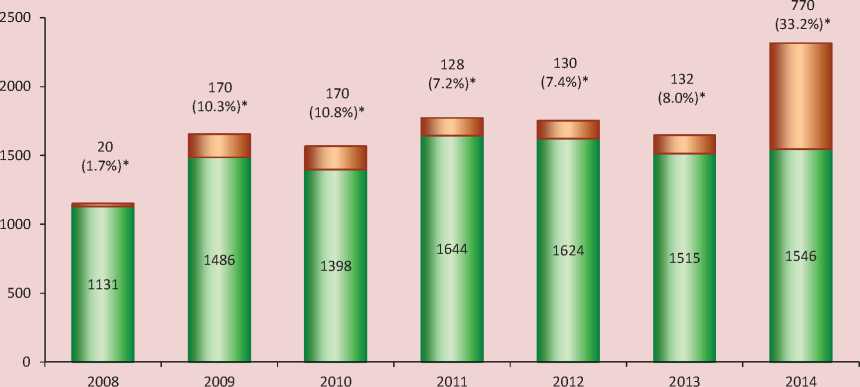
The rapid growth of loans disbursed to the regions from the federal budget was observed in 2014. Compared to 2013, with the 2% increase in interbudgetary transfers the volume of loans increased by six times, while their share in the financial aid structure increased from 8 to 33% (fig. 13) .
Figure 12. Dynamics of the expenses of RF subjects’ budgets and the subventions received from the federal budget in 2010–2014, billion rubles (the 2014 prices)
I I Costs —•—Subventions
Sources: data of the Federal Treasury; the Federal State Statistics Service of the Russian Federation; the author’s calculations.
Figure 13. Structure of the financial assistance received by RF subjects
□ Interbudgetary transfers □ Budget loans
* The parentheses specifies the share of loans in the amount of financial aid. Sources: data of the Federal Treasury; the author’s calculations.
Table 9. Loans obtained by the RF subjects in 2013-2014, billion rubles
|
Subject |
2013 |
2014 |
|||||||
|
Bank |
Budgetary |
Total |
To budget’s revenues*, % |
Bank |
Budgetary |
Total |
To 2013, times |
To budget’s revenues*, % |
|
|
Omsk Oblast |
68.6 |
0.9 |
69.5 |
87.4 |
43.2 |
130.6 |
1.9 |
203.7 |
|
|
Republic Of Mordovia |
8.3 |
2.9 |
11.2 |
54.9 |
35.9 |
20.1 |
56.0 |
5.0 |
200.1 |
|
Ivanovo Oblast |
8.8 |
0 |
8.8 |
39.1 |
22.3 |
15.2 |
37.5 |
4.3 |
164.2 |
|
Oblast |
28.8 |
2.1 |
30.9 |
56.3 |
53.6 |
39.9 |
93.5 |
3.0 |
160.6 |
|
Kabardino-Balkar Republic |
2.5 |
0.7 |
3.2 |
27.2 |
11.2 |
9.5 |
20.7 |
6.5 |
159.9 |
|
Nizhny Novgorod Oblast |
61.0 |
4.3 |
65.3 |
54.9 |
114.0 |
55.6 |
169.6 |
2.6 |
136.7 |
|
Kirov Oblast |
15.2 |
1.1 |
16.3 |
47.6 |
19.4 |
17.0 |
36.4 |
2.2 |
101.6 |
|
Tomsk Oblast |
14.4 |
0.1 |
14.5 |
33.6 |
33.3 |
19.1 |
52.4 |
3.6 |
110.8 |
|
Republic of Karelia |
8.8 |
1.9 |
10.7 |
48.3 |
12.5 |
12.0 |
24.5 |
2.3 |
109.2 |
|
Tambov Oblast |
8.0 |
0.8 |
8.8 |
37.9 |
7.5 |
17.8 |
25.3 |
2.9 |
101.8 |
|
Tver Oblast |
21.5 |
0 |
21.5 |
46.0 |
25.0 |
23.5 |
48.5 |
2.3 |
100.4 |
|
Russian Federation |
906.0 |
132.3 |
1038.3 |
22.3 |
1225.3 |
769.4 |
1994.7 |
1.9 |
30.3 |
* To own revenues.
Sources: data of the Federal Treasury; the author’s calculations.
The large-scale loans from the federal budget are a key factor in the growth of the total debt load of territorial budgets. The growth rates vary from 107% in the Kemerovo Oblast to 356% in Primorsky Krai. In 11 regions the bank and budgetary loans exceed the volume of own revenues (tab. 9) , and in 9 regions the loans reach 72–97% of this volume.
In 2014 only 3 RF subjects (Saint Petersburg, Nenets Autonomous Okrug and the Tyumen Oblast) did not attract credit resources to finance the budget deficit.
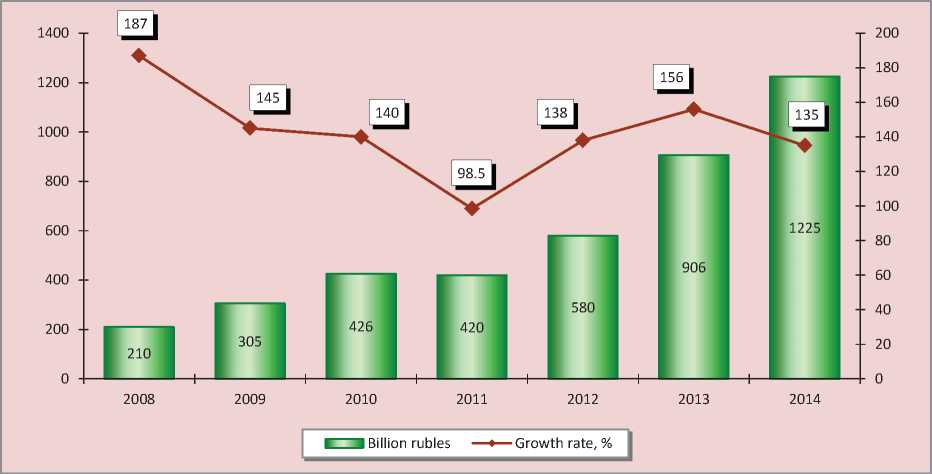
Last year the authorities managed to reduce the growth rate of most burdensome commercial loans, but for the first time their nominal volume exceeded one trillion rubles (fig. 14) .
It is noteworthy that bank loans grow faster in strong regions. For example, in the Sverdlovsk Oblast, the Irkutsk Oblast, the Tomsk Oblast and Khanty-Mansi Autonomous Okrug the attraction of commercial loans has increased by 3–7 times. Thus, there are clear risks of the aggravation of debt problems among the donors of the RF budgetary system9 in the near future.
In 2014 only 13 Russian regions were not borrowing. In half of the territories the share of commercial loans exceeded 50% of the total public debt. At the beginning of 2015 the regions owed 1.1 trillion rubles to banks, which is equivalent to the amount of social transfers received by certain categories of the Russians from sub-federal budgets.
Figure 14. Dynamics of commercial banks loans, attracted by the RF subjects in 2008–2014
Sources: data of the Federal Treasury; the author’s calculations.
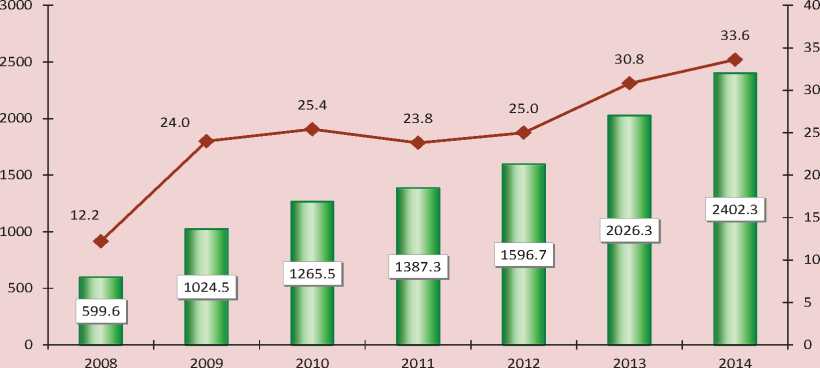
Wider spread of over-indebtedness has not helped ease the debt crisis of sub-federal budgets. At the beginning of 2015 the consolidated debt of RF subjects increased by 380 billion rubles, or 19%, 33.6% of their own revenues will be required for its repayment (fig. 15). According to the global thresholds, this debt level is not high10, but the debt structure of Russian regions consists of loans by almost 80%. Most of them are to be repaid annually, and, as a rule, at the expense of new borrowing.
The regional contrasts in the pace of the debt increase are quite substantial, although it can be noted that there is a clear trend of rapid growth in major industrial regions – Perm Krai, Krasnoyarsk Krai, the Irkutsk Oblast, the Sverdlovsk Oblast, the Novosibirsk Oblast, etc. This means that the deterioration of the situation with the debt burden could become a serious threat to the economic development of the Russian priority territories.
At the end of 2014 the number of RF subjects who have a 50% debt burden increased from 36 to 45. For the first time this list includes the Voronezh Oblast, the Lipetsk Oblast, the Kemerovo Oblast, the Komi Republic, previously characterized by minimal debt.
In 14 regions (in 2013 – in 8) the accumulated amount of debt exceeds 80% of its revenues ( tab. 10 ).
Figure 15. Dynamics of the state and municipal debt of RF subjects in 2008–2014
I I Billion rubles
In % to own budget revenue
Sources: data of the Ministry of Finance of the Russian Federation; the Federal Treasury; the author’s calculations.
Table 10. RF subjects with a critical level of public debt
|
Subject |
2012 |
2013 |
2014 |
2014 to 2012, % |
|||
|
Billion rubles |
%* |
Billion rubles |
%* |
Billion rubles |
%* |
||
|
RF subjects with the debt level over 100% |
|||||||
|
Chukotka Autonomous Okrug |
5.2 |
48.2 |
13.8 |
107.0 |
13.5 |
125.1 |
259.3 |
|
Kostroma Oblast |
12.9 |
77.8 |
15.2 |
84.5 |
18.6 |
101.4 |
144.5 |
|
Smolensk Oblast |
18.5 |
69.1 |
24.3 |
85.4 |
29.7 |
105.1 |
160.4 |
|
Republic of Mordovia |
25.4 |
139.9 |
28.1 |
138.2 |
30.4 |
108.8 |
119.7 |
|
RF subjects with the debt level over 80% |
|||||||
|
Belgorod Oblast |
36.6 |
65.4 |
45.8 |
84.6 |
45.3 |
82.9 |
123.7 |
|
Republic of Karelia |
12.5 |
52.1 |
16.0 |
72.1 |
21.6 |
96.3 |
173.1 |
|
Vologda Oblast |
30.9 |
70.7 |
34.9 |
81.1 |
38.0 |
82.0 |
122.9 |
|
Astrakhan Oblast |
18.7 |
64.4 |
21.7 |
63.7 |
27.3 |
84.7 |
145.9 |
|
Republic of Ingushetia |
0.9 |
33.7 |
2.4 |
78.2 |
2.7 |
80.6 |
282.0 |
|
Republic of North Ossetia |
7.5 |
81.7 |
8.5 |
79.5 |
9.8 |
89.3 |
130.4 |
|
Udmurt Republic |
21.1 |
48.5 |
33.7 |
70.3 |
45.1 |
88.0 |
213.1 |
|
Penza Oblast |
18.1 |
65.7 |
24.1 |
80.3 |
27.2 |
84.7 |
149.9 |
|
Saratov Oblast |
43.4 |
73.0 |
51.0 |
85.4 |
55.5 |
88.7 |
127.8 |
|
Amur Oblast |
16.3 |
47.1 |
24.3 |
68.3 |
30.0 |
81.4 |
184.0 |
|
* To own revenues (debt load). Sources: data of the Ministry of Finance of the Russian Federation; the Federal Treasury; the author’s calculations. |
|||||||
Figure 16. Dynamics of the RF subjects’ budgets expenses on reimbursement of credit in 2009–2014
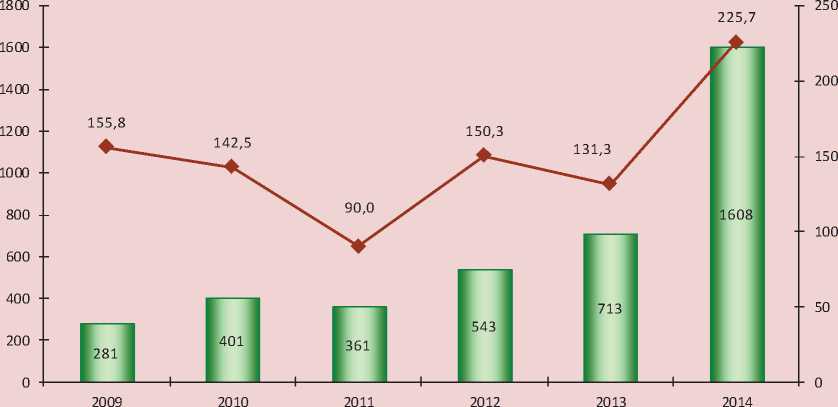
I----1 Billion rubles =0= Growth rate, %
Sources: data of the Federal Treasury; the author’s calculations.
Another problem in the field of debt policy that requires, in our view, the immediate solution concerns the legal regulation. The fact that the costs to repay loans, increased by 2.3 times in 2014 (fig. 16) , are funded from own revenue sources. However, they are included, according to the RF Budgetary Code, not in the expenditure part of the budget, but in the composition of the sources to repay the deficit [1] that devalues the actual size.
According to our calculations, if we take into account the costs on loans repayment, the real deficit of regional budgets increases by 1.6 trillion rubles in 2014 and corresponds to almost a third of revenues. In 27 RF
subjects the deficit will exceed half the volume of own revenues and in 11 subjects – the entire volume (tab. 11) . In 2013 there were 17 and 2 regions, respectively.
Thus, the dynamics of the debt load of Russian regions indicates that in the upcoming budget cycle (2015–2017) the majority of them will not be able to obtain new loans to finance economic development objectives, which, of course, will reduce their competitiveness.
The center’s efforts to allocate budget loans to the regions in the short term will help repay commercial arrears, however, these measures will not solve the problem to refinance the risks and only delay it until
Table 11. Actual and real deficit of RF subjects’ budgets in 2013–2014
|
Subject |
2013 |
2014 |
||||||||
|
Fact deficit |
Loans repayment |
Real deficit |
Fact deficit |
Loans repayment |
Real deficit |
|||||
|
Billion rubles |
%* |
Billion rubles |
%* |
Billion rubles |
%* |
Billion rubles |
%* |
|||
|
Republic Of Mordovia |
4.1 |
20.2 |
10.8 |
14.9 |
73.5 |
5.7 |
20.6 |
53.1 |
58.8 |
210.3 |
|
Omsk Oblast |
9.3 |
15.2 |
66.9 |
76.2 |
125 |
5.8 |
9.0 |
123.6 |
129.4 |
202.0 |
|
Ivanovo Oblast |
3.0 |
13.6 |
5.7 |
8.7 |
39.0 |
3.5 |
15.2 |
35.4 |
38.9 |
170.2 |
|
Arkhangelsk Oblast |
5.8 |
10.5 |
23.8 |
29.6 |
54.0 |
7.4 |
12.6 |
88.6 |
96.0 |
164.9 |
|
Kabardino-Balkar Republic |
1.0 |
8.7 |
2.5 |
3.5 |
30.1 |
2.0 |
15.4 |
19.0 |
21.0 |
162.2 |
|
Nizhny Novgorod Oblast |
10.7 |
9.0 |
59.4 |
70.1 |
59.0 |
11.7 |
9.4 |
153.5 |
165.2 |
133.3 |
|
Amur Oblast |
2.8 |
7.9 |
13.8 |
16.6 |
46.5 |
11.6 |
31.6 |
29.2 |
40.8 |
110.8 |
|
Tomsk Oblast |
6.8 |
15.8 |
14.0 |
20.8 |
48.2 |
6.0 |
12.7 |
45.4 |
51.4 |
108.7 |
|
Republic of Karelia |
5.9 |
26.6 |
8.2 |
14.1 |
63.7 |
3.7 |
16.6 |
20.0 |
23.7 |
105.5 |
|
Tambov Oblast |
5.0 |
21.5 |
6.8 |
11.8 |
50.6 |
2.5 |
10.0 |
22.6 |
25.1 |
100.9 |
|
Kirov Oblast |
6.6 |
19.4 |
11.5 |
18.1 |
53.1 |
4.5 |
12.6 |
31.6 |
36.1 |
100.8 |
|
Russian Federation |
642 |
9.7 |
712.6 |
1355 |
20.6 |
469.0 |
6.6 |
1608 |
2077 |
29.1 |
* Deficit share in the amount of own revenues of the budget.
Source: the author’s calculations according to the Federal Treasury data.
2017, the term to reimburse loans to the federal budget. Ultimately, according to the experts, the budget loans will not solve financial problems of the regions [4]. So, sooner or later the Federation will have to find resources to provide the subjects with the financial aid, otherwise the rising debt situation will repeat.
The forecast for 2015 does not contain any signs of regional finances recovery. According to the HSE experts, the budget deficit in the Russian regions can reach 1.3 trillion rubles [2]. In the conditions of poor generation of own revenues and negative dynamics of federal transfers it is not possible to fund such amount of the deficit.
The results of the current budget process confirm unfavorable forecasts of the experts. In January–February 2015, compared with the same period of 2014, profit tax receipts to the territorial budgets fell by 51.3%, which caused the negative vector of total tax payments.
The federal budget profit decreased by 4%, mainly due to the fall in foreign trade fees by a third.
The Russian authorities can not find a way out of the fiscal crisis of the regions, although, in our opinion, the transfer of the federal budget imbalance to the regional level by delegating the main part of the state social obligations was the key reason for its occurrence and aggravation.
The center’s mission is to reallocate budget flows so that the financial selfsufficiency of RF subjects can be achieved. “The assignment of a clearly insufficient proportion of the consolidated budget total revenues11 to the regions”, notes Doctor of Economics A.Z. Seleznev, “virtually eliminates their active role in the implementation of new industrialization by means of their own financial basis” [15].
In our view, the references to the scarcity of the Federal Treasury can not justify the annual sequestration of transfers to the regions; their share in the federal spending amounts to 11% on average, which is much lower than in the OECD countries (30–40%).
The results of the ISEDT RAS research [3, 11, 12, 13, 14] prove that there are additional reserves to increase the budget. The key ones relate to the legislative amendments to the Tax and Budget codes, in particular: review of the administration of large corporations’ profit and abolition of a number unjustified tax privileges; introduction of the progressive taxation of physical persons’ incomes; recovery of the state regulation of foreign exchange activity and introduction of cross-border transactions tax; abolition of the large-scale benefits and VAT exemptions, contrasting major commodity exporters and financial conciliators to other economic entities;
inventory of regions’ powers and assessment of their revenue potential, etc.
Our calculations show that during these measures implementation about 18 trillion rubles of additional annual revenues could be received to the National Treasury. It would redistribute a significant share of funds to the regions in the form of regulating taxes or interbudgetary transfers and, ultimately, promote the achievement of strategic objectives of the country’s socio-economic development.
During the crisis the regional authorities should use the few remaining sources to stabilize their budgets.
First, more active work with the informal sector and debtors on tax payments is required. According to the FTS, more than 30% of the enterprises registered with the taxing authorities do not give in the statements annually. In 2014 the taxpayers’ debt increased by 111 billion rubles, compared to 570 billion rubles in 201312. Regional and local payments debts total 35% of this amount; it indicates the regional authorities’ insufficient work with taxpayers.
Second, it is necessary to increase fiscal functions of property taxes, fulfilled by the sub-federal authorities. According to the FTS, 40% of the real estate owners are not registered. Thus, the territorial budgets lack 45 billion rubles annually.
Third, the attention should be paid to the issues of strict budget discipline. Despite the acute shortage of budgetary resources the regions do not draw 800 billion rubles of the allocated funds annually. The accounts receivable of the budgets increases; at the beginning of 2014 it amounted to almost 500 billion rubles. It is mainly advances and loans granted from the regional budgets.
Fourth, despite much talk about the management costs optimization the authorities have not achieved their radical reduction.
According to our estimates, in 2014 the growth of administrative costs was observed in 62 regions; it indicates the available reserves for their reductions, primarily at the expense of more modest remuneration of the officials13.
Of course, the use of explicit sources to increase territorial budgets will weaken the risks of imbalance. At the same time, the central authorities’ unwillingness to change the approaches to fiscal policy, redirect it toward the interests of regional development lead to the rise in profit and corporate taxes. This requires the formation of a diversified base of taxpayers by creating new production and infrastructure projects and reconstructing enterprises for the production of building materials. Only the achievement of financial self-sufficiency can promote the accomplishment of the Russian regions’ mission in the country’s socio-economic development.
Список литературы Execution of local budgets in 2014: tension is not decreasing
- Byudzhetnyi kodeks Rossiiskoi Federatsii . Moscow: Eksmo, 2013. 448 p.
- Bazanova E. Vysshaya shkola ekonomiki: defitsit regionov mozhet sostavit’ 1,8% VVP . Vedomosti , 2015, no. 3783.
- Il’in V.A., Povarova A.I. Problemy effektivnosti gosudarstvennogo upravleniya. Byudzhetnyi krizis regionov: monografiya . Vologda: ISERT RAN, 2013. 128 p.
- Obukhova E. Na plavu proderzhatsya, no vzletet’ ne smogut . Ekspert , 2015, no. 11. Available at: http://expert.ru/expert/2015/11.
- O vnesenii izmenenii v Federal’nyi zakon “O federal’nom byudzhete na 2015 god i na planovyi period 2016 i 2017 godov”: Zaklyuchenie Schetnoi palaty RF na proekt Federal’nogo zakona № 744090-6 . Ofitsial’nyi sait Schetnoi palaty RF . Available at: http://audit.gov.ru/activities/audit-of-the-federal-budget/21096/
- Ofitsial’nyi sait Banka Rossii . Available at: http://www.cbr.ru/statistics/
- Ofitsial’nyi sait Ministerstva finansov RF . Available at: http://www.minfin.ru/ru/
- Ofitsial’nyi sait Federal’nogo kaznacheistva Rossii . Available at: http://www.roskazna.ru/
- Ofitsial’nyi sait Federal’noi nalogovoi sluzhby Rossii . Available at: http://www.nalog.ru/
- Ofitsial’nyi sait Federal’noi sluzhby gosudarstvennoi statistiki . Available at: http://www.gks.ru/
- Pechenskaya M.A. Mezhbyudzhetnye otnosheniya: sostoyanie, regulirovanie, otsenka rezul’tativnosti: monografiya . Vologda: ISERT RAN, 2015. 161 p.
- Povarova A.I. Ob usloviyakh i merakh povysheniya effektivnosti obshchestvennykh finansov (kriticheskie zametki) . Ekonomist , 2014, no. 3, pp. 68-71.
- Povarova A.I. Neeffektivnoe administrirovanie NDS kak ugroza ekonomicheskoi bezopasnosti Rossii . Ekonomicheskie i sotsial’nye peremeny: fakty, tendentsii, prognoz , 2013, no. 2, pp. 126-140.
- Povarova A.I. Snizhenie fiskal’noi funktsii naloga na pribyl’: faktory i puti povysheniya Ekonomicheskie i sotsial’nye peremeny: fakty, tendentsii, prognoz , 2014, no. 3, pp. 180-195. - DOI: 10.15838/esc/2014.3.33.14
- Seleznev A.Z. Startovye usloviya i problemy byudzhetnoi trekhletki (2015-2017 gg.) . Ekonomist , 2015, no. 2, pp. 3-16.

