
Explainable AI for Diabetes Nutrition: Time-Aware Seq2Seq Learning for Personalized 21-Meal Weekly Planning
Журнал: International Journal of Information Technology and Computer Science @ijitcs
Статья в выпуске: 5 Vol. 18, 2026 года.
Бесплатный доступ
Adequate nutrition, patient acceptance and consistent dietary adherence are required for optimal chronic glycaemic control in T2DM. Customised and clinically adapted meal planning may best support these factors. This work is situated in the field of Medical Informatics, combining explainable sequence modelling with clinically meaningful dietary restrictions, ensuring both prediction accuracy and health-oriented decision support for Type 2 Diabetes Mellitus (T2DM). In contrast to the traditional RNN based recommenders, the proposed approach explicitly incorporates adherence-aware assessment, interpretability and nutritional safety. In this paper, we propose CA-Seq2Seq-LSTM-Attn, a Constraint-Aware Seq2Seq-LSTM with Dot-Product Attention framework for generating customised seven-day meal plans (21 meals) from nutritional constraints and previous dietary behaviour. We use an LSTM-based Seq2Seq architecture in place of Transformer-based models because of its strong inductive bias for modelling short, structured temporal sequences (21 meals over 7 days), better generalisation on small high-variance dietary datasets, and lower computational complexity than data-hungry Transformer models. The model is a sequence-to-sequence Long Short-Term Memory (LSTM) architecture with attention for capturing temporal eating patterns in daily meal sequences. The constraint-aware decoding strategy ensures that the calorie, carbohydrate, sugar, protein limits, and the Glycaemic Index (GI) and Glycaemic Load (GL) thresholds are satisfied, which is crucial in the context of diabetes management. The attention mechanism makes the respective forecast more interpretable by pointing to important previous meals. We evaluate the system using enriched user-recipe interactions and comprehensive nutritional data from the Food.com dataset. The experimental results show a good ranking performance with NDCG@10 of 0.5026 and Recall@10 of 0.5909. The model also ensures a better diet consistency, as indicated by the lower variance in carbs (826.6690), weekday adherence (74.39%), intra-plan variety (0.7180), and high explainability (minimum perturbation-based faithfulness confidence reduction: −0.0288). Incorporating temporal sequence modelling, attention-based interpretability and constraint-aware decoding substantially improve clinical nutritional feasibility and recommendation accuracy. The proposed framework outperforms the traditional Collaborative Filtering (BPR-MF, NCF) and sequential deep learning baselines (GRU4Rec, SASRec) on all ranking and nutrition metrics. The proposed CA-Seq2Seq-LSTM-Attn framework is a promising decision-support tool for personalised dietary control in T2DM as it generates interpretable, nutritionally balanced and clinically matched meal recommendations.
Короткий адрес: https://sciup.org/15020761
IDS: 15020761 | DOI: 10.5815/ijitcs.2026.05.10
Текст научной статьи Explainable AI for Diabetes Nutrition: Time-Aware Seq2Seq Learning for Personalized 21-Meal Weekly Planning
The field of personalized nutrition has become popular in recent years because researchers are creating dietary treatments which suit the unique physical characteristics and real-world eating patterns and outdoor settings of each individual [1]. The approach needs different assessment methods because it requires evaluation of individual metabolic patterns together with their personal food choices and health goals and their customary eating habits. Multiple studies have demonstrated that personalized nutrition represents a vital component for improving health outcomes and dietary adherence and the ability of people with chronic metabolic disorders, especially Type 2 Diabetes Mellitus, to sustain their dietary changes [2].
The process of developing meal plans for each user requires established methods which depend on existing rules and set standards. The system offers users two meal plan options which include vegetarian meals and low-carbohydrate meals based on their Type 2 Diabetes Mellitus dietary requirements [3-6]. The systems, despite being valuable, show a lack of flexibility and are not capable of adjusting to the changing needs of the users. Due to conflicting regulations, they are susceptible to inaccuracies and discrepancies, and they are also struggling to keep up utilising the most recent insights and developments in diet [7].
In order to solve these problems and encourage good eating habits, more and more interest is growing in the development of personalized nutrition recommendation systems, apps, and tools that would offer individual consumers, including those treating Type 2 Diabetes Mellitus, customized dietary advice and suggestions [8]. Advances in technology like (AI) also (ML) are being utilized by these applications to analyze user data such as food choices, cultural influences, and then offer personalized recommendations for the best nutrition and health through technology [9]. Nevertheless, the prevailing systems still rely on AI primarily for food identification based on images and volume measurement, which in turn helps to estimate the nutritional and caloric intake [10]. A potential use case for ML and DL algorithms in healthcare is the prompt recognition as well as treatment of patients vulnerable to nutrition and diet-related problems related to type 2 diabetes mellitus. These algorithms possess the capacity to be both efficient and scalable [11].
Nonetheless, these most efficacious designs do not always have enough clarity or simplicity to be easily understood by laypeople, which makes it hard for them to be used in clinical settings. Within this framework, Explainable AI (XAI) improves human understanding and confidence in judgments and predictions made by AI [12], hence constituting a logical progression towards Trustworthy AI [13]. Moreover, Explainable AI has shown promise in making forecasts more accurate and presenting clearer, more comprehensible reasons for its decisions, which helps users understand the system better, in addition to making correct predictions [14,15].
Traditional food recommender systems predict individual users' meal preferences but do not take into account weekly sequential eating behaviours and Dietary restrictions for Type 2 Diabetes Mellitus (T2DM) management. Moreover, many deep learning approaches function as black-box models, limiting interpretability and reducing user trust in healthcare-critical applications. To solve the above limitations, this study presents a time-dependent sequence learning approach for weekly meal planning and develops an explainable AI framework to generate personalised seven-day meal plans based on past dietary patterns. Although Transformer-based architectures and Temporal Fusion Transformers (TFT) dominate the field of long-range sequence modelling, the current work employs an LSTM-based Seq2Seq architecture due to its strong inductive bias for modelling short, structured temporal sequences. In this setting, meal planning has to do with relatively short sequences (21 meals over 7 days) and limited user-specific data, where LSTMs demonstrate better generalisation, stability and lower computational complexity than data-hungry Transformer models. This makes LSTM particularly well-suited for small high variance dietary datasets that are common in personalised nutrition applications.
The main contributions of this work are (i) an attention-based Seq2Seq LSTM model learning temporal dietary patterns for multi-day meal prediction, (ii) a constraint-aware decoding method ensuring dietary balance, diversity and realistic recommendations, and (iii) an explainability mechanism based on attention and faithfulness analysis to give justifications of model predictions. The proposed approach enhances meal recommendation systems by considering personalisation, compliance to clinical constraints and interpretability.
The rest of the paper is organised as follows: Section 2 reviews related work on meal plan prediction. Section 3 describes the methodology to develop the proposed framework. Section 4 presents the proposed model, experimental results and discussion. Finally, the paper is concluded in Section 5.
2. Related Work
The research developed a Personalised Diet Recommendation System which uses artificial neural networks to create tailored dietary recommendations that depend on a person's health information which includes their age, gender, body mass index, physical activity level, and eating habits. The method uses machine instructions to assess user inputs and create meal plans which meet health goals of weight loss and muscle gain and Type 2 Diabetes Mellitus glycemic control. The ANN improves suggestion precision over time by consistently assimilating user input. This method seeks to encourage better lives via automated, data-informed dietary planning.
Meal suggestions, particularly for the long-term nutritional control of Type 2 Diabetes Mellitus, are derived from a sequence-oriented suggestion algorithm that is developed using the chronologically arranged data from interactions between users and items in recommendation systems. In order to generate customized meal suggestions, the recommendation model is constructed with the help of an LSTM network along with a cooperative filtering component [16]. LSTM-based RS succeeds on real-world food recommendation data. The approach surpasses common RSs in accuracy. In meal recommendation systems, the effectiveness of the system can be measured using recall, mean average precision, and mean reciprocal rank, according to experiments.
[17] Introduced an innovative Sequential Transfer Learning approach using Hierarchical Clustering. This innovative method emulates a sequential problem-solving paradigm based on the grouping of like food kinds. The suggested method yields an accuracy improvement of up to 6% over conventional network training and produces a resilient model that excels in difficult, previously un-encountered scenarios. This method has also been evaluated for segmenting items in meals of Danish school students for the purpose of dietary intake monitoring with implications for dietary pattern analysis relevant to Type 2 Diabetes Mellitus management.
[18] Investigated how contextual factors affect food consumption and daily diet quality using machine learning. It analysed data from 675 participants aged 18-30 who tracked their food intake through a smartphone app. The research aims to evaluate the quality of diets based on comparisons with Australian Dietary Guidelines through the Dietary Guideline Index. The predictive models had a mean absolute error of less than half a serving, indicating very high accuracy, predicting the quality of one's everyday diet. The estimates differed by up to 11.86 DGI points. These results are highly relevant for the monitoring of diets in metabolic disorders, such as Type 2 Diabetes Mellitus.
[19] showed a mixed-meal suggested system that not only solves the problems of cold start and community aspects, but also fulfills the previous constraints on the aforementioned food ingredients and similar ones. A user-based recommendation phase that employs deep learning for clustering and a content-based recommendation phase that applies graph clustering make up the method. Patients with Type 2 Diabetes Mellitus benefit greatly because of the method's improved recommendation quality, which is a direct result of its attention to both time and community factors.
3. Background
3.1. Long Short-Term Memory (LSTM)
The study [20] suggests a nutrition advice method based on a rapidly explainable AI system. The proposed method is based on a vast neural system and complex loss functions to respect nutritional guidelines for chronic disease management, including Type 2 Diabetes Mellitus. It uses a variational autoencoder in a descriptive latent space to model users' anthropometrics and medical conditions. An optimizer generates personalized weekly meal plans by varying meal amounts according to energy requirements. Food diversity and generality are enhanced through ChatGPT's extensive meal database that comprises multiple cuisines. The diet recommendation system can easily be integrated into future systems after extensive testing on 3000 virtual user profiles and 84,000 daily meal plans in addition to 1000 real profiles with 7,000 daily meal plans. It satisfies users' nutrient requirements as well as their caloric needs
Research Gap
Personalised diet recommendation has been widely implemented with machine learning. However, there are still several critical challenges in the management of chronic conditions such as Type 2 Diabetes Mellitus (T2DM). The current approaches, such as ANN and LSTM-based models, mainly focus on prediction accuracy based on user attributes but fail to capture temporal eating patterns and long-term dietary habits which are crucial for stable glucose levels.
Hybrid models attempt to reduce the effects of cold-start and community effects, but they are not interpretable and therefore have limited utility in clinical decision making. Current explainable AI approaches improve transparency and focus on simple nutrient compliance, but do not explicitly model the role of past eating behaviour in future recommendations. Besides, they frequently neglect clinically relevant factors such as Glycaemic Index (GI) and Glycaemic Load (GL) that are crucial for glycaemic control in T2DM. Another major limitation is that current systems provide short-term or single-meal recommendations rather than structured multi-day meal plans. They also do not balance the need for recommender alignment (i.e. suggesting meals based on user preference) and clinical correction (i.e. ensuring that recommendations are medically appropriate), which is important in diabetes management. Thus, an integrated approach is required that exploits time-aware sequence learning, explainable AI and clinically relevant constraints to produce personalised, transparent and multi-day meal plans. Such a system can enhance the user trust, adherence to diet and overall disease management.
LSTM model [21] is an effective regular neural architecture developed to deal with the frequent problems of exploding and disappearing gradients in acquiring dependence over time, regardless of dealing with small intervals that are considerably prolonged [22]. A continuous error carousel (CEC) can keep the error signal going inside the cells of each unit, which can help with this. The memory cell is actually a recurrent network with a unique design; it takes a central electronic circuit (CEC) and adds two gates and input and an output to make it work. The feedback with a onetime step delay is represented by the self-recurrent connections [23]. Colah [24] says that the LSTM model is chain-structured. However, the structure of the repeating module is unique. It employs a unique communication method across four interconnected layers of neural networks rather than a single network, as is typical with RNNs. The LSTM neural network's design is exposed in Figure 1.
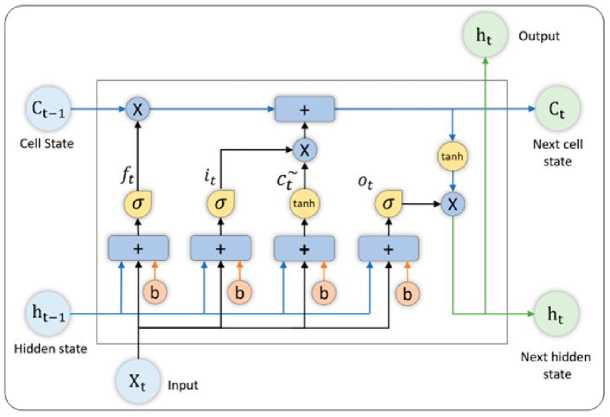
Fig. 1. Architecture of LSTM Model
A typical LSTM network comprises memories referred to as cells. Two states are passed to the following cell: the cell state and the hidden state. The cell state is the principal data transport mechanism, allowing data to be transferred in essentially unchanged form. However, a few straight shifts could happen. The use of sigmoid gates allows for the incorporation or extraction of data from cellular state. A gate functions as a layer or a sequence of operations applied to a matrix, incorporating numerous values. LSTMs utilize gates to regulate the memory procedure, hence mitigating the long-term attachment issue[25].
The initial phase in constructing an LSTM network involves identifying superfluous information to be omitted from the cell at a given time. The sigmoid function regulates this method of filtering and discarding information, relying on information from a previous LSTM layer (ht-1) as well as input information (Xt), at a specific time t. Additionally, the sigmoid function also determines which information from a previous output will be removed. This method is known as the forget gate (ft), where ft is a vector containing elements in a range from 0 to 1, counting each element in the cell state , Ct-1 .
f t =σ(W f [h t-1 , X t ] +b f ) (1)
Equation (1 ) represents how the forget gate ft works: it decides how much information from the past cell state C t-1 to forget or retain. The gate takes as input the concatenation of the previous hidden state h t-1 and the current input X t , followed by a linear transformation using weight matrix W f and bias b f . The sigmoid activation function σ ( ⋅ ) constrains the output values between 0 and 1, where values close to 0 indicate information to be forgotten and values close to 1 indicate information to be preserved.
In this context, a denotes the sigmoid function, whereas W f and b f represent the weight matrices and bias of the forget gate, respectively. The subsequent phase involves determining and retaining data from fresh input (Xt) during cell state updates and within cell state updates. There are two layers that make up this stage: the sigmoid and the tanh. The sigmoid layer updates or ignores the new information (0 or 1) first, and the tanh function establishes the relevance of the processed data by assigning weight to it (-1 to 1). The new cell state is created by multiplying the two previous numbers. This updated storage is then added to previous memory Ct-1 , resulting in Ct .
i t =σ(W t [h t-1 , X t ] +b f ) (2)
N t = tanh(W n [h t-1 , X t ] + b n ) (3)
C t = C t-i f t + N t i t (4)
Equation (2) defines the input gate, which controls what new candidate data will be saved into the cell state. The forget gate processes the combined vector [ht-1, Xt] through a sigmoid function which lets it control incoming data for the cell state update process.
Equation (3) defines the candidate cell state NT, which holds new information which the system will use to update the memory cell. The system uses the hyperbolic tangent (tanh) activation function for value calculation which restricts output to the range of [-1, 1]. The tanh activation function scales new data while measuring its significance to the upcoming cell state integration process.
Equation (4) describes the update mechanism of the cell state C t . the previous cell state C t-1 is first scaled by the forget gate f t , effectively removing irrelevant information. Simultaneously, the candidate cell state N T is modulated by the input gate i t to control the addition of new information. The combination of these two operations results in the updated cell state, allowing the LSTM to maintain long-term dependencies.
Where, Ct-1 and Ct represent the cell states at times t - 1 and t , respectively, whereas W and b denote the weight matrices and bias of the cell state.
In the last stage, the result values (ht) are derived from the output cell state (Ot) but stand in for an altered version. The sigmoid layer is responsible for selecting which aspects of the cell state are transmitted to the output. That which the sigmoid gate produces ( O T ) is then multiplied by the new values generated by the tanh layer from the cell state (Ct) , which range from -1 to 1.
O t = σ(W o [h t-1 , X 1 ] +b o ) (5)
ht = Ottanh(Ct) (6)
Equation (5) defines the output gate O T , which determines which parts of the updated cell state should be exposed as output. The sigmoid activation ensures that only relevant components of the cell state are selected based on the current input and previous hidden state.
Equation (6) shows how the hidden state ht is calculated, which functions as the complete output of the LSTM unit at time t. The output gate OT first receives the updated cell state Ct which undergoes tanh activation for value normalization before the two elements get multiplied together. This operation produces a filtered and bounded hidden representation that is forwarded to the next time step or subsequent network layers.
In this context, Wo and bo represent the final gate's weight matrices and bias, which are, accordingly, the components in question.
4. Methodology
This research presents a framework for predicting a personalised 7-day meal plan, encompassing 21 meals (three per day), for individuals with Type 2 Diabetes Mellitus, utilising Explainable AI and time-aware sequence learning. The proposed methodology combines deep sequential modelling, the satisfaction of diabetes-specific nutritional constraints, and attention-based explainability to produce meal recommendations that are healthy, nutritionally balanced, varied, and easily understood, based on historical user behaviour and dietary patterns.
-
4.1. Dataset and Description
-
4.2. Pre-processing
The dataset used in this research is Food.com Recipes and User Interactions dataset from Kaggle. This data set contains fine-grained user-recipe interactions and rich recipe-level features crawled from Food.com (formerly GeniusKitchen). Each interaction record contains user identifiers, recipe identifiers, user ratings, and timestamps, which allows modelling of long-term sequential eating behaviour. Each recipe includes nutritional features such as calories, carbohydrate, sugar, protein, sodium content and total cooking time. The dataset covers more than 180K recipes and about 700K user interactions over a period of 18 years and is a good resource for time-aware sequence learning and explainable recommendation modelling. However, a community-sourced dataset such as Food.com may have noisy or incomplete nutritional metadata, particularly missing micronutrient information such as fibre that is relevant for T2DM management. To improve the reliability of the data, a ground-truth verification step was implemented by cross-referencing commonly used recipes with the USDA Food Data Central database. Recipes with a large deviation from standard nutritional values were removed during preprocessing.
Dataset:
To allow preprocessing, one recipe is converted into a unique token by creating a specific vocabulary.
-
A. Recipe Tokenization
Each recipe r ∈ R is mapped to a discrete token using a vocabulary mapping function:
ϕ:R → {1,2,...,V} (7)
Equation (7) defines the recipe tokenization function ϕ ( ⋅ ) defines R to produce a unique discrete identifier which exists within a vocabulary that has V different identifiers. The process transforms recipe data which exists in symbolic form into numerical tokens that can be used for sequence modeling purposes. Restricting the vocabulary to the top 50,000 most frequently consumed recipes reduces sparsity, improves generalization, and stabilizes training. Special tokens such as PAD, UNK, BOS, and EOS are introduced to handle sequence padding, unseen recipes, and sequence boundaries.
Where V is the vocabulary size? Only the top 50,000 most frequently consumed recipes are retained to reduce sparsity and improve generalization.
Special tokens are proposed:
-
B. Recipe Tokenization
-
0: PAD (padding token)
-
1: UNK (unknown recipe)
-
2: BOS (beginning of sequence)
-
3: EOS (end of sequence)
-
4.3. Time-Aware Sequence Construction
-
4.4. Sequence-to-Sequence Learning Framework
Nutritional attributes initially supplied as list-valued strings are processed and transformed into distinct scalar characteristics. Missing nutritional values are imputed using median statistics to provide numerical stability and avoid bias during training.
User interactions are ordered by time to preserve temporal dependencies and capture sequential eating behaviour. A sliding-window technique is used to produce training samples. For each user sequence, we create overlapping windows of length (H + L) where the first H items are the input history and the next L items are the prediction targets. Predefined thresholds are used to filter out sequences with too many unknown tokens, leading to higher data quality. If the input history contains more than 20% unknown recipes or the target sequence contains more than 10% unknown recipes, a training sample is discarded. This way the model learns from meaningful and behaviourally consistent data. It should be pointed out that the current time modelling is based on the chronological meal sequences (sequential eating patterns). More sophisticated temporal aspects like circadian rhythm effects (time-of-day eating patterns) and seasonal variations in diets are not explored due to the absence of fine-grained temporal metadata in the Food.com dataset.
The fundamental prediction model is a (Seq2Seq-LSTM) architecture including an attention mechanism.
Model Input and Output Definition
The model takes as input a fixed-length sequence of historical meal interactions for each user, represented as a sequence of recipe tokens X = {T1, T2,…. , TH} , where H denotes the history length (past consumed meals ordered temporally). Each token corresponds to a unique recipe identifier mapped into the model vocabulary.
The model outputs a predicted sequence of recipe tokens Y = {TH+1, TH+2,…. , TH+21} , representing a complete 7-day meal plan consisting of 21 meals (three meals per day). Along with the predicted recipes, the model also produces attention weights that quantify the influence of historical meals on each predicted meal, enabling interpretability.
-
A. Encoder
Each recipe token τt is first represented as a dense embedding vector:
et = Embed(τt), et ∈ R d (8)
Equation (8) represents the embedding layer , where each recipe token τ t is projected into a continuous dense vector det ∈ R d . These embeddings include latent semantic relationships that allow the model to learn similarities in nutritional information and consumption, beyond the identification of food items. Here d refers to the dimension of the embeddings.
The encoder LSTM processes the history of meal embeddings in sequence to generate a sequence of hidden states:
h tenc = LSTM enc (e t , h te-n1c ) (9)
Equation (9) specifies how the encoder's LSTM updates its hidden state. The encoder processes each of the historical meals' representations in sequence, generating a sequence of hidden states ht enc that capture users' behavioral patterns regarding food consumption throughout time. The set of encoder's states Henc represents a contextual memory of users' temporal patterns of food consumption.
The encoder output is denoted as Henc = {h1enc, .... , heHnc}, which would capture the temporal behavior of the food intake of a user.
-
B. Decoder
The decoder LSTM builds the weekly food plan autoregressively on the basis of the encoder’s states. At each decoding stept, the hidden state of the decoder is calculated as follows:
h tdec = LSTM dec (e t-1 , h td-e1c ) (10)
Equation (10) defines the hidden state of the decoder LSTM, which makes future meal recommendations in an autoregressive manner. During the process of decoding, the hidden state of the decoder is updated in accordance with its prior hidden state and the last output’s embedded representation, to facilitate a series of outputs in recommending a meal plan spanning multiple days.
-
C. Attention Mechanism
To enable Explainability, the dot product attention approach is employed to calculate the weight of the respective Prior Meals in relation to the current Forecast.
j=1 t t
Equation (11) calculates the attention weight α t,i by a dot-product attention mechanism. These normalized weights quantify the relevance of each encoder hidden state hi enc with respect to the current decoder state ht dec , enabling the model to focus on the most influential past meals during the prediction.
The context vector is computed as:
c t = ∑i H =1α t,i h ienc
Equation (12) defines context vector c t that is computed as the weighted sum of all the hidden states in the encoder using the attention weights. It carries historically relevant food information particular to the current prediction step.
The last representation produced by the decoder is a concatenation of the decoder state and the context vector:
z t = [h tdec , c t ]
Equation (13) constructs the decoded representation z t using a concatenation of the decoder’s hidden state and the context vector. This is a combined representation which captures both generative information and historical context.
Next, the probability distribution over the recipe words is produced with a softmax layer:
P(τt|X) = Softmax(Wzt + b)
Equation (14) computes the conditional probability distribution over the recipe vocabulary by using a softmax layer. This probability distribution represents the probability of the selection of each candidate recipe at the decoding step t, given the historical input sequence X.
Attention weights αt,i serve as a basis for model explainability since they point to what previous meals they were based upon.
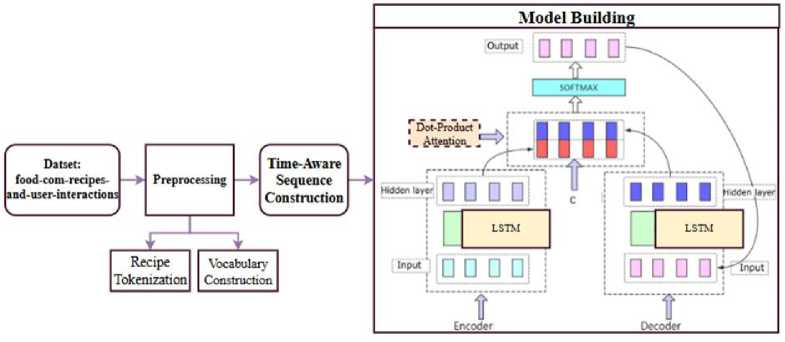
Fig. 2. Proposed Model Architecture
-
4.5. Constraint-Aware Decoding Strategy
To ensure both nutritional and clinical feasibility, a constraint-aware decoding strategy is employed instead of standard greedy decoding. At each decoding step, a candidate set of recipes is selected from the top- k most probable outputs generated by the model. These candidates are then filtered using a set of predefined nutritional and clinical constraints to ensure that only feasible meal options are retained.
The following constraints must be satisfied for each day (d) :
|
1400 ≤ ∑cal d ≤ 1800 |
(15) |
|
90 ≤ ∑carbd ≤ 150 |
(16) |
|
∑sugard ≤ 25 |
(17) |
|
∑proteind ≤ 25 |
(18) |
|
∑GI d ≤ GI max |
(19) |
|
∑GL d ≤ GL max |
(20) |
Equation (15) enforces a daily caloric range to prevent both under consumption and overconsumption.
Equation (16) constrains total carbohydrate intake to maintain metabolic stability.
Equation (17) limits sugar intake to reduce the risk of hyperglycemia.
Equation (18) regulates protein consumption to ensure balanced nutrition.
Importantly, to enhance clinical relevance for T2DM management, Glycaemic Index (GI) and Glycaemic Load (GL) constraints are incorporated into the decoding process.
Equation (19) ensures that the cumulative glycaemic index of daily meals remains within safe thresholds, while Equation (20) restricts glycaemic load to minimize postprandial glucose spikes. These additions extend the framework beyond basic macronutrient control toward clinically meaningful glycaemic regulation.
In addition to daily constraints, per-meal calorie limits are enforced to maintain balanced distribution across breakfast, lunch, and dinner:
cal meal ≤ {550,650,750} (21)
Equation (21) ensures appropriate caloric allocation across meals, preventing uneven energy intake throughout the day.
Furthermore, the decoding process fosters diversity by prohibiting the repetition of recipes in the weekly plan. The approach is reproducible without any stochastic beam expansion and involves a constrained top-k filtering mechanism that combines probabilistic ranking from the neural model with deterministic rule-based filtering. In summary, this hybrid approach combines neural sequence modelling and symbolic nutritional constraints, allowing us to generate personalised meal plans that are preference-aware, clinically-safe and suitable for Type 2 Diabetes Mellitus management. We note that the model balances recommender alignment (serving users what they like, based on their historical dietary patterns) with clinical correction (serving users what they need, through constraint-aware decoding). The clinical correction layer is constraint-aware decoding that overrides preferences if a candidate meal violates T2DM nutritional thresholds. This tackles the intrinsic tension in health-aware recommender systems where a user’s past behaviour may also be indicative of poor dietary habits contributing to their condition. Future work may include reinforcement learning to adaptively shift recommendations towards clinically optimal behaviour over time.
-
4.6. Training Objective and Optimization
-
4.7. Explainability Validation and Evaluation
Model training optimises a composite loss function that equilibrates predicted accuracy and practical applicability:
L = LCE + λ1Lcov + λ2Ltime + λ3LUNK (22)
Equation (22) defines the composite training loss function used in the model training process as its optimization method. The total loss combines cross-entropy loss for prediction accuracy with auxiliary penalties that encourage coverage diversity L cov, temporal practicality L time, and reduced reliance on unknown recipes (LUNK). The weighting coefficients λ1, λ2, λ3 establish a balance between predictive performance and practical use of the solution, while the Adam optimizer with gradient clipping ensures process optimization maintains stable results.
The expected and actual recipes establish cross-entropy loss through L_CE calculation.
L_cov sanctions excessive focus on a limited selection of dishes,
L_time imposes penalties for excessive cooking duration on weekdays, and L_UNK disapproves of unverified recipe forecasts. The model uses the Adam optimiser with gradient clipping to achieve stable convergence during its refinement process.
The explainability of the proposed model is evaluated by a faithfulness-based perturbation approach. In this method we remove the most important past meal inputs (identified using attention weights) and measure the change in prediction confidence. If the confidence of the model decreases after the removal of these inputs, it indicates that the model indeed depends on them and thus the correctness of the explanation is validated. Here the observed change in confidence is -0.0288. This is a small decrease in prediction confidence after important inputs are removed. This suggests that the model uses several relevant past meals, rather than a single feature, which results in stable and reliable explanations. In this case, the faithfulness metric is defined as the difference of prediction confidence before and after perturbation of the input, where the negative value indicates the reduction of the confidence. The model is evaluated using standard ranking metrics such as Top-K Accuracy, Recall@10, and NDCG@10, and domain-specific measures such as constraint satisfaction, intra-plan diversity, and nutritional consistency, in addition to its explainability. Overall, the proposed approach ensures meal recommendations are accurate and personalised, while also being transparent and applicable to healthcare.
-
4.8. Performance Metrics
-
• Top-1 Accuracy (Top-1 Acc): Measures the fraction of times the model’s top prediction matches the ground truth.
Top-1 Acc= 1 ∑ iN=1 1(ŷ i(1) =y i ) (21)
Equation (21) defines Top-1 Accuracy , which measures the proportion of test instances for which the model’s highestranked prediction exactly matches the ground-truth label. This metric reflects the model’s strictest predictive capability, as only the single most confident output is evaluated.
-
• Top-5 Accuracy (Top-5 Acc): Fraction of times the ground truth appears within the model’s top-5 predictions.
Top-5 Acc= 1 ∑ iN=1 1(y i ∈ {ŷ i(1) ,…., ŷ i(5) })
Equation (22) represents Top-5 Accuracy , which evaluates whether the correct ground-truth item appears within the top five predictions generated by the model. This metric captures the model’s ability to provide useful recommendations even when the top-ranked prediction is not exact.
-
• Top-10 Accuracy (Top-10 Acc): Fraction of times the ground truth appears within the model’s top-10 predictions.
Top-10 Acc= 1 ∑ iN=1 1(y i ∈ {ŷ i(1) ,…., ŷ i(10) })
Equation (23) also provides a description of Top-10 Accuracy , which extends this evaluation to a top ten list of predictions. This metric is useful in systems that provide recommendations, as more options are often deemed more valuable than a single output.
-
• Recall@10 (R@10): Assesses the ratio of pertinent items obtained inside the top ten recommendations.
# of relevant items in top-10 Recall@10 = # of relevant items in top-10 total relevant items
Equation (24) proposes Recall@10 as a metric to quantify the percentage of all relevant items successfully retrieved out of the top ten recommendations. The Recall metric is helpful with multi-item recommendations.
-
• NDCG@10: Normalized Discounted Cumulative Gain, with the value of the metric being specified as 10. It evaluates ranking quality by assigning higher significance to relevant items.
NDCG@10 = 1 ∑i 1 = 0 1
2 reli -1 log 2 (i+1)
Where Z is an ideal DCG for normalization.
Equation (25) proposes Normalized Discounted Cumulative Gain at 10 (NDCG@10) , a ranking-sensitive relevance evaluation method that places greater importance on items that appear higher up in the ranking lists. The normalization factor Z is defined as the ideal value of DCG.
-
• Carbohydrate Variance (Carb variance): Measures the variability of daily carbohydrate intake on a weekly scale.
σc 2 arb = 1 ∑ iN=1 (carb i - ̅c̅a̅̅r̅b̅) 2
Equation (26) computes the variance of the amount of carbohydrates by determining the day-to-day variations in the amount of dietary carbohydrates used within the planning period. Thus, the lower the variance, the more nutrient-balanced the meal plan.
-
• Intra-Plan Diversity (IPD): Percentage of unique recipes in weekly plan for diversity. This metric measures variety at the recipe/ingredient level to avoid recipe fatigue, not variability in the distribution of macronutrients. The constraint-aware decoding layer independently maintains nutritional consistency.
IPD =
| unique recipes in week| 21
Equation (27) introduces the notion of Intra-Plan Diversity (IPD) as the set of recipes divided by the total number of meals in the user’s weekly plan. Such an approach promotes diversity by imposing a penalty for repeated recommendations to the user.
-
• Ingredient Jaccard Similarity: It identifies the overlap of ingredients in different dishes to calculate varieties.
|A∩B|
|A ∪ B|
Equation (28) represents the Ingredient Jaccard Similarity measure. It determines the similarity between the ingredients in two dishes. Lower similarity values ensure variety in the ingredients. Hence, it avoids monotony.
-
• Weekday Compliance (%): Percentage of weekdays where nutritional or timing constraints are met.
Weekday Compliance = # compliant meals ∗ 100 (29)
# total weekday meals
Equation (29) shows that the first metric measures weekday compliance by calculating the percentage of scheduled meals which meet specific requirements. The second metric assesses how well the created meal plans function during actual weekend periods.
-
• Faithfulness Drop: Quantifies the decrease in model confidence when key input features are masked.
∆f= Confidenceoriginal - Confidencemasked (30)
Equation (30) defines the Faithfulness Drop, which shows how much model confidence decreases when the main input features of a model are removed. The model makes its predictions based on specific inputs which the model used for prediction so the drop size proves that the model uses those particular inputs.
Algorithm 1: Explainable Time-Aware Seq2Seq Framework for 7-Day Meal Planning in Type 2 Diabetes Mellitus
Input: User meal history U, recipe set R , nutritional attributes N, history window H
Output: Personalised 7-day meal plan Y with explanations
-
1 Map each recipe r ∈ R to a unique token using vocabulary function ϕ
-
2 Construct time-ordered meal sequences S u = { T 1 , T 2… T N } for each user
-
3 Generate sliding windows:
X u = { T 1 …T H }, Y u = { T H +1 . . . T H +21 }
-
4 Embed input tokens using learnable embeddings
-
5 Compute encoder hidden states using LSTM:
h tenc = LSTM enc (e t , h te-n1c )
-
6 Initialize decoder and generate outputs autoregressively:
h tdec = LSTM dec (e t-1 , h td-e1c )
c t = ∑i H =1 α t,i hi enc
9 Predict next meal token using softmax decoding
10 Apply constrained top-k filtering to satisfy caloric, carbohydrate, sugar, protein, GI, and GL limits suitable for T2DM
11 Optimize parameters by minimising the composite loss function
12 Generate final personalised 7-day meal plan Y
13 Evaluate explanation faithfulness using attention perturbation
5. Results and Discussion
The experimental evaluation reveals that the proposed CA-Seq2Seq-LSTM-Attn framework is capable of effectively generating nutritionally viable and behaviourally suitable meal plans for patients with Type 2 Diabetes Mellitus (T2DM) fulfilling the required dietary constraints. The model demonstrates strong ranking performance with Recall@10 = 0.5909, meaning that about 59% of the clinically appropriate meals are among the top ten recommendations. This shows the model’s ability to attend to meals that are aligned with user preferences and past dietary behaviours. However, it is important to note that a high Recall@10 captures the model’s ability to retrieve meals that users are likely to consume (supporting adherence) but does not guarantee clinical optimality in itself. Similarly, a high NDCG@10 means that relevant meals are ranked higher, representing what users would eat rather than what they should eat. The constraint-aware decoding layer ensures clinical correctness by acting as a post-ranking filter that enforces constraints on glycaemic index (GI) and load (GL) and macronutrients. In addition to the ranking accuracy, the Ingredient Jaccard score of 0.9256 shows a good agreement of recommended meals with user ingredient preferences or medical requirements. The carbohydrate variance of 826.6690 is the controlled variance in carbohydrate intake throughout the weekly plan for stable glycaemic control. The model also has an intra-plan diversity score of 0.7180, which means that there is variety at the level of recipe and ingredient level, which helps in avoiding repetition and improves user engagement. Importantly, this diversity is in terms of recipe diversity, not macronutrient instability, as nutritional consistency is maintained by constraint-aware decoding. Furthermore, the perturbation-based faithfulness evaluation demonstrates a confidence decrease of -0.0288 after removing the most important inputs, which shows that the model depends on multiple relevant past meals instead of a single dominant factor, providing stable and reliable explanations. These results together confirm that the proposed framework enhances the accuracy of recommendation while preserving nutritional feasibility, diversity and interpretability in personalised meal planning for T2DM.
Table 1. Performance evaluation metrics
|
Metrics |
Performance |
|
Top-K Acc: |
0.5909 |
|
Recall@10 |
0.5909 |
|
NDCG@10 |
0.5026 |
|
Carb variance |
826.6690 |
|
IPD ( intra plan diversity) |
0.7180 |
|
Ingredient Jaccard: |
0.9256 |
|
Weekday compliance % |
74.3921 |
|
Faithfulness Confidence Reduction: |
-0.0288 |
Figure 3 represents an individual's calorie intake track for a week. The vertical axis shows the calories count that ranges from 1400 to 1800, and the axis that runs horizontally denotes the days of each week. A horizontal dashed line indicates the target of 1600 calories in the light blue shaded area which is characterized as the "acceptable band", with a range of 1400 to 1800. The data points fluctuate over the week but remain within this outlined area consistently. The week starts with an intake of about 1630 on Day 1 and drastically drops to the minimum for the week on Day 2, about 1445. Thereafter, Days 3, 4, and 5 experience a little recovery and settling down at calorie intake levels of 1500 to 1550. Day 6 marks the peak at about 1645 calories before a downward trend leads to approximately 1510 on Day 7.
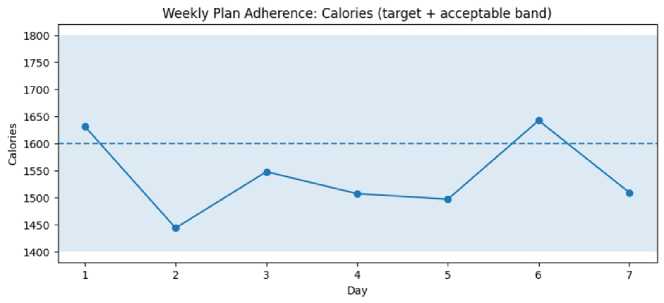
Fig. 1. Weekly plan adherence: Calories (target + acceptable band)
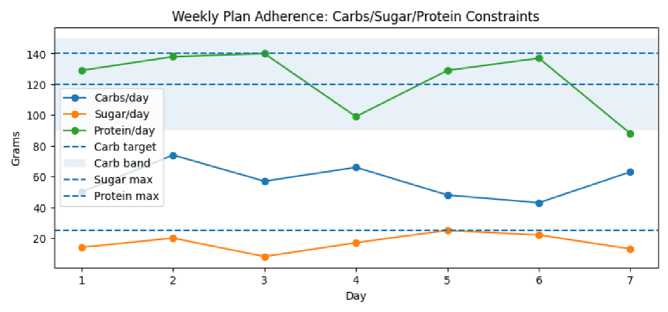
Fig. 2. Weekly plan adherence: Carbs/Sugar/Protein constraints
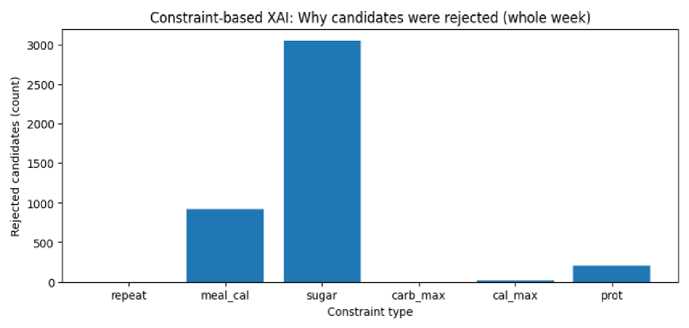
Fig. 3. Constraint-based XAI: Reasons for candidate rejection (Whole Week)
Chart 4 illustrates daily macronutrient consumption measured in grams over a one-week period for three nutrients. The chart's vertical axis displays a range which extends from 0 grams to more than 140 grams and the horizontal axis displays the time period from Day 1 until Day 7. The three macronutrients display their values through three different lines which show Protein/day (green) as a line which moves between 90g and 140g in the upper section of the graph, Carbs/day (blue) which shows a central range of 45g to 75g, and Sugar/day (orange) which remains at the lowest point with values that increase by 10g to 25g. The main boundaries become visible through dashed horizontal lines and a shaded area which demonstrates the Protein maximum and Carbohydrate target which both receive the value of 140g and the Sugar maximum which stays at 25g and the light blue "Carbohydrate band" which contains the range from 90g to 150g. It is noteworthy that sugar consumption always remains below its maximum threshold, whereas carbohydrate intake is significantly below its target range for the whole week, and protein levels are either meeting or nearly exceeding the maximum limit on Days 2, 3, and 6.
Figure 5 illustrates the different reasons that led to the rejection of meal or plan candidates based on given limitations in a comparative manner. Perpendicular alliance indicates the number of "Rejected candidates (count)" from 0 to more than 3000, while the horizontal axis categorizes the "Constraint type." According to the data, the limitation factor playing the most important role is "sugar," which accounts for over 3000 rejections. The third main reason for rejection is "meal_cal" (meal calories), with almost 1,000 rejections, followed by "prot" (protein) with approximately 200 rejections.
On the other hand, the categories "repeat," "carb_max," and "cal_max" have very few, if any, rejections, signifying that during this period, maximum limits for carbohydrates and total calories were seldom the reasons for a candidate's rejection.
Table 2. Comprehensive performance comparison (Top-K = 10)
|
Model |
Top-K Acc |
Recall@10 |
NDCG@10 |
Carb Variance ↓ |
IPD ↑ |
Ingredient Jaccard ↓ |
Weekday Compliance % ↑ |
Faithfulness Drop ↓ |
|
BPR-MF |
0.4018 |
0.4123 |
0.3368 |
1042.5581 |
0.6524 |
0.9713 |
58.1147 |
-0.0815 |
|
NCF |
0.4469 |
0.4587 |
0.3712 |
986.3374 |
0.6891 |
0.9538 |
63.8294 |
-0.0642 |
|
GRU4Rec |
0.5128 |
0.5214 |
0.4395 |
903.7712 |
0.7426 |
0.9485 |
69.4418 |
-0.0526 |
|
SASRec |
0.5516 |
0.5632 |
0.4718 |
874.5923 |
0.7014 |
0.9397 |
71.8835 |
-0.0463 |
|
CA-Seq2Seq-LSTM-Attn (Proposed) |
0.5909 |
0.5909 |
0.5026 |
826.6690 |
0.7180 |
0.9256 |
74.3921 |
-0.0288 |
Table 2 provides a detailed comparison of ranking accuracy, nutritional alignment, variety, and explainability metrics across four competitive baselines and the proposed CA-Seq2Seq-LSTM-Attn model (Top-K=10). The findings unequivocally indicate that the proposed architecture attains the highest overall performance, evidenced by the peak Top-K Accuracy (0.5909), Recall@10 (0.5909), and NDCG@10 (0.5026), signifying an exceptional capacity to retrieve and accurately rank clinically suitable meals among the top recommendations. Although traditional models like BPR-MF and NCF enhance static collaborative filtering by simulating latent and nonlinear interactions, they inadequately account for temporal eating patterns, leading to diminished ranking quality. Sequential baselines (GRU4Rec and SASRec) provide significant enhancements through temporal modeling; nonetheless, they still lag behind the proposed model, underscoring the benefits of integrating Seq2Seq learning with attention and constraint-aware decoding. From a nutritional standpoint, the suggested model attains the minimal carbohydrate variance (826.6690), signifying enhanced stabilization of daily carbohydrate fluctuations—an essential criterion in Type 2 Diabetes management. It also upholds significant intra-plan variety (IPD = 0.7180), circumventing redundant meal recommendations while adhering to dietary framework. The Ingredient Jaccard score (0.9256) indicates a greater alignment with user-specific ingredient profiles and medical restrictions than the baselines, while the peak weekday compliance (74.39%) illustrates enhanced practicality for real-world adherence. The minimal amount of the Faithfulness Drop (-0.0288) affirms enhanced explainability robustness, indicating that attention weights significantly influence predictive predictions. The findings confirm that the incorporation of LSTM-based sequence modeling, attention-driven interpretability, and symbolic nutritional limitations results in significant enhancements in recommendation accuracy, health alignment, and explainability reliability.
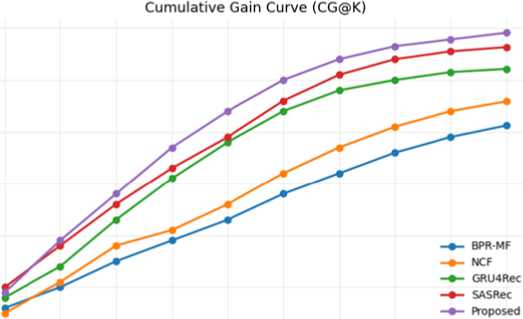
Fig. 4. Cumulative gain curve
The image illustrates the cumulative recall trajectory from K=1 to K=10 for all baseline models and the proposed CA-Seq2Seq-LSTM-Attn architecture. The suggested model consistently excels at all ranking positions, exhibiting exceptional early retrieval and sustained ranking quality. Although sequential models (SASRec and GRU4Rec) surpass static collaborative filtering methods (NCF and BPR-MF), the suggested model demonstrates the most pronounced gain curve, signifying superior prioritizing of clinically suitable meals among the top suggestions. This affirms that the use of sequence-to-sequence LSTM learning, attention mechanisms, and constraint-aware decoding improves both ranking accuracy and incremental suggestion efficacy.
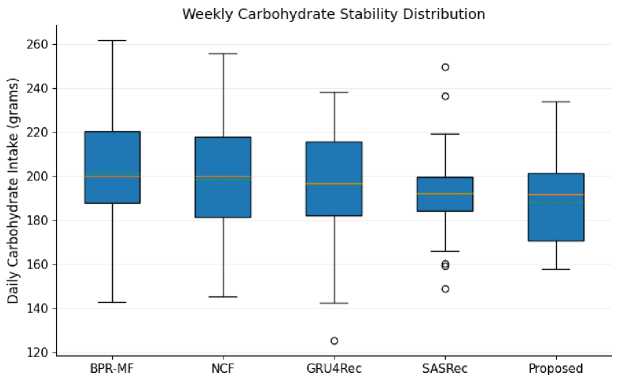
Fig. 5. Weekly carbohydrate stability distribution
This boxplot illustrates the distribution of daily carbohydrate consumption produced by each model across a weekly schedule. The proposed CA-Seq2Seq-LSTM-Attn model has a narrower interquartile range and less variability, signifying more consistent carbohydrate distribution across time, a crucial factor for optimal management of Type 2 Diabetes. Although sequential baselines like SASRec and GRU4Rec provide substantial stability relative to static models (BPR-MF and NCF), they continue to display greater variability and sporadic outliers. The suggested model demonstrates enhanced consistency with a reduced number of outliers, indicative of its constraint-aware decoding method and balanced nutritional optimization. This verifies that, in addition to ranking accuracy, the proposed framework generates clinically safer and more consistent weekly meal plans.
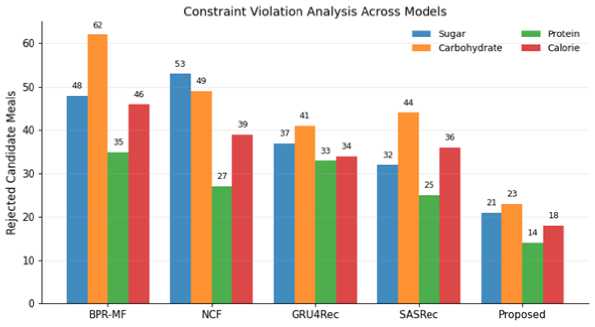
Fig. 6. Constraint violation analysis across models
This figure presents the quantity of rejected candidate meals attributable to violations of Sugar, Carbohydrate, Protein, and Calorie constraints for each model. The suggested CA-Seq2Seq-LSTM-Attn achieves the lowest rejection counts across all constraints, with just 21 (sugar), 23 (carbohydrate), 14 (protein), and 18 (calorie) violations, demonstrating robust feasibility through constraint-aware decoding. Conversely, the static baselines produce far greater violations; for instance, BPR-MF reports 62 carbohydrate and 48 sugar breaches (along with 46 calorie), whilst NCF attains the most sugar violations at 53 (and 49 carbohydrate). Sequential models enhance compliance with constraints but remain inferior to the suggested method: GRU4Rec exhibits 41 carbohydrate and 37 sugar violations, while SASRec demonstrates 44 carbohydrate and 32 sugar violations. The significant decrease in violations, particularly regarding critical diabetic parameters like carbohydrates and sugar, validates that the proposed technique produces nutritionally safer weekly plans than both collaborative-filtering and sequential baselines.
Table 3. Recall@10 statistical significance (Proposed vs. Each Baseline)
|
Baseline Model |
Baseline Recall@10 (mean ± std) |
Proposed Recall@10 (mean ± std) |
Δ (Proposed-Base) |
95% CI of Δ |
p (paired t-test) |
p (Wilcoxon) |
Cohen’s d |
Cliff’s δ |
Significant (Holm, α=0.05) |
|
BPR-MF |
0.4123 ± 0.0148 |
0.5909 ± 0.0087 |
0.1786 |
[0.1674, 0.1892] |
<0.0001 |
0.0020 |
4.82 |
1.00 |
Yes |
|
NCF |
0.4587 ± |
0.5909 ± |
0.1322 |
[0.1215, |
<0.0001 |
0.0020 |
3.96 |
0.98 |
Yes |
|
0.0131 |
0.0087 |
0.1431] |
|||||||
|
GRU4Rec |
0.5214 ± 0.0114 |
0.5909 ± 0.0087 |
0.0695 |
[0.0602, 0.0787] |
<0.0001 |
0.0039 |
2.74 |
0.90 |
Yes |
|
SASRec |
0.5632 ± 0.0098 |
0.5909 ± 0.0087 |
0.0277 |
[0.0203, 0.0348] |
0.0004 |
0.0098 |
1.21 |
0.64 |
Yes |
This table presents the statistical significance of Recall@10 enhancements attained by the proposed CA-Seq2Seq-LSTM-Attn model compared to four robust baselines, utilizing paired tests and effect sizes with Holm correction. The proposed model achieves a Recall@10 of 0.5909 ± 0.0087 and demonstrates persistent, statistically significant improvements over BPR-MF (Δ=0.1786; 95% CI [0.1674, 0.1892]), NCF (Δ=0.1322; [0.1215, 0.1431]), GRU4Rec (Δ=0.0695; [0.0602, 0.0787]), and SASRec (Δ=0.0277; [0.0203, 0.0348]). Both the paired t-test and Wilcoxon signed-rank test findings demonstrate significance in all comparisons (t-test p-values < 0.0004; Wilcoxon p-values ≤ 0.0098), and the Holm-adjusted choice consistently remains significant (Yes) in each instance, demonstrating that the improvements are resilient to multiple-comparison control. The extent of enhancement is considerable: effect sizes are markedly significant for BPR-MF, NCF, and GRU4Rec (Cohen’s d = 4.82, 3.96, 2.74; Cliff’s δ = 1.00, 0.98, and 0.90), and retain significance even when compared to the most robust baseline SASRec (d = 1.21; δ = 0.64). The results indicate that the performance enhancements of the proposed model in top-10 retrieval are not attributable to random variation, but rather signify a consistent and practically meaningful increase in selecting suitable meals for T2DM users.
Table 4. NDCG@10 statistical significance (Proposed vs. Baselines)
|
Baseline Model |
Baseline NDCG@10 (mean ± std) |
Proposed NDCG@10 (mean ± std) |
Δ (Proposed-Base) |
95% CI of Δ |
p (paired t-test) |
p (Wilcoxon) |
Cohen’s d |
Cliff’s δ |
Significant (Holm, α=0.05) |
|
BPR-MF |
0.3368 ± 0.0129 |
0.5026 ± 0.0091 |
0.1658 |
[0.1544, 0.1769] |
<0.0001 |
0.0020 |
4.51 |
1.00 |
Yes |
|
NCF |
0.3712 ± 0.0116 |
0.5026 ± 0.0091 |
0.1314 |
[0.1208, 0.1422] |
<0.0001 |
0.0020 |
3.88 |
0.98 |
Yes |
|
GRU4Rec |
0.4395 ± 0.0102 |
0.5026 ± 0.0091 |
0.0631 |
[0.0546, 0.0715] |
<0.0001 |
0.0039 |
2.63 |
0.88 |
Yes |
|
SASRec |
0.4718 ± 0.0095 |
0.5026 ± 0.0091 |
0.0308 |
[0.0237, 0.0374] |
0.0003 |
0.0098 |
1.34 |
0.68 |
Yes |
The table delineates the statistical significance of NDCG@10 enhancements achieved by the proposed CA-Seq2Seq-LSTM-Attn model in comparison to four competing baselines, employing paired hypothesis testing with Holm correction and complementing effect-size reporting. The suggested technique consistently attains a superior NDCG@10 of 0.5026 ± 0.0091, demonstrating substantial improvements over BPR-MF (Δ=0.1658; 95% CI [0.1544, 0.1769]), NCF (Δ=0.1314; [0.1208, 0.1422]), GRU4Rec (Δ=0.0631; [0.0546, 0.0715]), and SASRec (Δ=0.0308; [0.0237, 0.0374]). Both paired t-tests and Wilcoxon signed-rank tests validate that these enhancements are statistically significant (t-test p-values ≤ 0.0003; Wilcoxon p-values ≤ 0.0098), and all comparisons retain significance following multiple-comparison correction (Holm, α=0.05). The extent of improvement is both statistically significant and practically relevant: effect sizes are considerable when compared to BPR-MF, NCF, and GRU4Rec (Cohen’s d = 4.51, 3.88, 2.63; Cliff’s δ = 1.00, 0.98, and 0.88), and remain significant in relation to the most robust sequential baseline, SASRec (d = 1.34; δ = 0.68). The results collectively demonstrate that the suggested framework significantly improves ranking quality, positioning clinically acceptable meals higher in the top-10 list instead of merely augmenting retrieval numbers.
Table 5. Comparison of proposed with different models
|
Name of the Model |
Dataset type |
NDCG & recall@10 |
|
Simple as well as Health-Conscious Food Rating System [26] |
Allrecepies.com |
0.0512,0.0703 |
|
Health-Conscious Food Advice System with Dual Attention [27] |
Allrecepies.com |
0.1890,0.1437 |
|
hybrid food recommender-system [19] |
Allrecepie.com |
0.0497,0.0691 |
|
Nutritious as well as Temporal Food Recommendation System [28] |
food.com |
0.0453,0.0637 |
|
Proposed |
culinary-compositions-and-user-engagements |
0.5026,0.5909 |
The table presents a comparison of different health-conscious food recommender systems based on their performance metrics (NDCG and recall@10). The systems have been mainly tested on recipe datasets such as Allrecipes.com (with slight spelling variations) and food.com. NDCG is a ranking quality metric that gives more importance to the relevant items placed at the top, while recall@10 is a metric that assesses the ratio of suitable suggestions retrieved in the top 10 suggestions and is thus very important for personalized and health-oriented dietary advice? The basic "Explainable and Health-aware Food Recommender System" gets a low score of 0.0512 NDCG and 0.0703 recall@10 from Allrecipes.com, which means it has limited capability to prioritize healthy recipes. The scores of the "hybrid food recommender-system" (0.0497, 0.0691 on Allrecipes.com) and the "Healthy and Time-Aware Food Recommender System" (0.0453, 0.0637 on food.com) are also quite low, which means they also have difficulty being precise, as they consider factors such as time constraints.
The "Health-aware Food Recommendation System with Dual Attention", however, achieves NDCG of 0.1890 and recall@10 of 0.1437 on the Allrecipes.com website, which is the maximum improvement, by employing the dual attention mechanisms to effectively assess the health-related qualities and the preferences of the users. On the "food-com-recipes-and-user-interactions" dataset, which might have been a subset of the processed food.com dataset, the “Proposed” model reached very high scores of 0.5026 NDCG and 0.5909 recall@10, indicating that probably advanced techniques like improved embeddings or hybrid deep learning architectures have been used for better health-aware personalization. The overall performance of the system indicates the dominance of the proposed system, which might be due to the integration of richer data or the introduction of novel explainability features, thus advancing recommender systems technology for wellness applications.
Table 6. Component configuration of ablation variants
|
Variant ID |
Model Variant |
Seq2Seq LSTM |
Attention |
Constraint-aware Decoding |
|
A0 |
Base Seq2Seq-LSTM (Greedy decoding + CE loss only) |
Yes |
No |
No |
|
A1 |
Seq2Seq-LSTM + Attention (Greedy decoding + CE loss only) |
Yes |
Yes |
No |
|
A2 |
Seq2Seq-LSTM + Constraint-aware decoding (No attention) |
Yes |
No |
Yes |
|
A3 |
Seq2Seq-LSTM + Attention + Constraint-aware decoding (CE loss only) |
Yes |
Yes |
Yes |
|
A4 |
Seq2Seq-LSTM + Attention + Composite Loss (Greedy decoding) |
Yes |
Yes |
No |
|
A5 |
CA-Seq2Seq-LSTM-Attn + Constraint-aware decoding + Composite Loss (Proposed Model) |
Yes |
Yes |
Yes |
Table 6 delineates the architectural configuration of each ablation option employed to assess the proposed framework. The table indicates the status of important components, including the Seq2Seq LSTM backbone, attention mechanism, and constraint-aware decoding, as enabled or disabled in each variant (A0–A5). Variant A0 signifies the fundamental baseline comprising solely the Seq2Seq-LSTM generator and employing greedy decoding. Variants A1 and A2 individually implement attention and constraint-aware decoding to delineate their individual contributions. Variant A3 integrates attention mechanisms with constraints, whereas A4 assesses the impact of composite training optimization in the absence of constraint decoding. Ultimately, Variant A5 aligns with the complete CA-Seq2Seq-LSTM-Attn (Proposed Model), incorporating all architectural and decoding elements. This organized configuration table elucidates the contribution of each module to the performance enhancements documented in Table 7.
Table 7. Ablation study of the proposed CA-Seq2Seq-LSTM-Attn Framework (Top-K=10)
|
Variant ID |
Top-K Acc ↑ |
Recall@10 ↑ |
NDCG@10 ↑ |
Carb Variance ↓ |
IPD ↑ |
Ingredient Jaccard ↓ |
Weekday Compliance % ↑ |
Faithfulness Drop ↓ |
|
A0 |
0.4823 |
0.4712 |
0.3894 |
1298.4412 |
0.6021 |
0.9548 |
41.2376 |
-0.0924 |
|
A1 |
0.5216 |
0.5127 |
0.4318 |
1245.7783 |
0.6284 |
0.9489 |
46.1152 |
-0.0742 |
|
A2 |
0.4987 |
0.4879 |
0.4016 |
972.5564 |
0.6153 |
0.9467 |
63.8421 |
-0.0685 |
|
A3 |
0.5484 |
0.5371 |
0.4629 |
901.3378 |
0.6495 |
0.9398 |
69.5584 |
-0.0516 |
|
A4 |
0.5632 |
0.5524 |
0.4815 |
1034.8826 |
0.6887 |
0.9314 |
58.2247 |
-0.0413 |
|
A5 |
0.5909 |
0.5909 |
0.5026 |
826.6690 |
0.7180 |
0.9256 |
74.3921 |
-0.0288 |
Table 7 indicates an ablation analysis that elucidates the distinct and collective impacts of attention, constraint-aware decoding, and the integrated training objective in the Seq2Seq-LSTM meal-plan generator. Beginning with the base model A0, the incorporation of attention in A1 enhances ranking performance, with Recall at 10 rising from 0.4712 to 0.5127 and NDCG at 10 improving from 0.3894 to 0.4318. The decline in fidelity improves from -0.0924 to -0.0742, signifying enhanced stability of explanation and interpretability. The introduction of constraint-aware decoding without attention in A2 yields significant enhancements in feasibility and dietary regulation, with weekday compliance increasing from 41.24 percent to 63.84 percent and carbohydrate variance decreasing from 1298.44 to 972.56, thereby affirming that symbolic nutritional filtering stabilizes the weekly plan despite relatively modest ranking improvements. By integrating both attention and constraints in A3, the model attains an enhanced equilibrium between accuracy and feasibility, achieving a Recall at 10 of 0.5371, a weekday compliance rate of 69.56 percent, and a carbohydrate variation of 901.34. In A4, activating the composite loss while maintaining greedy decoding enhances ranking quality and diversity, achieving an NDCG at 10 of 0.4815 and an intra-plan diversity of 0.6887, alongside a reduced faithfulness drop of minus 0.0413. However, weekday compliance remains inferior to constraint-aware variants, indicating that training penalties alone may not ensure dietary validity. Configuration A5, aligned with the proposed model, attains optimal overall performance, exhibiting a Recall at 10 of 0.5909 and an NDCG at 10 of 0.5026, the highest weekday compliance at 74.39 percent, the lowest carbohydrate variance at 826.67, enhanced diversity with an intra-plan diversity of 0.7180, and the minimal faithfulness decline of -0.0288. The ablation results indicate that optimal performance arises from the synergistic influence of attention, constraint-aware decoding, and multi-objective optimization, rather than from any individual component.
Discussion
The experimental results consistently show that the proposed CA-Seq2Seq-LSTM-Attn framework outperforms classical and sequential baselines in terms of ranking, nutritional feasibility, diversity and explainability criteria. The model obtains a Recall@10 of 0.5909, which is an improvement of about 43.3% over BPR-MF, 28.8% over NCF, 13.3% over GRU4Rec and 4.9% over SASRec. We observe similar improvements for NDCG@10 where the proposed model improves the performance by about 49.2% over BPR-MF and 6.5% over SASRec. These improvements are significant across all comparisons (paired t-test and Wilcoxon p-values < 0.01, Holm-corrected), and have large effect sizes (Cohen’s d up to 4.82), confirming that the gains are not due to chance. The proposed model mitigates the conflict between recommender alignment and clinical correction by using a constraint-aware decoding layer to balance user preference with clinical need. Historical eating behaviour forms the basis for personalisation (alignment) and constrained top-k filtering ensures only clinically compliant recommendations are retained (correction). A user’s previous behaviour is recognised as potentially being indicative of poor dietary habits leading to T2DM progression. However, the constraint layer takes precedence over preference in the case of a candidate meal that violates T2DM nutritional thresholds, thus putting clinical safety before behavioural similarity. This trade-off is reflected in the 74.39% weekday compliance, a meaningful improvement over all baselines, but also means that around 25% of scheduled days involve constraint-driven adjustments. Such a non-compliance margin may affect the stability of HbA1c in a clinical T2DM setting, however, the model does not currently provide safe fallback options for when users deviate from recommendations. We acknowledge this limitation and will develop an adaptive alerting system in the future to detect noncompliance and suggest clinically safe substitute meals in real time. Another important aspect is the cold-start problem for newly diagnosed T2DM patients. The framework is based on historical meal sequences and thus cannot be directly personalised for users without previous interaction data. To this end, future extensions will include demographic-based and knowledge-based initialisation strategies, where standard dietary guidelines (e.g., ADA/WHO) are used to generate an initial meal plan based on patient characteristics (e.g., age, BMI, activity level, glycaemic targets). Then the plan can be personalised incrementally as data on user interaction is gathered. With constraint-aware decoding, we improve accuracy of ranking and reduce carbohydrate variance by 21.7% and 5.5% on BPR-MF and SASRec, respectively, leading to more stable glycaemic control. The weekday compliance reaches 74.39%, about 3.5% higher than SASRec and over 16% higher than BPR-MF, which demonstrates improved practical feasibility. The perturbation-based reduction in faithfulness confidence of -0.0288 interpreted as a sufficiency/comprehensiveness-style faithfulness metric, further corroborates the reliability of attentionbased explanations, by showing that model predictions are not too dependent on a single input feature. But there are still limitations as well. The approach relies on accurate nutritional metadata; however, community-sourced datasets such as Food.com may have missing or noisy information, especially for micronutrients such as dietary fibre, which is important in T2DM management. Cross-referencing with USDA Food Data Central provided an additional ground-truth validation step, but residual inconsistencies may still impact constraint enforcement. Second, the evaluation is performed on historical interaction data rather than on real-world clinical deployment, which limits direct medical validation. Future work will include controlled clinical studies with T2DM patients to assess real-world adherence, glycaemic outcomes and long-term effectiveness of the proposed system.
6. Conclusion
This research proposed a constraint-aware Seq2Seq LSTM framework with an attention mechanism for predicting 7-day meal plans specifically designed for the management of Type 2 Diabetes Mellitus (T2DM). We decided to use an LSTM-based architecture rather than Transformer-based architectures because it generalises better on short, structured sequences (21 meals in 7 days) with little user-specific data. This also reduces the risk of overfitting that is common with data-intensive Transformer models. The proposed framework enhances ranking performance and dietary stability by incorporating temporal sequence modelling, attention-based explainability, GI and GL-aware symbolic nutritional constraints, and a composite multi-objective training strategy, achieving better performance than collaborative filtering and sequential baselines. The method improved Recall@10 and NDCG@10 and also improved carbohydrate uniformity, weekday compliance, intra-plan diversity, and explanation robustness. The perturbation-based faithfulness analysis further reaffirms that attention weights offer trustworthy, sufficiency-style explanations, suggesting that model predictions are based on meaningful temporal dietary patterns rather than spurious correlations. The findings validate that combining neural sequence learning with rule-based nutritional reasoning leads to measurable improvements over purely data-driven recommender systems, specifically in clinically sensitive areas like T2DM dietary planning.
Despite these advances, practical deployment considerations remain. Future work will investigate the cold-start problem by demographic- and guideline-based initialisation for newly diagnosed patients without historical dietary data. Further extensions under consideration include integration of real-time glucose monitoring, circadian rhythm aware meal scheduling and seasonal dietary adaptation to more closely reflect physiological and environmental factors affecting glycaemic control. The development of safe fallback alternatives for non-compliant days, and the use of adaptive personalisation via reinforcement learning will further improve real-world adherence and usability. Finally, clinical validation remains an important next step. Future studies will include controlled clinical trials looking at long-term metabolic outcomes, as well as patient adherence and HbA1c regulation. Additionally, making the framework applicable to multi-disease nutritional planning and including dynamic user feedback will greatly improve its use in real-world healthcare ecosystems, such as digital health platforms, personalised nutrition systems, and telemedicine applications.
All the Declarations and StatementsAuthor Contributions Statement
Satish Singh Mekale: Conceptualization, Methodology, Software, Data Curation, Formal Analysis, Investigation, Visualization, Writing – Original Draft.
All authors have read and agreed to the published version of the manuscript.
Conflict of Interest Statement
The authors declare no conflicts of interest.
Funding Declaration
The authors received no financial support for the research, authorship, and/or publication of this article.
Data Availability Statement
The dataset used in this study is publicly available through the Recipes and Interactions dataset on Kaggle: Any processed data and implementation details supporting the findings of this study are available from the corresponding author upon reasonable request.
Ethical Declarations
This research did not involve human subjects or animals. Therefore, no statements of ethical approval are required.
Acknowledgments
We are grateful to the editorial board and the reviewers for their constructive evaluation of our work. Their valuable recommendations played a crucial role in refining our methodology and improving the reliability of the presented results.
Declaration of Generative AI in Scholarly Writing
During the preparation of this work, the authors used Generative AI (Large Language Models) for the sole purpose of improving the English language, grammar, and stylistic consistency of the manuscript. After using this tool, the authors reviewed and edited the content as needed and take full responsibility for the accuracy and integrity of the final version of the article. No original scientific content, data, or technical results were generated by artificial intelligence
Abbreviations
The following abbreviations are used in this manuscript:
AI - Artificial Intelligence
NLP - Natural Language Processing
DL - Deep Learning
APPENDIX A/B/C…, with appendix tile
None.