Exploring Feature Selection and Machine Learning Algorithms for Predicting Diabetes Disease

Author: Eman I. Abd El-Latif, Islam A. Moneim
Journal: International Journal of Intelligent Systems and Applications @ijisa
Article in issue: 1 vol.16, 2024.
Free access
One of the most common diseases in the world is the chronic diabetes. Diabetes has a direct impact on the lives of millions of people worldwide. Diabetes can be controlled and improved with early diagnosis, but the majority of patients continue to live with it. There is a dispirit need to a system to anticipate and select the people who are most likely to be diabetes in the future. Diagnosing the future diseased person without taking any blood or glucose screening tests, is the main goal of this study. This paper proposed a deep-learning model for diabetes disease prediction. The proposed model consists of three main phases, data pre-processing, feature selection and finally different classifiers. Initially, during the data pre-processing stage, missing values are handled, and data normalization is applied to the data. Then, three techniques are used to select the most important features which are mutual information, chi-squared and Pearson correlation. After that, multiple machine learning classifiers are used. Four experiments are then conducted to test our models. Additionally, the effectiveness of the proposed model is evaluated against that of other well-known machine learning techniques. The accuracy, AUC, sensitivity, and F-measure of the linear regression classifier are higher than those of the other methods, according to experimental data, which show that it performs better. The suggested model worked better than traditional methods and had a high accuracy rate for predicting diabetic disease.
Diabetes, Mutual Information, Pearson Correlation and Chi-squared
Short address: https://sciup.org/15019352
IDR: 15019352 | DOI: 10.5815/ijisa.2024.01.01
Text of the scientific article Exploring Feature Selection and Machine Learning Algorithms for Predicting Diabetes Disease
Published Online on February 8, 2024 by MECS Press
Diabetes is a prevalent chronic disease that is extremely harmful to human health [1]. The diabetes characteristic is that blood glucose levels are higher than normal, which results from impaired insulin secretion or its adverse biological effects, or both [2, 3]. There are two types of diabetes [4], the majority of diabetes populations are classified first type and most of them are younger than 30 years old. The signs of the diabetes of the first type are: expanded thirst, successive pee and high blood glucose levels. Obesity, hypertension and other diseases are frequently associated with type 2 diabetes, which is more prevalent in the elderly and middle-aged people [5]
A tenth of the adults in the future will have diabetes, as predicted by rising morbidity in recent years, when the number of diabetics worldwide will reach 642 million in 2040. Diabetes may have existed for four to twelve years prior to diagnosis. Half of patients with diabetes suffer damage after being diagnosed. Scientists demonstrate that early recognition of diabetes will avoid heart diseases, stroke and vascular complications. Machine learning can assist individuals to make a preliminary diagnosis about diabetes according to their daily physical examination data [6, 7].
The data and analysis are used to develop predictive models, for a variety of issues, is the primary focus of machine learning. Predicting diabetes with machine learning techniques is common and using feature selection enhances the accuracy and yields better results compared to using all features.
A lot of researchers have been applying machine learning concepts to predict a disease known as diabetic in recent years. Diabetes diagnosis and prediction are made possible through machine learning. It involves analyzing large datasets, finding patterns, and using statistical models and algorithms to create predictions based on these patterns. In order to estimate an individual's risk of developing diabetes, machine learning may assess medical data related to the condition, including blood glucose levels, blood pressure, and body mass index. It can provide more accurate forecasts than more conventional techniques. Machine learning algorithms have the ability to analyses enormous amounts of data and notice subtle patterns in it. People may therefore have improved outcomes from their diabetes diagnosis and treatment. When compared to previous approaches, machine learning has become more significant in the health sector since it is quick and simple to utilize.
This paper proposed a model for accurate diabetes diagnosis prediction. The proposed model consists of three main phases: data pre-processing step, feature selection using three algorithms, and evaluation phase using different metrics. The main contribution of the paper can be listed as follows:
• Data Pre-processing: The proposed model solved the missing values problem and data normalization is employed to normalize the variety and distribution of features.
• Feature Selection stage: mutual information, chi-squared and Pearson correlation are performed to select the most important features
• Classification Stage: Decision tree, random forest, k nearest neighbor and logistic regression are applied to diagnose the person
• Evaluation and Results Interpretation Phase: Different evaluation metrics are adopted for explaining the prediction result of the proposed model.
• Highly Accurate Prediction: Several experiments were conducted to evaluate the overall performance of the proposed model.
2. Related Works
The remainder of this paper is organized as follows. The earlier studies on the subject are presented in Section 2. A thorough analysis and explanation of the data utilized in this investigation are provided in Section 3. In Section 4, the suggested method is then presented. The evaluation of the experiment's findings is done in Section 6. In Section 7, the study is finally finished.
Several studies using machine learning or traditional algorithms to predict or detect diabetes are discussed in this section as shown in Table 1.
Kavakiotis et al. [8] have used a variety of machine learning methods, including SVM, DT, KNN, RF, LR, and Gradient Boosting. In [9], Principal component analysis and neurofuzzy inference are used to differentiate diabetic's people from the normal. In to predict type 2 diabetes, Yue et al [10] are used Quantum particle swarm optimization (QPSO) and weighted least squares support vector machine (WLS-SVM) but for type two diabetes, Razavian et al. [11] developed a strategy based on RF.
In [12], Duygu et al. used Linear Discriminant Analysis to extract and reduce the features and MWSVM for classification but in [13], Georga et al. used support vector regression (SVR). To increase the accuracy, Ozcift et al. [14] offered an algorithm called rotation forest merges 30 machine learning algorithm.
In [15], Quan et al. selected healthy and diabetic data at random for training set and then apply five cross validations. PCA and minimum redundancy maximum relevance are utilized to reduce the dimensionality. For the classification, DT, RF and neural network are applied to predict the diabetes. In [16], scientists used four classifiers: naive Bayes (NB), decision tree (DT), Adaboost (AB), and random forest (RF) to predict the diabetic patients. (K2, K5, and K10) are three different partitioning protocols. To be able to forecast the diabetic disease, authors trained machine learning algorithms like logistic regression, SVM, and ANN [17]. Additionally, three rounds of k-cross validation are carried out.
Table 1. Relevant approaches for predicting diabetes disease
|
Ref. |
Methodology |
Dataset |
Performance metrics |
|
[16] |
NB, DT, Adaboost (AB), RF |
there was a total of 6561 features with 657 diabetic and 5904 non diabetic. |
The classification accuracy of the RF classifier is 94.25%, while the classification accuracy of the NB classifier is 86.70%. |
|
[17] |
support vector machine, and artificial neural network |
175 features with 50 percent diabetes patients and 50 percent in good health. |
ACC = 84.09 |
|
[18] |
multifactor dimensionality reduction (MDR) +KNN |
30 522 comorbid patients, 270 172 hospital visitors, of whom 89 858 have diabetes, 58 745 have hypertension, |
ACC = 81.3 |
|
[19] |
fuzzy c-mean, RF, and SVM |
6,500 people made up the entire sample. |
SVM ACC = 0.986 AUC = 0.979 |
SVM, multifactor dimensionality reduction, k-nearest neighbours (k-NN), and LR are the four machine learning methods used in [18]. Five cross validation is used in the study to determine generalization accuracy and error rates. In order to distinguish between people who have diabetes and those who do not, this study evaluated four machinelearning classifiers (neural networks, SVM, fuzzy c-mean, and random forests) with two conventional classification approaches (LR and Fisher linear discriminant analysis) in [19].
3. Dataset
The dataset was collected from over 400,000 Americans on health-related risk performances and chronic health conditions. This dataset contains 253,680 responses and it can download from [20]. Table 2 shows the data description for each medical predictor in the data.
Table 2. Data description
|
Features |
Description |
|
HighBP |
Adults who have received a diagnosis of hypertension from a physician. There are two classes for this feature: 0 for no high pressure and 1 for pressure. |
|
Body mass index (BMI) |
It is a number that is calculated using a person's height and mass. |
|
Stroke |
In a medical condition known as a stroke, the brain's inadequate blood supply results in cell death. |
|
HeartDiseaseorAttack |
people who previously disclosed having myocardial infarction or coronary heart disease |
|
NoDocbcCost |
you needed to see a doctor within the last year but were unable to due to cost |
|
GenHlth |
general health on a scale of 1 to 5 |
|
MentHlth |
It describes mental state, which includes stress, depression, and emotional difficulties, is described. |
|
PhysHlth |
It describes the physical health, which also includes bodily ailment and damage during 30 days |
|
DiffWalk |
It describes the difficulty in ascending stairs or moving about. |
|
Income |
Represents annual household income |
|
HighCol |
A heavy drinker is an adult who consumes more than 14 drinks per week in men and more than 7 drinks in women. |
|
Smoker |
Smoked at least 100 cigarettes during every day of your life. |
|
Education |
highest grade or academic year you have earned |
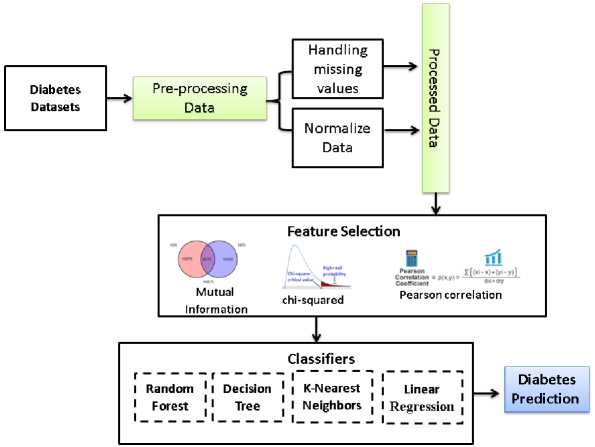
Fig.1. The flowchart of the proposed algorithm
4. Proposed Approach
The main goal of this paper is to predict diabetes disease using various machine learning algorithms without making any medical examination. The intrinsic quality of unprocessed data is enhanced throughout the data preparation stage to enable accurate diabetic disease prediction. First, a mean value imputation approach is employed to address the issue of missing values. In this method, absent data points are replaced with the mean of the pertinent feature. This reduces the likelihood of bias addition caused by missing values while retaining the dataset's overall statistical coherence. The variety and distribution of characteristics are then normalized using data normalization. This normalizing technique ensures that each variable contributes adequately to the learning process of the regression model, regardless of the disparities in their numerical magnitudes. After that, the most important features, which give the highest classification result, by applying three algorithms (mutual information, chi-squared and Pearson correlation) are determined. These selected approaches of machine learning, are decision tree, random forest, k nearest neighbor and logistic regression as shown in Figure 1. On the same dataset, previously multiple machine learning classifiers are used to predict diabetes. Our obtained results are compared with these previous results using the same evaluation metrics.
5. Feature Selection
Feature selection is an essential part of data cleaning because it removes the unwanted features and helps us to identify the most important features, which improves our model's performance. There are numerous methods for choosing features. In this paper, we applied three methods: mutual information, chi-squared and Pearson correlation.
5.1. Mutual Information Algorithm
5.2. Chi-squared Algorithm
6. Classification
For fixed categories, such as the classification problem or the continuous target variable in regression problems, Mutual Information (MI) is measured [21]. Mutual Information calculated the entropy of the variables and measures the degree of dependence between the non-negative variables [22]. The value of MI is zero when the two random variables are independent, and the higher values indicate greater dependence. It can calculate by:
I(X ; Г) = H(X) - Н(Х | Y) (1)
Where X, Y two random variables, I(X; Y) is mutual information, H(X) is the entropy for X and H(X | Y) is the conditional entropy for X given Y.
In feature selection, the connection between two categorical outcome attributes is frequently tested using a Chisquare test. Chi-squared determines if the attributes are independent or not [23]. The observed counts are close to the expected ones when the features are independent so chi-square value needs to be small. Simply, the feature can be selected for model training if its Chi-Square value is higher than 5%, as it likely to be dependent on the response. ChiSquare can calculate using:
x 2 =X(Oi-Ei)2/Ei (2)
Where О is the observed value and E is the expected value
In this section, we discussed the different classifiers that used in this research: decision tree, random forest, k nearest neighbor and logistic regression [24].
6.1. Decision Tree
6.2. Random Forest
6.3. K-Nearest Neighbors Algorithm
7. Experimental Results7.1. Evaluation Metrics
When the response variable is continuous, DT can be used as a regression tree, while when the response variable is categorical, it can be used as a classification tree. DT is used in machine learning to eliminate disorder or uncertainty from the dataset [25]. It starts with a single node representing the root. If all the data are in the same class, the other nodes converted to leafs. Otherwise, the discriminatory attribute is selected by the algorithm to serve as the current DT node. The training data are divided into many subsets, each of which forms a branch, and numerous branches are formed by many values based on the value of the current DT attribute. The previous steps are repeated to form a decision tree [26].
A supervised machine learning approach called random forest (RF) is used to solve classification and regression issues. It builds decision trees from different samples, using the majority vote for classification and the average for regression. RF has many advantages such as it requires less time to train than other algorithms; it runs efficiently with a large dataset and predicts output accurately [27].
The k-nearest neighbor's algorithm, often known as KNN, is a non-parametric, supervised learning classifier that employs proximity to classify or predict the grouping of each individual data point. Assuming that similar points can be discovered close to one another, it can be used for classification or regression issues; however, it is typically utilized as a classification algorithm. [28].
The k-nearest neighbor algorithm's objective is to locate the closest neighbors to the targeted point so that; a class label can be assigned to that point. KNN needs to calculate the distance between the targeted point and the other data points.
In this section, the evaluation metrics and results of the experiments are presented. The PC used for the experiments possesses the following features: x64-based processor, Windows 10, 2.60 GHz 2.59 GHz Intel(R) Core(TM) i7-9750H CPU, 16 GB of memory. We divided the data into 70% for validation and training and 30 % for the testing. The model is performing using the Python programming language
Different metrics are used to measure the performance of the experimental results such as accuracy, precision, F-Measure, Specificity and recall. The metrics are defined as follow:
|
. . TP precision = TP+FP |
(3) |
|
Recall = TPR = -^— TP+FN |
(4) |
|
F1 - Score =--—-- 2TP+FP+FN |
(5) |
|
TP+TN Accuracy = J TP+TN+FN+FP |
(6) |
|
Specificity = TNR = TN TN+FP |
(7) |
Where FP, FN,TP and TN are the False Positive, False Negative, True Positive, and True Negative, respectively.
Another metrics called Area under Curve (AUC) measures the ability of the classifier to separate between classes. The classifier is able to correctly differentiate between all positive and negative class points when AUC is 1. However, the classifier would have predicted that all negatives would be positives and all positives would be negatives if the AUC is equal to zero in value. When the value of the AUC lies between 0.5 and 1, and there is a good chance that the classifier can distinguish between the positive class values and the negative class values.
Table 3. Statistical Description
|
Features |
Mean |
Std |
Min |
Max |
|
HighBP |
0.4290 |
0.4949 |
0 |
1 |
|
BMI |
28.382 |
6.608 |
12 |
98 |
|
Stroke |
0.04057 |
0.19729 |
0 |
1 |
|
HeartDiseaseorAttack |
0.09418 |
0.2920 |
0 |
1 |
|
NoDocbcCost |
0.084177 |
0.2777 |
0 |
1 |
|
GenHlth |
2.5113 |
1.0684 |
1 |
5 |
|
MentHlth |
3.1847 |
7.412 |
0 |
30 |
|
PhysHlth |
4.2420 |
8.7179 |
0 |
30 |
|
DiffWalk |
0.16822 |
0.3741 |
0 |
1 |
|
Income |
6.0538 |
2.0711 |
1 |
8 |
|
HighCol |
0.4241 |
0.4942 |
0 |
1 |
|
Smoker |
0.44316 |
0.4967 |
0 |
1 |
|
Education |
5.050 |
0.985 |
1 |
6 |
|
Age |
8.032 |
3.054 |
1 |
13 |
-
7.2. Evaluation
The average, standard deviation, minimum, and maximum values for the most significant features of the dataset are thoroughly analyzed in Table 3. For further analysis, the dataset's correlation matrix is constructed. Figure 2 illustrates how to evaluate the relationship between two variables in a data collection using a statistical technique called a correlation matrix. The matrix is a table containing correlation coefficients in each cell; a correlation coefficient of 1
denotes a strong association between variables, a correlation coefficient of 0 a neutral relationship, and a correlation coefficient of -1 a weak relationship.
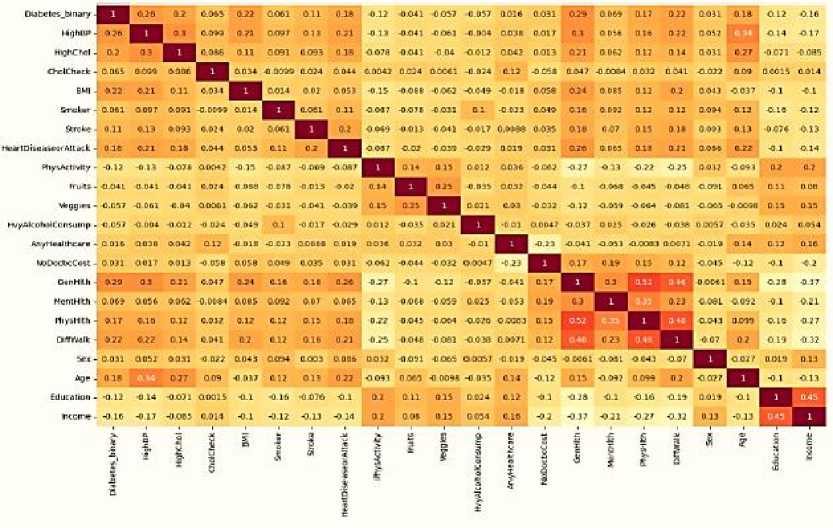
Fig.2. The correlation matrix
The proposed model is evaluated using several ML classifiers such as: LR, RF, DT, and KNN. Table 4 includes the evaluation metrics using all features in the dataset. For all of the evaluation metrics, except the precision one, LR has the highest values. On the other hand, DT has the highest precision.
Table 4. Predict the diabetes by using all features
|
classifiers |
AUC % |
Accuracy% |
Precision% |
Recall% |
F-score% |
|
LR |
94.2922 |
88.0045 |
92.436 |
82.8569 |
87.3847 |
|
RF |
94.1864 |
87.4104 |
93.9127 |
80.0828 |
86.4481 |
|
DT |
90.8981 |
84.0673 |
96.346 |
70.914 |
81.6965 |
|
KNN |
90.7245 |
84.0815 |
88.4021 |
78.5593 |
83.1906 |
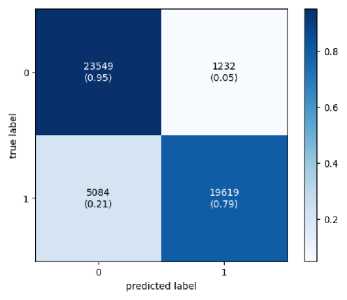
Confusion matrix is created to assess a classification model's performance as shown in Figure 3. The matrix contrasts actual goal values with anticipated values from the ML model. A good model is one with low FP and FN rates and high TP and TN rates.
Training
Fig.3. The confusion matrix

Testing
Table 5 shows the results when chi-squared algorithm is used with all of the four under investigation classifiers. When the number of the feature is 10, RF has the best result among the four classifiers in AUC. For the accuracy, the recall and the F-score metrics, the LR achieved the best results. The worst results occur when three features are only selected and KNN is used. According to the chi-squared algorithm, we choose the first ten features that give the best results, these features are: 'HighBP', 'BMI', 'Stroke', 'HeartDiseaseorAttack', 'NoDocbcCost', 'GenHlth','MentHlth', 'PhysHlth', 'DiffWalk', 'Income'.
Table 5. Predict diabetes using chi-squared algorithm to select features
|
No. of features |
classifiers |
AUC |
Accuracy% |
Precision% |
Recall% |
F-score% |
|
3 |
LR |
0.767795 |
69.8887 |
72.2471 |
65.0746 |
68.4735 |
|
RF |
0.788268 |
70.7893 |
74.833 |
63.0853 |
68.4588 |
|
|
DT |
0.782667 |
70.8412 |
74.1862 |
64.3708 |
68.9309 |
|
|
KNN |
0.732838 |
66.3853 |
63.8592 |
76.2691 |
69.5146 |
|
|
5 |
LR |
0.805807 |
73.8401 |
77.7167 |
66.7359 |
71.8089 |
|
RF |
0.818234 |
73.5854 |
82.385 |
59.898 |
69.3645 |
|
|
DT |
0.802523 |
73.5854 |
82.385 |
59.898 |
69.3645 |
|
|
KNN |
0.760443 |
69.1626 |
69.9134 |
67.1137 |
68.485 |
|
|
7 |
LR |
0.89781 |
81.7333 |
85.0167 |
77.0283 |
80.8256 |
|
RF |
0.908006 |
82.4359 |
90.5988 |
72.3679 |
80.4636 |
|
|
DT |
0.892179 |
80.993 |
94.3791 |
65.8962 |
77.6068 |
|
|
KNN |
0.882921 |
79.5455 |
78.7564 |
80.8962 |
79.812 |
|
|
10 |
LR |
0.937223 |
86.8917 |
91.3306 |
81.4286 |
86.0958 |
|
RF |
0.938201 |
86.3401 |
92.1825 |
79.3188 |
85.2682 |
|
|
DT |
0.91404 |
84.8831 |
92.7841 |
75.544 |
83.2812 |
|
|
KNN |
0.91981 |
85.1848 |
85.891 |
81.087 |
84.9794 |
Table 6 shows the results when Pearson algorithm is used as feature selector. We observed that, RF has the best result among the four classifiers corresponding to the AUC and accuracy metrics and when the number of features is 10. According to the Pearson algorithm, the chosen ten features, that give the best results, are: GenHlth', 'Income', 'DiffWalk', 'PhysHlth', 'Education', 'PhysActivity', 'BMI', 'MentHlth', 'HighBP', 'HeartDiseaseorAttack.
Table 6. Predict diabetes using pearson algorithm to select features
|
No. of features |
classifiers |
AUC |
Accuracy% |
Precision% |
Recall% |
F-score% |
|
3 |
LR |
0.884167 |
80.4272 |
82.7153 |
76.7052 |
79.597 |
|
RF |
0.890344 |
80.7243 |
82.6799 |
77.5104 |
80.0117 |
|
|
DT |
0.889559 |
80.6677 |
82.7649 |
77.2452 |
79.9098 |
|
|
KNN |
0.86853 |
76.6786 |
71.8152 |
87.4763 |
78.8759 |
|
|
5 |
LR |
0.910959 |
83.2045 |
87.6289 |
77.1996 |
82.0843 |
|
RF |
0.914946 |
84.0202 |
90.9547 |
75.4399 |
82.474 |
|
|
DT |
0.905135 |
83.261 |
87.8233 |
77.105 |
82.1159 |
|
|
KNN |
0.896253 |
83.1997 |
88.8889 |
75.7616 |
81.8019 |
|
|
7 |
LR |
0.924473 |
85.1565 |
89.8264 |
79.5071 |
84.3523 |
|
RF |
0.928954 |
85.812 |
92.1646 |
78.4764 |
84.7715 |
|
|
DT |
0.908286 |
84.2324 |
91.5325 |
75.6653 |
82.846 |
|
|
KNN |
0.905616 |
84.4634 |
86.4009 |
82.0371 |
84.1625 |
|
|
10 |
LR |
0.937665 |
86.9342 |
90.8546 |
81.9708 |
86.1844 |
|
RF |
0.939545 |
86.9436 |
93.2377 |
79.5049 |
85.8254 |
|
|
DT |
0.911572 |
84.784 |
95.5547 |
72.7807 |
82.6272 |
|
|
KNN |
0.917518 |
85.0858 |
86.435 |
83.033 |
84.6999 |
Table 7 shows that, the results when the Mutual Information algorithm is used as a feature selector. RF has the best result among the four classifiers in the AUC and the accuracy metrics with a number of 10 feature. The worst results occur when three features are selected and KNN classifier is used.
Table 7. Predict diabetes using MI algorithm to select features
|
No. of features |
classifiers |
AUC |
Accuracy |
Precision |
Recall |
F-score |
|
3 |
LR |
0.904028 |
82.964 |
87.7592 |
76.8849 |
81.963 |
|
RF |
0.90806 |
83.195 |
91.5625 |
73.382 |
81.4703 |
|
|
DT |
0.903575 |
82.8838 |
91.7724 |
72.5016 |
81.0067 |
|
|
KNN |
0.880137 |
79.1211 |
74.6781 |
88.5548 |
81.0267 |
|
|
5 |
LR |
0.920472 |
85.5055 |
92.7229 |
76.9783 |
84.1203 |
|
RF |
0.923346 |
85.7837 |
92.9854 |
77.3282 |
84.4371 |
|
|
DT |
0.911368 |
84.5813 |
95.7202 |
72.3173 |
82.3891 |
|
|
KNN |
0.909993 |
85.2886 |
92.0302 |
77.1863 |
83.9572 |
|
|
7 |
LR |
0.930427 |
85.9487 |
91.4543 |
79.6493 |
85.1446 |
|
RF |
0.934856 |
86.2788 |
93.0745 |
78.7167 |
85.2956 |
|
|
DT |
0.907415 |
84.4115 |
94.7286 |
73.2419 |
82.611 |
|
|
KNN |
0.911642 |
84.6614 |
86.5018 |
82.5406 |
84.4748 |
|
|
10 |
LR |
0.939151 |
87.0521 |
91.1973 |
81.8553 |
86.2741 |
|
RF |
0.940692 |
87.2029 |
93.9683 |
79.3512 |
86.434 |
|
|
DT |
0.911836 |
84.8831 |
95.5431 |
72.9963 |
82.7616 |
|
|
KNN |
0.917045 |
85.4489 |
86.9049 |
83.278 |
85.0528 |
The performance of the proposed MLSO-DNN model is compared with the most recent model that has been published for the prediction of diabetes disease in the final experiment shown in Table 8.
Table 8. The proposed model vs. the state-of-the-art models
|
Ref. |
Model |
Performance metrics |
|
[16] |
DT |
86.42 |
|
NB |
89.90 |
|
|
RF |
93.12 |
|
|
AB |
91.32 |
|
|
[17] |
SVM+ cross validation |
84.09 |
|
[18] |
MDR + KNN |
81.3 |
|
Proposed model |
Feature selection + LR |
94.06 |
8. Conclusions
The primary aim of this work is to classify and predict diabetes from some features without carrying any medical examination. In this paper, we tested a variety of ML classification methods and selected features using three different algorithms to achieve the highest possible performance and accuracy. In addition, the comparisons among the results obtained from the four classifiers show that, the very close results are obtained from the proposed four classifiers, random forest, decision tree, k nearest neighbor and logistic regression but it is clearly that, the random forests have achieved the highest accuracy among them. The classifiers' performance was evaluated using the AUC, F-measure, which includes precision and recall, and accuracy. The model's high ability to predict outcomes and distinguish between the two classes is demonstrated by the AUC values. The best predictions are obtained when 10 features are selected and it occurs with all the four classifiers.
Funding
There was no external funding for this research.
Conflict of Interest
The corresponding author certifies that there is no conflict of interest on behalf of all authors.
Data Availability Statement
The data that support the findings of this study are available from author Eman I. Abd El-Latif, upon reasonable request.
References Exploring Feature Selection and Machine Learning Algorithms for Predicting Diabetes Disease
- Krasteva, A., Panov, V., Krasteva, A., Kisselova, A., and Krastev, Z. Oral cavity and systemic diseases—Diabetes Mellitus. Biotechnol. Biotechnol. Equip. 25, 2183–2186, 2011. doi: 10.5504/BBEQ.2011.0022
- Wang, Andrea N., et al. "Zucker Diabetic‐Sprague Dawley (ZDSD) rat: Type 2 diabetes translational research model." Experimental Physiology 107.4, 2022: 265-282.
- Lonappan A, Bindu G, Thomas V, Jacob J, Rajasekaran C, Mathew KT. Diagnosis of diabetes mellitus using microwaves. J Electromagn Waves Appl. 2007;21(10):1393–401
- Lee, B. J., and Kim, J. Y.. Identification of type 2 diabetes risk factors using phenotypes consisting of anthropometry and triglycerides based on machine learning. IEEE J. Biomed. Health Inform. 20, 39–46, 2016. doi: 10.1109/JBHI.2015.2396520
- Echegoyen, Francisco X. Barrera, et al. "The nature and characteristics of hypertriglyceridemia in a large cohort with type 2 diabetes." Journal of diabetes and its complications 37.2, 2023: 108387.
- Tuppad, Ashwini, and Shantala Devi Patil. "Machine learning for diabetes clinical decision support: a review." Advances in Computational Intelligence 2.2, 2022: 22.
- Kavakiotis, I., Tsave, O., Salifoglou, A., Maglaveras, N., Vlahavas, I., and Chouvarda, I.. Machine learning and data mining methods in diabetes research. Comput. Struct. Biotechnol. J. 15, 104–116, 2017. doi: 10.1016/j.csbj.2016.12.005
- Kavakiotis, I., Tsave, O., Salifoglou, A., Maglaveras, N., Vlahavas, I., and Chouvarda, I.. Machine learning and data mining methods in diabetes research. Comput. Struct. Biotechnol. J. 15, 104–116, 2017. doi: 10.1016/j.csbj.2016.12.005
- Polat, K., and Günes, S.. An expert system approach based on principal component analysis and adaptive neuro-fuzzy inference system to diagnosis of diabetes disease. Digit. Signal Process. 17, 702–710, 2007.
- Yue, C., Xin, L., Kewen, X., and Chang, S.. “An intelligent diagnosis to type 2 diabetes based on QPSO algorithm and WLS-SVM,” in Proceedings of the 2008 IEEE International Symposium on Intelligent Information Technology Application Workshops, Washington, DC, 2008.
- Razavian, N., Blecker, S., Schmidt, A. M., Smith-McLallen, A., Nigam, S., and Sontag, D.. Population-level prediction of type 2 diabetes from claims data and analysis of risk factors. Big Data 3, 277–287, 2015.
- Duygu,ç., and Esin, D.. An automatic diabetes diagnosis system based on LDA-wavelet support vector machine classifier. Expert Syst. Appl. 38, 8311–8315, 2011.
- Georga, E. I., Protopappas, V. C., Ardigo, D., Marina, M., Zavaroni, I., Polyzos, D., et al. Multivariate prediction of subcutaneous glucose concentration in type 1 diabetes patients based on support vector regression. IEEE J. Biomed. Health Inform. 17, 71–81, 2013. doi: 10.1109/TITB.2012.2219876
- Ozcift, A., and Gulten, A.. Classifier ensemble construction with rotation forest to improve medical diagnosis performance of machine learning algorithms. Comput. Methods Programs Biomed. 104, 443–451, 2011. doi: 10.1016/j.cmpb.2011.03.018
- Zou, Q., Qu, K., Luo, Y., Yin, D., Ju, Y., & Tang, H.. Predicting diabetes mellitus with machine learning techniques. Frontiers in genetics, 9, 515, 2018.
- Maniruzzaman, Md, et al. "Classification and prediction of diabetes disease using machine learning paradigm." Health information science and systems 8, 2020: 1-14.
- Malik, Sarul, et al. "Non-invasive detection of fasting blood glucose level via electrochemical measurement of saliva." Springerplus 5, 2016: 1-12.
- Farran, Bassam, et al. "Predictive models to assess risk of type 2 diabetes, hypertension and comorbidity: machine-learning algorithms and validation using national health data from Kuwait—a cohort study." BMJ open 3.5, 2013.
- Tapak, Lily, et al. "Real-data comparison of data mining methods in prediction of diabetes in Iran." Healthcare informatics research 19.3, 2013: 177-185.
- https://www.kaggle.com/datasets/alexteboul/diabetes-health-indicators-dataset?select=diabetes_binary_5050split_health_indicators_BRFSS2015.csv
- Sengupta, Debapriya, Phalguni Gupta, and Arindam Biswas. "A survey on mutual information based medical image registration algorithms." Neurocomputing 486, 2022: 174-188.
- Su, Xiangchenyang, and Fang Liu. "A survey for study of feature selection based on mutual information." 2018 9th workshop on hyperspectral image and signal processing: evolution in remote sensing (WHISPERS). IEEE, 2018.
- Vashisht, Manisha, and Brijesh Kumar. "Traffic Sign Recognition Approach Using Artificial Neural Network and Chi-Squared Feature Selection." Next Generation of Internet of Things: Proceedings of ICNGIoT 2022. Singapore: Springer Nature Singapore, 2022. 519-527.
- Hort, Max, et al. "Bia mitigation for machine learning classifiers: A comprehensive survey." arXiv preprint arXiv:2207.07068, 2022.
- Priyanka, and Dharmender Kumar. "Decision tree classifier: a detailed survey." International Journal of Information and Decision Sciences 12.3, 2020: 246-269.
- Nanfack, Géraldin, Paul Temple, and Benoît Frénay. "Constraint Enforcement on Decision Trees: A Survey." ACM Computing Surveys (CSUR) 54.10s, 2022: 1-36.
- Shaik, Anjaneyulu Babu, and Sujatha Srinivasan. "A brief survey on random forest ensembles in classification model." International Conference on Innovative Computing and Communications: Proceedings of ICICC 2018, Volume 2. Springer Singapore, 2019.
- Cunningham, Padraig, and Sarah Jane Delany. "k-Nearest neighbour classifiers-A Tutorial." ACM computing surveys (CSUR) 54.6, 2021: 1-25.
