Express analysis of the condition of the economic complex of an old industrial region

Author: Mitrofanova Inna V., Rodionova Ekaterina V.
Journal: Вестник Волгоградского государственного университета. Экономика @ges-jvolsu
Section: Региональная экономика
Article in issue: 2 т.20, 2018.
Free access
About 40 % of the Russian regions are classified as old industrial ones, where due to a fragmentary character of the government regional policy in the 1990s, the main investment resources were concentrated in the enterprises of the old city forming industries that hindered the innovative development of these regions contrasted to their technological backwardness. That’s why in the age when the industrial challenges emerge, the economic complexes of these regions are subject to risks, first of all, due to the threats and challenges connected with an intensive dynamics of the changes of exogenous and endogenous factors of the competitiveness of the production of basic industries. The economy of old industrial regions is apt to depressions together with the deficit of financial resources, inefficient reforms, absence of relevant plants of the reindustrialization. In this connection, a quick analysis of the beginning of stagnation and depression plays a very important role. We suggest and test the methodology of an express analysis of the condition of the economic complex based on the calculation of an integral indicator, which takes into account the main industrial coefficients (labour productivity, efficiency of use of the fixed assets, intensity of the renovation of machines and equipment, dynamics of the fixed assets renovation, share of the investments into the gross regional products, investments into fixed capital and budgetary efficiency of fixed assets use), which allows for quick identification of the beginning of the stagnation and reducing the time lag between the problem perception and the correction of the regional economic policy. The regions of the Southern Federal District have been used as the example of old industrial regions. In order to solve the problem of a depressive situation in a number of old industrial regions, an integrated State program for the efficient replacement in the old dominating industries of old enterprises by new modern plants within the national structural and industrial policy is indispensable. The leading role in their transformation is played with the modernization of the investment system, which fixes oan inertial scenario of the development, as well as its efficient replacement and efficient reindustrialization of the regional economic complex.
Old industrial region, economic complex, reindustrialization, analysis, depression, regional economic policy, time lag, southern federal district
Short address: https://sciup.org/14971290
IDR: 14971290 | UDC: 332.055 | DOI: 10.15688/jvolsu3.2018.2.5
Экспресс-диагностика состояния хозяйственного комплекса старопромышленного региона
Около 40 % российских регионов относятся к типу старопромышленных, где вследствие фрагментарности государственной региональной политики в 90-х гг. XX века основные инвестиционные ресурсы сконцентрировались на предприятиях старопромышленных градообразующих отраслей, что замедлило инновационное развитие этих регионов на фоне консервации их технологической отсталости. Поэтому в эпоху индустриальных вызовов хозяйственные комплексы этих регионов в первую очередь подвергаются рискам из-за угроз и вызовов, спровоцированных интенсивной динамикой изменений экзогенных и эндогенных факторов конкурентоспособности продукции базовых отраслей. Экономика старопромышленных регионов склонна к депрессиям на фоне дефицита финансовых ресурсов, неэффективного реформирования, отсутствия актуальных планов реиндустриализации. В связи с этим важную роль играет оперативная диагностика начала стагнации и депрессии. Авторами предложена и апробирована на примере старопромышленных регионов Южного федерального округа методика экспресс-диагностики состояния хозяйственного комплекса, основанная на расчете интегрального индикатора с учетом основных производных показателей (производительность труда, эффективность использования ОПФ, интенсивность обновления средств труда, динамика обновления ОПФ, доля инвестиций в ВРП, инвестиции в основной капитал и бюджетная эффективность использования ОПФ), позволяющая оперативно выявлять начало его стагнации и сокращать временной лаг между осознанием проблемы и коррекцией региональной экономической политики. Для решения проблемы депрессивного положения ряда старопромышленных регионов необходима комплексная государственная программа по эффективному замещению новыми современными производствами доминирующих старых индустрий в рамках национальной структурно-промышленной политики. В их трансформации определяющую роль играет модернизация системы инвестирования, которая может иметь своим прямым следствием как закрепление инерционного сценария развития, так и эффективное замещение, эффективную реиндустриализацию регионального хозяйственного комплекса.
Text of the scientific article Express analysis of the condition of the economic complex of an old industrial region
DOI:
Old industrial region is a territory which has an “industrial nucleus” of the economic complex, and it is formed by the industries of the “third” and the “forth” technological modes. Such regions are referred to the group of adaptive territories which do not generate but rather adopt innovations [10; 11].
In the age of industrial revolution, of the mass industrialization of the Russian economy, the old industrial regions (about 40 % from the total number of the regions in Russia) developed mainly like the territories of the concentration of industrial production due to the serial construction of industrial plants usually as territorial and industrial complexes and very often in the limited monofunctional territories (mono-towns).
The direct negative consequence of an incosistent government regional policy which was realized in the 1990s century was the concentration of the main investment resources of the state by old industries, which are city forming industries. This all had a negative impact on the structure of the industrial demand in the economy, it had a suppressive effect on the innovative development, it “fixed” the technological backwardness of such regions.
Today, in the post industrial times, these very regions were the first subject to risk due to threats and challenges caused by an intensive dynamics of changes of exogenous and endogenous factors of competitiveness of the production of basic industries. They are contrasted with the regions, which are maximally involved into the international trade for which a high labour productivity is typical. They have a developed service sector. The growth of the share of innovation products in the structure of the industrial production of the social and economic complex is observed in [1, pp. 161163; 8, pp. 50-52; 9, p. 14].
The prospects of their development are connected, first of all, with a traditional specialization which had been formed long before, and the vision of the future is determined by the trajectory of the preceeding dynamics. This fact mainly explains why most part of the strategies of social and economic development of old industrial regions of Russia are founded on conservative scenarios.
Old industrial regions of Russia are internally heterogeneous. Among them there are regions found at different stages of the evolutionary development. This fact is mainly determined by the specificity of the spatial localization. Old industrial regions can pass to a depressive state when the structural reforms, which started suffer from the deficit of financial resources, are planned irrationally. The reforms are realized inefficiently, that’s why the priorities of the state regional social and economic policy should adequately take into account the available historic preconditions of the functioning of a territory. Its main advantages are determined by the level of the disposable social and economic potential and also by the functional role of the region in the provision of long-term social and economic interests of Russia.
In the strategic documents developed at the federal level of administration, the creation of innovatively active economy remains one of the main priorities. That’s why old industrial regions of Russia will have to integrate into this process.
In order to choose a relevant complex of the tools of support of old industrial regions, their well-timed correction and change are needed. For that goal a quick, unsophisticated analysis is indispensable, which allows identifying the beginning of the damp, stagnation, transition to a crisis or a depression. Ideally, such a trend analysis (the study of the current social and economic situation in a region) is expected to give an objective assessment of the economic situation, to identify positive and negative tendencies of development, narrow places and growth points, constructive and destructive effects of the preceding administrative actions and other aspects, which are the basis for the explanation and the development of constructive measures for the future [15, pp. 9-11]. However, in the opinion of the authors, it is extremely important to develop and to test the labour saving methodology of the express analysis, which allows for quick identification of the beginning of stagnation and taking proactive operational measures.
The list of basic indices for the express analysis can be various. For instance, in compliance with the ‘Methodology of a complex assessment of socio-economic development of Russian Regions’ (2001) [4], an integrated index included 12 positions: GDP in a region per capita taking into account the purchasing parity standard; investments into fixed capital per capita; foreign trade turnover per capita; financial provision of a region taking into account the purchasing parity standard; share of the average stuffing number employed in small enterprises in the total average number of the employed in enterprises and organizations; registered unemployment rate; ratio of average income level to the minimum subsistence level; share of population with the incomes below minimum subsistence level in the total number of the population, etc.
According to other methodologies, the list should be enlarged to 18 positions due to the introduction of indices reflecting the results of the economic activity of the region and the size of disproportions between them.
Meanwhile, on the basis of the results of research by V. I. Volkov [16, pp. 176-178] and I. V. Mitrofanova [5; 6], it is sufficient to control a small number of basic derived indices, the dynamics of which in total through the assessment of the change (growth, stability, decrease) of an integral express analysis allows identifying the beginning of the stagnation (slump, depression) of the economic complex of an old industrial region.
Any system is expected to have an integrating index providing a methodological unity of all its particular indices and identical evaluation of the level and the dynamics of the studied process. The development of an integrated (generalizing) indicator of the regional development has an important diagnostic function. The assessment of its dynamics reflects also the efficiency of the tools of the state regional policy realized in the region.
For the calculation of an integrated express indicator of the development of the economic complex of old industrial regions, the authors suggest using statistical and qualitative parameters (ratios), which are the key indicators for the evaluation of its condition (growth, stagnation, beginning of a depression):
-
1) labour productivity (GDP / number of the employed in the regional economy)1;
-
2) efficiency of use of fixed assets (GDP / value of fixed assets);
-
3) intensity of the renewal of productive equipment (investments into fixed assets / number of the employed in the regional economy);
-
4) dynamics of the renewal of fixed assets (investments into fixed assets / value of fixed assets);
-
5) investments into the GDP (investments into fixed assets / GDP);
-
6) budgetary efficiency of use of fixed assets (payments into the consolidated budget of Russia / value of the fixed assets).
By means of the adaptation and the development of the mathematical approaches used by T. A. Bondarskaya [2], taking into account the methodological approaches to the assessment of the level of social and economic development of the regions suggested by Yu. V. Zadorozhneva and A. E. Kalinina [17], M. A. Khalikov and D. V. Minin [3] and others, as well as the methodologies suggested in a number of official papers, the authors come to a conclusion that as particular key indices which characterize the condition of the economic complex of old industrial regions are heterogeneous, it is necessary to reduce them to summary values. At the reduction of specific indices into integrated one, the methods of the “sum of grades” and the “sum of ranks” which are founded on the use of various weight coefficients of the importance of specific indices (weights or shares), are used.
At the reduction of specific indices into an integrated one a famous method of relative differences is used (1):
I _ x x min
X — X ■ max min
where I – integrated index; х – specific value of the index; х max, х min – maximal and minimal values of the indices in a sample.
Then intermediary values of the coefficients with the help of equation (2) are calculated:
K. _ -^j-, ij j max
where Кij – j coefficient of region i ; xij – j index of region i ; xj max – maximal value of the j coefficient among regions.
Intermediary coefficients are presented as a share from the maximal value of the corresponding index (1) in the regions.
The synthetic index constructed on the basis of the standardized values of basic indices is used as a generalized index Rj in equation (3):
R j =^ (1 - xy ) 2 . (3)
In accordance with the classification used by the Ministry of Regional Development of the Russian Federation and with the account of the specification of the authors, the Southern macroregion of Russia includes 2 basic old industrial regions (the Volgograd region and the Rostov region), 1 backing old industrial region (the Astrakhan region), 1 center of federal importance (the Krasnodar krai), 2 special regions (the Ingushetia Republic and the Chechen Republic), 1 depressive region (the Stavropol krai) and 6 depressive republics in a crisis situation.
In accordance with another classification (including mono-towns) suggested by State Company Stas Marketing, the Volgograd region is a service-oriented old industrial region; the Astrakhan region is a vulnerable old industrial region; the Rostov region is an old industrial region of the Soviet industrialization.
In the Volgograd region alone about 40% of the added value is produced in the industry, and this share is higher than in the rest of the regions of the Southern Federal District (Table 1).
The authors’ operational methodology of the express analysis, which is based on the dynamic analysis of the changes of 6 basic economic indices (labour productivity, efficiency of use of fixed assets, intensity of the renewal of productive equipment, dynamics of the renewal of fixed assets, dynamics of the renewal of fixed assets, investments into the GDP, budgetary efficiency of use of fixed assets) will allow identifying quickly the beginning of the stagnation of the economic complex of an old industrial region and reducing the temporary lag between the perception of a problem, development and taking corresponding measures in the correction of the regional economic policy.
Table 1
Sectoral structure of the added value in the regions of the Southern macroregion in enlarged sectors in 2014, %
|
Regions of the Southern macroregion |
Sector |
||||
|
Agrarianbioresource |
Raw material |
Industrial |
Trade and financial |
Budgetary dependent |
|
|
Southern federal district |
|||||
|
Astrakhan region |
6,9 |
21,5 |
20,0 |
33,9 |
17,7 |
|
Volgograd region |
10,4 |
4,6 |
40,0 |
31,4 |
13,6 |
|
Krasnodar krai |
10,3 |
0,6 |
29,5 |
46,6 |
13,0 |
|
Rostov region |
12,3 |
0,9 |
30,2 |
41,0 |
15,6 |
|
Republic of Kalmykia |
14,0 |
0,7 |
26,2 |
36,3 |
22,8 |
|
Republic of Adygea |
14,0 |
0,7 |
26,2 |
36,3 |
22,8 |
|
Sevastopol |
5,4 |
0,0 |
12,1 |
40,2 |
42,3 |
|
Republic of Crimea |
22,0 |
3,1 |
16,9 |
30,9 |
27,1 |
|
North Caucasian federal district |
|||||
|
Stavropol krai |
15,1 |
0,7 |
24,8 |
37,7 |
21,7 |
|
Kabardino-Balkar republic |
16,2 |
0,1 |
27,3 |
30,4 |
26,0 |
|
Karachay-Cherkess Republic |
19,2 |
1,5 |
29,7 |
22,2 |
27,4 |
|
Republic of Dagestan |
14,1 |
0,4 |
26,3 |
42,5 |
16,7 |
|
Republic of Ingushetia |
6,4 |
1,7 |
24,0 |
29,5 |
38,4 |
|
Republic of North Ossetia-Alania |
15,6 |
0,3 |
22,4 |
32,1 |
29,6 |
|
Chechen Republic |
7,2 |
1,7 |
20,0 |
32,6 |
38,5 |
Source. Compiled on the basis of [7].
For a dynamic calculation of an integral express indicator of the assessment of the state of the economic complex of the old industrial regions of the Southern Federal District the open statistical data and their derivatives are used. (Table 2, 3).
On the basis of use of the methodological approaches presented earlier, the values of integral express indicators of the state of the economic complex of three old industrial regions of the Southern Federal District (the Astrakhan region, the Volgograd region and the Krasnodar krai) for a five year period are calculated (Table 4, Fig. 1).
On the basis of the suggested methodology using the data of the old industrial regions of the Southern Federal District, the beginning of the stagnation of the economic complex of the Volgograd region in the group of the most important 6 derived indices is identified. This trend began in 2013 at a multidirectional dynamics of each of them, but their integration demonstrates a downward movement of the express indicator in 2013–2015.
The methodology of the express analysis of the state of the economic complex tested on the information from the old industrial regions of the Southern Federal District takes into account an integral indicator of six main derived economic indices and allows identifying quickly the beginning of its stagnation and reducing the time lag between the problem perception and the correction of the regional economic policy.
The regional authorities of old industrial regions use an outdated industry as an economic basis, and without alternative jobs for people employed in it they are very often forced to formulate and to implement their own quasi governmental regional policy within poorly modernized, conservative strategies of the regional development.
Thus, the solution of the problem of a depressive state of a number of old industrial regions requires the development of the integrated governmental program for an efficient replacement of old dominating industries by new modern plants within the national structural and industrial policy. The leading role in their transformation is played by the investment system, which has as a direct consequence the fixation of an inertial scenario of development, conservation of the technological backwardness of a territory, an efficient replacement, an efficient reindustrialization of the regional economic complex.
Table 2
Basic indices of the development of the economic complex of the old industrial regions of the Southern Federal District (2011–2015)
|
Regions |
Index |
Year |
||||
|
2011 |
2012 |
2013 |
2014 |
2015 |
||
|
Russian Federation |
GDP, million rubles |
45 392 276,7 |
49 926 068,7 |
54 103 000,3 |
58 900 652,2 |
64 997 039,3 |
|
Southern Federal District |
2 777 791,9 |
3 185 419,8 |
3 574 075,7 |
3 920 265,1 |
4 304 447,3 |
|
|
Astrakhan region |
172 616,6 |
273 917,1 |
273 917,1 |
288 951,6 |
320 735,0 |
|
|
Volgograd region |
508 433,3 |
607 472,2 |
607 472,2 |
715 050,4 |
735 293,1 |
|
|
Rostov region |
765 967,2 |
917 689,1 |
917 689,1 |
1 000 247,6 |
1 171 784,1 |
|
|
Russian Federation |
Fixed assets, million rubles |
108 001 247 |
121 268 908 |
133 521 531 |
147 429 656 |
160 725 261 |
|
Southern Federal District |
6 548 818 |
7 222 089 |
8 347 529 |
9 255 432 |
10 342 980 |
|
|
Astrakhan region |
747 640 |
808 160 |
850 132 |
912 745 |
1 053 750 |
|
|
Volgograd region |
1 346 669 |
1 462 441 |
1 570 668 |
1 735 392 |
1 818 202 |
|
|
Rostov region |
1 751 414 |
1 880 446 |
2 003 572 |
2 085 372 |
2 355 619 |
|
|
Russian Federation |
Investments into fixed assets, million rubles |
11 035 652 |
12 586 090 |
13 450 238 |
13 902 645 |
14 555 902 |
|
Southern Federal District |
1 079 284 |
1 254 958 |
1 506 034 |
1 353 827 |
1 207 473 |
|
|
Astrakhan region |
69 024 |
81 665 |
122 618 |
116 856 |
111 562 |
|
|
Volgograd region |
104 080 |
136 154 |
140 680 |
182 798 |
193 342 |
|
|
Rostov region |
165 978 |
207 935 |
253 623 |
264 173 |
291 029 |
|
|
Russian Federation |
Average annual number of the employed in the economy, thousand people |
67 643,6 |
67 968,3 |
67 901,0 |
67 813,3 |
68 389,1 |
|
Southern Federal District |
6 130,9 |
6 201,1 |
6 197,8 |
6 161,2 |
6 140,7 |
|
|
Astrakhan region |
448,5 |
442,5 |
436,9 |
436,4 |
434,7 |
|
|
Volgograd region |
1 226,1 |
1 252,9 |
1 253,2 |
1 230,3 |
1 221,2 |
|
|
Rostov region |
1 902,2 |
1 912,4 |
1 913,6 |
1 909,6 |
1 901,8 |
|
|
Russian Federation, billion rubles |
Payments into the consolidated budget of the Russian Federation, million rubles |
9 719,6 |
10 958,2 |
11 325,9 |
12 669,5 |
13 787,8 |
|
Southern Federal District |
411 108,6 |
486 685,8 |
513 260,0 |
559 073,2 |
628 886,0 |
|
|
Astrakhan region |
30 231,2 |
46 729,8 |
47 006,5 |
56 745,6 |
68 257,1 |
|
|
Volgograd region |
92 889,3 |
95 265,9 |
103 722,8 |
109 750,4 |
118 990,3 |
|
|
Rostov region |
113 867,8 |
133 583,5 |
143 452,4 |
160 255,3 |
169 132,4 |
|
Source. Compiled on the basis of [7; 12-14].
Table 3
Indices for the calculation of the integrated express indicator of the state of the economic complex of the old industrial regions of the Southern Federal District (2011–2015)
|
Region |
2011 |
2012 1 |
2013 |
2014 |
2015 |
2016 |
|
Labour productivity (GDP / number of the employed in the regional economy), rubles/person |
||||||
|
Russian Federation |
671 050,6 |
734 549,3 |
796 792,4 |
868 570,4 |
950 400,6 |
|
|
Southern Federal District |
453 080,6 |
513 686,2 |
576 668,4 |
636 282,7 |
700 970,1 |
|
|
Astrakhan region |
384 875,4 |
473 795,3 |
626 956,1 |
662 125,6 |
737 830,7 |
|
|
Volgograd region |
414 675,2 |
456 154,6 |
484 736,8 |
581 200,0 |
602 107,0 |
|
|
Rostov region |
402 674,4 |
441 100,3 |
479 561,6 |
523 799,5 |
616 144,8 |
|
|
Efficiency of use of fixed assets (GDP / value of fixed assets), rubles/rubles |
||||||
|
Russian Federation |
0,42 |
0,41 |
0,41 |
0,39 |
0,40 |
|
|
Southern Federal District |
0,42 |
0,44 |
0,43 |
0,42 |
0,42 |
|
|
Astrakhan region |
0,23 |
0,26 |
0,32 |
0,32 |
0,30 |
|
|
Volgograd region |
0,38 |
0,39 |
0,39 |
0,41 |
0,40 |
|
|
Rostov region |
0,44 |
0,45 |
0,46 |
0,48 |
0,50 |
|
|
Intensity of the renewal of productive equipment (investments into fixed assets / number of the employed in the regional economy), rubles/person |
||||||
|
Russian Federation |
163,1 |
185,2 |
198,1 |
205,0 |
212,8 |
|
|
Southern Federal District |
176,0 |
202,4 |
243,0 |
219,7 |
196,6 |
|
|
Astrakhan region |
159,9 |
184,6 |
280,7 |
267,8 |
256,6 |
|
|
Volgograd region |
84,9 |
108,7 |
112,3 |
148,6 |
158,3 |
|
|
Rostov region |
87,3 |
108,7 |
132,5 |
138,3 |
153,0 |
|
|
Dynamics of the renewal of fixed assets (investments into fixed assets / value of fixed assets), rubles/rubles |
||||||
|
Russian Federation |
0,10 |
0,10 |
0,10 |
0,09 |
0,09 |
|
|
Southern Federal District |
0,16 |
0,17 |
0,18 |
0,15 |
0,12 |
|
|
Astrakhan region |
0,09 |
0,10 |
0,14 |
0,13 |
0,11 |
|
|
Volgograd region |
0,08 |
0,09 |
0,09 |
0,11 |
0,11 |
|
|
Rostov region |
0,09 |
0,11 |
0,13 |
0,13 |
0,13 |
|
|
Share of investments into the GDP ( investments into fixed assets / GDP), rubles/rubles |
||||||
|
Russian Federation |
0,24 |
0,25 |
0,25 |
0,24 |
0,22 |
|
|
Southern Federal District |
0,39 |
0,39 |
0,42 |
0,35 |
0,28 |
|
|
Astrakhan region |
0,40 |
0,39 |
0,45 |
0,40 |
0,35 |
|
|
Volgograd region |
0,20 |
0,24 |
0,23 |
0,26 |
0,26 |
|
|
Rostov region |
0,22 |
0,25 |
0,28 |
0,26 |
0,25 |
|
|
Budgetary efficiency of use of fixed assets (payments into the consolidated budget of Russia / value of the fixed assets), rubles/rubles |
||||||
|
Russian Federation |
0,09 |
0,09 |
0,08 |
0,09 |
0,09 |
|
|
Southern Federal District |
0,06 |
0,07 |
0,06 |
0,06 |
0,06 |
|
|
Astrakhan region |
0,04 |
0,06 |
0,06 |
0,06 |
0,06 |
|
|
Volgograd region |
0,07 |
0,07 |
0,07 |
0,06 |
0,07 |
|
|
Rostov region |
0,07 |
0,07 |
0,07 |
0,08 |
0,07 |
|
Source. Compiled and calculated by the authors on the basis of the official statistics.
Table 4
Values of integral express indicators of the state of the economic complex of old industrial regions of the Southern Federal District in 2011–2015
|
Region |
Year |
||||
|
2011 |
2012 |
2013 |
2014 |
2015 |
|
|
Russian Federation |
1,11 |
1,31 |
1,41 |
1,60 |
1,56 |
|
Southern Federal District |
0,98 |
1,01 |
1,26 |
1,35 |
1,54 |
|
Astrakhan region |
1,95 |
1,90 |
1,58 |
1,57 |
1,62 |
|
Volgograd region |
2,01 |
2,11 |
2,11 |
1,99 |
1,82 |
|
Rostov region |
1,89 |
1,97 |
1,71 |
1,73 |
1,72 |
Source. Compiled and calculated by the authors.
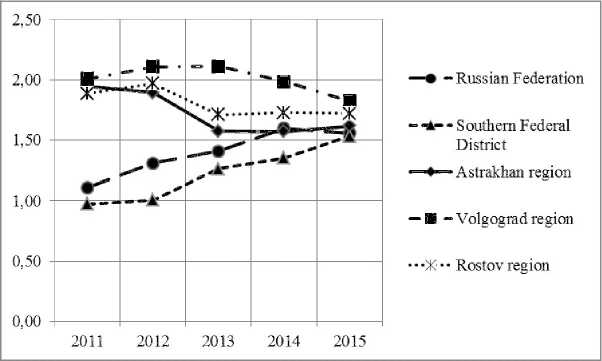
Fig. 1. Dynamics of integral express indicators of the state of the economic complex of old industrial regions of the Southern Federal District, 2011–2015
Source. Compiled and calculated by the authors.
ACKNOWLEDGMENT
The paper has been prepared in the context of the Program of fundamental research of the Presidium of the Russian Academy of Sciences I.52 “Provision of sustainable development of the South of Russia under the conditions of climatic, ecological and technology related challenges” (State assignment of the Southern Scientific Center of the Russian Academy of Sciences for 2018, project’ state registration No. АААА-А18-118011990322-1.
NOTE
1 The largest part of the methodologies takes into account the GRP (Gross Regional Product) per capita, although it is the employed people in the regional economy who produce the GRP.
References Express analysis of the condition of the economic complex of an old industrial region
- Bakanov S.A. «Kontseptsiya staropromyshlennykh r egionov» v istorikoekonomicheskikh issledovaniyakh: problemy teorii i istoriografii . Vestnik Chelyabinskogo gosudarstvennogo universiteta , 2015, vol. 66, no. 24 (379), pp. 160-167.
- Bondarskaya T.A. Metodika rascheta integralnogo pokazatelya razvitiya chelovecheskogo kapitala dlya formirovaniya kreativnoy sredy . Sotsialno-ekonomicheskie yavleniya i protsessy , 2015, vol. 10, no. 9, pp. 12-17.
- Khalikov M.A., Minin D.V. Metodika kompleksnoy otsenki urovnya sotsialnoekonomicheskogo razvitiya regionov Rossiyskoy Federatsii i napravleniya ee sovershenstvovaniya . Regionalnaya ekonomika: teoriya i praktika , 2007, no. 7, pp. 59-63.
- Metodika kompleksnoy otsenki urovnya sotsialno-ekonomicheskogo razvitiya subyektov Rossiyskoy Federatsii: Prilozhenie k FTsP «Sokrashchenie razlichiy v sotsialnoekonomicheskom razvitii regionov Rossiyskoy Federatsii (2002-2010 gg. i do 2015 g.): Postanovlenie Pravitelstva RF ot 11.10.2001g. № 717. URL: http://base.garant.ru/183843/.
- Mitrofanova I.V., Kurchenkov V.V. Sovershenstvovanie sistemy pokazatelei sotsialno-ekonomicheskogo razvitiya regiona v kontekste programmno-tselevogo upravleniya (na primere YuFO). Vestnik Voronezhskogo gosudarstvennogo universiteta. Seriya «Ekonomika i upravlenie» , 2005, no. 2, pp. 57-67.
- Mitrofanova I.V. Pokazateli regionalnogo razvitiya: rasshirennyy podkhod . Osipov Yu.M., Sizov V.S., Zotova E.S., eds. Ekonomicheskaya teoriya v XXI veke. Vyp. 3(10): Problemy poreformennoy ekonomiki . Moscow, Ekonomist Publ., 2005, pp. 278-285.
- Regiony Rossii. Sotsialno-ekonomicheskie pokazateli 2016. Stat. sbornik . Moscow, Rosstat Publ., 2016. 1326 p.
- Shelomentseva V.P., Ifutina E.A., Shelomentsev P.Yu. Staropromyshlennyy region: priroda vozniknoveniya, klassifikatsiya, preobrazovanie . Vestnik universiteta Turan , 2016, no. 2 (70), pp. 49-53.
- Shestopalov A.G., Borisov E.I., Safronov K.K., Kaledina E.S. Perspektivy strategicheskogo razvitiya staropromyshlennykh regionov Rossii . Byudzhet , 2012, pp. 14-19.
- Sorokina N.Yu. Klassifikatsiya staropromyshlennykh regionov dlya tseley upravleniya ustoychivym razvitiem . Izvestiya Tulskogo gosudarstvennogo universiteta. Ekonomicheskie i yuridicheskie nauki , 2013, vol. 3, iss. 1, pp. 257-268.
- Sorokina N.Yu. Obespechenie ustoychivogo sotsialno-ekonomicheskogo razvitiya staropromyshlennykh regionov Rossiyskoy Federatsii: avtoref. diss. … d-ra ekon. nauk . Moscow, 2017. 40 p.
- Sotsialno-ekonomicheskoe polozhenie Yuzhnogo federalnogo okruga v 2015 g. . Moscow, Federal State Statistics Service, 2016. 84 p.
- Sotsialno-ekonomicheskoe polozhenie Yuzhnogo federalnogo okruga v 2016 g. . Moscow, Federal State Statistics Service, 2017. 83 p.
- Sotsialno-ekonomicheskoe polozhenie Yuzhnogo federalnogo okruga v yanvare-dekabre 2016 g.: Inform.-anal. mat. . Rostov-on-Don, Rostovstat Publ., 2017. 233 p.
- Sutyagin V.S. O sootnoshenii nauchnykh prognozov i gosudarstvennykh programm sotsialnoekonomicheskogo razvitiya . Problemy prognozirovaniya , 1998, no. 1, pp. 3-11.
- Volkov V.I. Novye podkhody k otsenke ekonomicheskogo razvitiya regionov . Regionologiya , 2003, no. 3, pp. 174-181.
- Zadorozhneva Yu.V., Kalinina A.E. Mnogofaktornaya otsenka effektivnosti realizatsii sotsialno-ekonomicheskoy politiki regiona . Sovremennye problem nauki i obrazovaniya, 2012, no. 4. URL: http://www.science-education.ru/104-6719.
