Extracting a linguistic summary from a medical database

Author: Djazia Amghar, Amine.M.Chikh
Journal: International Journal of Intelligent Systems and Applications @ijisa
Article in issue: 12 vol.10, 2018.
Free access
In general, medical clustering concerns a big database. The present paper aims at extracting a fuzzy linguistic summary from a large medical database. A linguistic summary is used to reduce large volumes of data to simple sentences. It is worth noting that with the increase of the amount of medical data, different techniques of machine learning have been developed recently. In this article, an attempt is made to build a medical linguistic summary template. Our linguistic summary model is based on the calculated fuzzy cardinality. It deals with semantic queries in natural language. Our proposal is to develop a classification system based on the linguistic summary of two medical databases in which the calculation of similarity between different sets of linguistic summaries is used; the patient’s class is then identified by calculating the Sugeno integral. The present study was successful in developing a classification system that is based on the linguistic summary of two datasets from the UCI Machine Learning Repository, i.e. Pima Indians Diabetes dataset and Wisconsin Diagnostic Breast Cancer (WDBC) dataset. The results obtained were then employed for a benchmark test.
Medical data, summary linguistic, fuzzy queries, Medical Data classification, fuzzy logic
Short address: https://sciup.org/15016549
IDR: 15016549 | DOI: 10.5815/ijisa.2018.12.02
Text of the scientific article Extracting a linguistic summary from a medical database
Published Online December 2018 in MECS
Your In recent years, the medical field has produced increasingly voluminous amounts of electronic data that are becoming more and more complex. The medical data obtained have certain characteristics that make their analysis very challenging. It is interesting to mention that the bulk of the information stored in medical databases is not used in the decision-making process; therefore, the analysis of all the data turns out to be ineffective. A large number of existing works have focused on getting the appropriate information that helps taking the right decision. Data mining and ontology may be employed for such a purpose [1-2]. In addition, most of the representations of Knowledge Discoveries in Databases (KDD) systems are often unintelligible to users.
In the present paper, our contribution consists of using linguistic summaries for the design of a diagnostic decision support system in order to be able to deduce the state of the patient in a simple and transparent way (supervised classification).
In this work, the linguistic summary of digital data is used. Most linguistic summary applications are encountered in business [3–5]; few of them are found in the medical field [6–8].
The linguistic summary based on the theory of fuzzy sets, proposed by Zadeh [9], offers a direct and interesting semantic interpretation of natural language.
The theory of fuzzy sets can be used to define linguistic summaries because it allows obtaining a linguistic description of the data. The basic idea is to model linguistic terms using fuzzy linguistic variables (like almost all, around) [10] and also to carry out computations in order to estimate the extent to which a given sentence is considered to be true.
Many linguistic summary approaches exist; some of these are The SAINTETIQ model [11-12] which is constructed as a hierarchical tree, and the Yager’s method [13], which is the oldest method that uses fuzzy quantifiers to describe the data used. An example of a summary can be “Most workers are young”.
The last method, which is used in this article, is a summary which is based on the calculation of the fuzzy cardinality [5]; it depends on the cardinality of each fuzzy subset.
A large number of interrogation systems for linguistic summaries exist [4][12], [14], [15]. The objective is to improve these interrogation systems and make them more flexible. These systems are said to be flexible when the linguistic summary is perfectly represented. Each summary model has a different protoform. However, the above mentioned works did not truly integrate the linguistic summary into a diagnostic support system.
The present article seeks to present a complete medical linguistic summary model where a flexible query system, that meets the needs of the user, is developed. In addition, two types of queries are addressed here, namely the type fuzzy (Q R’s are T) and type fuzzy (Q R’s and P are T), using quantitative and qualitative information.
Two factors are considered, i.e. the time factor and the precision factor. The linguistic summary obtained as a knowledge base (KB) is also considered.
Our contribution consists of using linguistic summaries for the design of a diagnostic decision support system to deduce the state of the patient in a simple and transparent way (supervised classification).
The next section gives an overview of the fuzzy cardinality model which briefly depicts the representations of a summary and the different steps involved in the summary building process and presents the different classification techniques, i.e. MLP, SVM and KNN; the similarity among linguistic summaries is defined and calculated. In the experimental section, our medical linguistic summary template is presented; an example is also given for clarification. Finally, the results obtained are discussed in the last section and our findings are compared with other works previously reported in the literature.
-
II. Related Work
-
A. Linguistic summary and fuzzy cardinality
First, the concept of linguistic summary is introduced and then the principles of summarization are presented. The fuzzy cardinality-based approach to a linguistic summary of a digital database is also given here.
Linguistic summary: In this section, the basic approach to linguistic summarization of a database is briefly explained.
A linguistic summary is a meta description of the information in the database; it can be used to express relational knowledge about the data [13].
One may have either Y = { y^ ,...., y } , where Y is an object in the database D, or A = { A 1,...., An } , where A describes an object from Y. The classical protoform proposed by Yager [13] has the form:
Qy ' sareP
QRy ' sareP
Where Q is a linguistic quantifier ( e.g . most ) associated with a membership function ^ ; P is a summary that is associated with a level of truth.
The natural language terms are modeled by the fuzzy subset, which allows describing the attribute values of these terms. The resulting descriptions are materialized by the concepts that exist in the registration; "The young and well paid" is a good example. Each registration is linked to one or more concepts following the adequacy between its attribute values and the terms that label the concept (young and well paid). These are registered methods in the field of linguistic summary of Yager [13].
These methods are all based on the theory of fuzzy sets, which is a method proposed by Zadeh [9] to express vague concepts.
Principle of fuzzy cardinality: Suppose that our relational database has three attributes, namely A, B, C. These are attributes of the relation r [5], [16]One can therefore say that ( ai , bj , ck ) is the t-uplet in the relation r ( A , B , C ) with attributes A, B, C .
Consider a trapezoidal membership function; then, the fuzzy partition may be performed for each attribute, i.e. ( A , A ,..., A ) , ( B , B ,..., B ) , ( C , C ,..., C ) .
-
1, 2, , na 1, 2, , nb 1, 2, , nc
It is assumed that a finite scale (with m + 1 levels) is used for assessing the membership degrees, namely 1=cq>... > o m > 0 . Each level corresponds to a different possible understanding of Ar as the level cut ( Ar ) c i . Therefore, the use of a finite scale greatly facilitates the computation of fuzzy cardinalities, as it is shown in the following, without being a serious limitation in practice.
The linguistic summary rsu with database r ( A, B, C ) is composed of two phases:
The labeling phase
Each t-uplet < ai , bj , ck > can be replaced by one or several tuples of fuzzy sets < Ar , Bs , Ct > which are subject to the constraint: Ar ( ai ) > 0, Bs ( bj ) > 0, Ct ( ck ) > 0 .
Thus Ar ( ai ) + Bs ( bj ) + Ct ( ck ) = 1 .
For example:
Ar ( ai ) = 1, Bs ( bj ) = 0.4, Bs + i( bj ) = 0.6, Ct - i( ck ) = 09, Ct ( ck ) = 0.1 Then four tuples are produced:
-
< A ,0.4/ B ,0.9/ C, , > , < A ,0.4/ B ,0.1/ C, > , r , s , t - 1 , r , s , t
-
< A ,0.6/ B ,,0.9/ C , > , < A ,0.6/ B ,,0.1/ C > r , s + 1, t - 1 , r , s + 1, t
In the context considered here, it is not necessary to store the summarized relation rsu . The only additional data that have to be stored are the fuzzy cardinalities whose computation is described in the following subsection.
The method of linguistic summary is based on the fuzzy cardinality calculation and is composed of two phases. The first one is the fuzzification of digital data (transforming each digital datum in linguistic variables). The second one involves merging and calculating the fuzzy cardinality for each linguistic variable (to create a linguistic summary).
In the first phase, the linguistic variable n is considered. All the tuples, of the form
At the same time, the cardinalities are computed as:
FAr , FBs , FCt , FArBs , FArCt , FBsCt , FArBsCt where FAr (resp. FBs , FCt , FArBs , FArCt , FBsCt , FArBsCt ) is a fuzzy set defined by the integers {0, 1, ...} which represent the fuzzy numbers of tuples such as Ar (resp. Bs , Ct , Ar and Bs , Ar and Ct , Bs and Ct , Ar and Bs and Ct ) and which are merged into the tuple under consideration (for all the combinations of labels appearing in at least one tuple of r ). Each cardinality is computed incrementally in the following way; at the beginning:
F Ar = 1/0.
F, = 1/ 0 + ... + 1/ n — 1 + 1 / n + 4 / ( n + 1) + ... " + 4 /( n + k ) + 0/( n + k + 1) + ...
Consider the current value of the fuzzy cardinality as F. with 1 > 4 > ... > 4 > 4 , = 0 and n > 0, k > 0 [16].
Ar 1 k k +1 L J
The computation of F (resp. F , fd n and F. „ ,, ) takes into account the value min(x', y') BsCt ArBsCt
(resp. min(x', z') , min(y', z') , min(x', y', z') ), thus reflecting the fact that the tuple to fuse represents both A and B (resp. A and C , B and C , A and B and C ).
It is important to notice that the maximum number of tuples that can be obtained in Fsu is na x nb x nc [16].
Therefore, the summary obtained by calculating the fuzzy cardinality can be interpreted in a natural language. The summary may be integrated into other research works.
-
B. Algorithms of classification
Today, classification is a process that is applied in many areas. The classification methods are designed to combine the elements of a set X, of any kind, in a small number of classes. The quality of the classification can be judged on the basis of two criteria:
The generated classes should be as different as possible from each other with respect to certain characteristics,
Each class should be as homogeneous as possible vis-à-vis these characteristics.
Several methods, such as Support Vector Machine (SVM), K-Nearest Neighbor (K-NN), and Multilayer Perceptron (MLP), can automatically generate ensembles of classifiers.
Support Vector Machine (SVM): This algorithm performs classification by building a hyperplane or a set of hyperplanes in a high-dimensional space. In addition to performing linear classification, SVM can efficiently perform a non-linear classification using what is called the kernel trick, which is implicitly mapping its inputs into high-dimensional feature spaces. A good separation is achieved by the hyperplane that has the largest distance to the nearest training data points of any class. It is assumed that the larger the margin or distance between these parallel hyperplanes, the better the generalization error of the classifier. An important property of the Support Vector Machine (SVM) method lies in the fact that the determination of the parameters of the model corresponds to a convex optimization problem, and so any local solution is a global optimum [17].
K-Nearest Neighbor (K-NN):
The K-Nearest Neighbor (K-NN) algorithm is amongst the simplest of all machine learning algorithms and should be one of the first choices for a classification task when there is little or no prior knowledge about the distribution of the data. K-nearest neighbor classification was developed to meet the increasing need to perform discriminant analysis when reliable parametric estimates of probability densities are unknown or difficult to determine. The K-Nearest Neighbor algorithm is a nonparametric method, for classification and regression, that predicts “values” of objects or class memberships based on the k closest training examples in the feature space. An object is classified by a majority vote of its neighbors, with the object being assigned to the most common class amongst its k nearest neighbors (k is a positive integer, typically small). If k = 1 then the object is simply assigned to the class of that single nearest neighbor. Usually the Euclidean distance is used as the distance metric [17].
Multilayer perceptron (MLP): Multilayer perceptron (MLP) is a modification of the standard linear perceptron; it can distinguish data that are not linearly separable. It consists of multiple layers of nodes in a directed graph; it is a feed-forward neural network whose processing nodes (neurons) compute the weighted average of its inputs and then transform the average by an activation function such as the hyperbolic tangent and logistic functions. A multilayer perceptron is different from an ordinary perceptron because each neuron uses a nonlinear activation function, which was developed to model the frequency of action potentials, or firing, of biological neurons in the brain. This function can be modeled in several ways, but must always be normalizable and differentiable [17].
Our study intends to use a linguistic summary to create a supervised classification system; the model created uses the similarity between different linguistic summaries.
-
C. Similarity between different linguistic summaries
A brief discussion is given in this section to calculate the degree of similarity between two linguistic summaries and to estimate the metric distance between the two linguistic summaries [18].
Two linguistic summaries are considered at the beginning; they are then written in the form proposed by Yager [13].
A simple linguistic summary is written as: Qy ' sareP .
Example: " Most patients are glucose high ".
A complex linguistic summary is given as: QRy ' sareP .
Example : “ Most young patients are glucose high ”.
Where P is a summary that is associated with a level of truth.T
It is worth reminding that:
-
• Summary P is a subset of attributes that is defined with a linguistic value (fuzzy predicate) in the field of attributes (e.g. high for glucose attribute , as a fuzzy predicate),
-
• Quantifier Q, e.g. more ,
-
• Optionally, qualifier R is another fuzzy set with an attribute having a linguistic value (fuzzy predicate). It is called the fuzzy subset with interest (e.g.: young for the age attribute ).
-
• Truth level T is a number belonging to the interval [0, 1]; it is assessed by the truth level (validity) of the summary P,
Furthermore, according to Wilbik, Keller, and Alexander [19], the similarity between two protoform summaries is the minimum of the four elements that make up the summary. This similarity is between summarizers (P), quantifiers (Q), truth-values (T), and qualifiers (R).
Given two summaries Ls1 and Ls2:
sim (LS , LS ) = min( sim (P ,P ), sim (Q ,Q
), sim (R1, R2),
sim (T ,T ))
or:
a ∫ ( µ p 1 ∩ µ p 2) ∫ ( µ Q 1 ∩ µ Q 2)
1, 2 b , ∫ ( µ p 1 ∪ µ p 2) , ∫ ( µ Q 1 ∪ µ Q 2) ,
1 - (T1,T2),min( ∫ ∫ ( ( µ µ R R 1 1 ∩ ∪ µ µ R R 2 2 ) )),1 - dfoc (R1) - d foc ( R 2) ))
Where:
•
•
Truth level T is a number belonging to the interval [0, 1]; it is assessed by the truth level (validity) of the summary P, a and b are numbers of common attributes for summarizers P1 and P2.
-
• The expressions ∫ ( µ p 1 ∩ µ p 2) , ∫ ( µ Q 1 ∩ µ Q 2)
∫( µp 1 ∪ µp 2) ∫( µQ 1 ∪ µQ 2)
and
∫ ( µ 1 ∩ µ 2) are Jaccard similarity measures [20]. ∫ ( µ R 1 ∪ µ R 2) are Jaccard similarity measures [20].
Also, d is the degree of focus, with
1 n dfoc = n ∑ µ R ( yi ) .
The dissimilarity of two linguistic summaries can be calculated from the similarity of these two linguistic summaries.
d(LS1, LS 2) = 1 - sim (LS1, LS 2) (2)
At last, it is interesting to note that the linguistic summary is an effective way for the compression of heterogeneous data; the results obtained are understandable in natural language as it is possible to calculate the similarity between the linguistic summaries and to find the individual cloud that belongs to both summaries. Then, the linguistic summary becomes a really intelligent summary and can be used in many diagnosis fields.
-
III. Experimentation
This article aims at creating a complete medical linguistic summary template, where two criteria are taken into consideration, i.e. short response time and fast search for information. Moreover, the results must be precise.
In this paper, a scheme for the classification of a medical database is proposed; it is based on the calculation of similarity between fuzzy linguistic summaries.
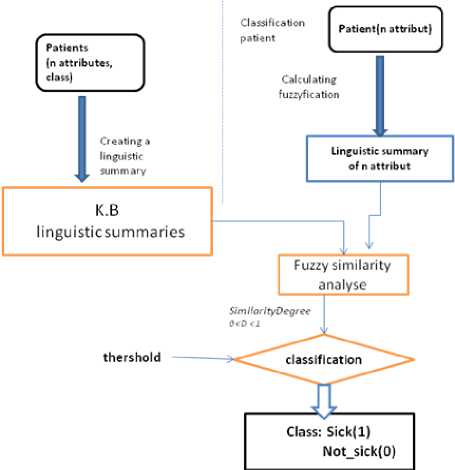
Fig.1. Illustrates the general diagram used in the present work.
Our medical classification system is performed on a given linguistic summary which was developed by the method of Prade and Dubois. This method does not require the learning phase; it updates the linguistic summary quickly and easily.
Our application is divided into two phases:
The first phase is built from a linguistic summary of a medical database; it is based on the calculation of fuzzy cardinality. Te second phase consists of a classification model that is created based on the information obtained from the linguistic summary.
-
A. Medical database
The linguistic summary of two medical datasets, namely the Pima Indian Diabetes Dataset and the Wisconsin Breast Cancer Dataset (WBCD) , was created:
-
• A medical summary based on Pima Indian Diabetes Dataset [21] was built. It involved 392 women. The diagnosis was based on a binary variable value " class ", which helps to know whether the patient shows signs of diabetes, according to the criteria of the World Health Organization (WHO). The eight clinical descriptors are given in Table 1.
Table 1. Description attribute of the pima indian diabetes dataset
|
N attribute |
Description of attribute |
|
1 |
Number of pregnancies (N preg) |
|
2 |
Plasma glucose concentration (Glu, mg/dl) |
|
3 |
Diastolic blood pressure (BP, mm Hg) |
|
4 |
Triceps skinfold thickness (SKIN)(mm) |
|
5 |
Insulin levels after 2 hours (Insulin, mU¼ml) |
|
6 |
Body mass index (BMI)(weight in kg/ m^2 ) |
|
7 |
Diabetes pedigree function (ped) |
|
8 |
Age (years) |
-
• The medical summaries of Wisconsin breast cancer databases (WBCD) [21] were also constructed.
The breast cancer database contains medical information of 699 clinical cases having breast cancer and classified as malignant or benignant; 458 patients (65.5%) were mild cases and 241 patients (34.5%) were malignant.
Table 2. Description of attributes in the Wisconsin breast cancer databases (WBCD)
|
N attribute |
Description of attribute |
|
1 |
Clump Thickness |
|
2 |
Uniformity of Cell Size |
|
3 |
Uniformity of Cell Shape |
|
4 |
Marginal Adhesion |
|
5 |
Single Epithelial Cell Size |
|
6 |
Bare Nuclei |
|
7 |
Bland Chromatin |
|
8 |
Normal Nucleoli |
|
9 |
Mitoses |
-
B. Implementation of a linguistic summary
Let r be the linguistic summary calculation method introduced by the fuzzy cardinality. It consists of two phases (preceding section):
The first one involves fuzzification which consists of the fuzzy quantification of the actual values of a variable. Each attribute is decomposed into a fuzzy subset, according to the experts in the domain, as each t-uplet belongs to one or more fuzzy sets associated with a degree of membership.
Let цд be the membership function of fuzzy set A , Vx e X and ^ e[0,1] .The set A is defined by: A = {(x, цА (x))|x e X} .
This idea is closely related to the Computing with Words Paradigm [9] introduced by Zadeh.
The use of fuzzy terms is very interesting because it provides a consistent language. Human language is intuitive because it can easily be understood by the user. In addition, the user does not have a clear idea about what can be obtained from the stored data. However, with the fuzzy theory, the data can be interpreted in natural language.
The second phase consists in giving a summary by using the algorithm of fuzzy cardinality calculation.
Npreg medium 1.0/0+ 1.0/306 +0.8/325 +0.6/345 0.4/359 0.2/370
Npreg
High 1.0/0 1.0/22 0.8/33 0.6/47 0.39999998/67
0.19999999/86
GLU regular 1.0/0 1.0/154 0.97619045/161 ………………………..
0.04761905/309 0.023809524/310
GLU
High 1.0/0 1.0/82 0.97619045/83 …………………………………
-
Fig.2. Linguistic summary of the Pima Database
Atrl sei 1.O/O+1.O/293+O.8/372+O.5/5OO+O.3/533
se2 1.0/0+1.0/150+0.8/183+0.5/311+0.3/390 Atr2
sei 1.0/0+1.0/470+0.8/508+0.5/538+0.3/563
se2 1.0/0+1.0/120+0.8/145+0.5/175+0.3/213 Atr3
sei 1.0/0+1.0/457+0.8/500+0.532+0.3/561
Se2 1.0/0+1.0/122+0.8/151+0.5/183+0.3/226
-
Fig.3. Linguistic summary of the breast cancer database (WBCD)
The linguistic summary of PIMA Indians Diabetes (figure 2) and the linguistic summary of breast cancer database (figure 3) were obtained; they contain all the essential information needed by the user (qualitative information, quantitative information). The method used minimizes the loss rate used in other compression methods; it also guarantees the quantitative information (fuzzy cardinality) and qualitative information (membership degree in the fuzzy subset).
Exemple:
In Figure 3, the linguistic summary of the attribute 1 ( Atr1 ) of the linguistic variable ( Se1 ) is: 1.0/0 + 1.0/293 + 0.8/372 + 0.5/500 + 0.3/533
This writing is interpretable in natural language. Here the number 0.1 (respectively 0.8, 0.5, 0.3) is represented by a degree of membership in the fuzzy set; the number 293 (respectively 372, 500, 533) represents the number of patients for each degree of membership of the linguistic variable Se1 and attribute Atr1. It can be said that, in the data base, there are 293 patients who all belong to the linguistic variable Se1 and attribute Atr1. Also, there are 79 (372 – 293 = 79) patients who belong partially to the linguistic variable Se1 and attribute Atr1, with a degree of membership = 0.8.
In Figure 2, the linguistic summary of attribute 1 ( Npreg ) of the linguistic variable ( medium ) is:
1.0/0 + 1.0/306 + 0.8/325 + 0.6/345 + 0.4/359 + 0.2/370
This writing is interpretable in natural language. Here the number1.0 (respectively 0.8, 0.6, 0.4, 0.2) is represented by a degree of membership in the fuzzy set and the 306 (respectively 325, 345, 359, 370) represents the number of patients for each degree of membership of the linguistic variable medium and attribute Npreg .
We can say that in the Data Base, there are 325 patients who all belong to the linguistic variable medium and attribute Npreg ; there are 19 (325-306=19) patients who partially belong to the linguistic variable Se1 ( medium ) and attribute Atr1 (Npreg ) with a degree of membership = 0.8.
It is possible to have a perfect summary database that allows having a minimal information loss rate with a better decision.
-
C. Creation of a flexible interrogation
Database summaries provide a means to significantly reduce the volume of inputs for processes that require access to the database. The benefit of downsizing a database is the reduced time of response.
Interrogation summaries are only a first step; all relevant information can be easily recovered from the linguistic summaries. The mechanism of interrogation is effective, and there is no loss of precision in the response.
The main idea is to find a way to obtain a summary that is more intelligent than those reported in other studies in the field. Also, regardless of the search performed on this linguistic database summary, a correct answer can be found without returning back to the numerical database. The response obtained is found to be in accordance with the user’s preferences (doctor). Therefore, one must create a flexible interrogation system that seamlessly fulfills the user’s needs.
Fuzzy quantifiers were introduced by Zadeh using the usual universal and existential quantifiers. One must distinguish the absolute quantifiers, which express a number (about 3, at least 2) and the relative proportional referencing (the majority, about half). The quantified expressions are of type " QX are A ", when it comes to assessing to what extent the elements of “ X are Q A” , as in " about 3 employees are well paid ". The most common form is " QBX are A " where the reference set BX is unclear, as in " most young employees are well paid " (here Q is a linguistic quantifier, A and B are two gradual predicates defined by fuzzy sets, and X is generally a relation from the database).
The linguistic summary of the Pima database or WBCD database contains quantitative and qualitative information. It is interpretable in natural language because it is based on fuzzy logic.
The user finds satisfaction in the content of the request because the form of the proposed request is written in natural language.
Thereby, the search query is written with natural language expressions; it is in the form “ Qy ' areP ”, which was proposed by Yager [13].
The search for the query response allows calculating the scalar product.
Linguistic summaries may be calculated using fuzzy cardinality. A simple request (only one fuzzy predicate), of the form “ Qy ' areP ”, or a complex request, of the form “ QRy ' areP ”, are calculated. The information from F A (F A is a fuzzy cardinality calculation set for each fuzzy subset of attribute A) is used in this calculation.
1 cardi(/^х^ / c _ i =0 /
° p = /cardi ( X )
With 1 > x > ... > x , > x = 0 and n 0 .
1 n — 1 n
Example:
How can a patient be GLU regular?
Consider the simple query:
F 1 = 1.0/0 1.0/163 0.9 /177 0.8 /191 0.7 / 212 0.6 / 237 0.5 / 262
regular
0.4/270 0.3/284 0.2/295 0.1/310
The scalar degree by F ,
_ (163 x 1) + (177 x 0.9) + ... + (310 x 0.1)/ regular 392 ,
S regular = 0.380.
This result means that 38% of patients are GLU regular.
The complex query is: how can young patients be GLU regular?
From F regular л young
Then F regular л young = 0 . 52
This result means that 52% of patients are GLU regular and AGE young.
-
D. Classification approach
In previous works, some authors highlighted the interest of using the linguistic summary in diagnostic support systems, but were not able to create a real diagnostic medical system.
The linguistic summary of the Pima India database and WBCD database provides us with important quantitative and qualitative information for making a medical decision.
In similar works, some researchers performed a supervised classification on the Pima Indians Diabetes database and WBCD database, using SVM, Neural Networks, K-NN, and others [22-27][29][30].
Unfortunately, the execution time in such a system is slow because the classification is done on a large database.
The supervised classification of the linguistic summary of the Pima Indians Diabetes database and WBCD database is discussed in the first section of our article. The condition of the patient should be deduced from le linguistic summary which is based on the calculation of the fuzzy cardinality.
First, a patient is taken as the input with n attributes ax ,..., an , where a ,..., an e R (numerical values), and then the fuzzification is performed (converting each numerical value into one or more linguistic variables with the corresponding membership degrees).
In addition, the information is supplied by the linguistic summary of a medical database, in the form of a fuzzy cardinality.
Each cardinality corresponds to a subset of fuzzy attributes, with the intersection of two fuzzy sets supplied with two different attributes
F , F ,.., F ,..., F .
ai a2 , a ] a an , , an _]A an
The main idea is to create a matrix of similarity, and then calculate the similarity between the linguistic variables of fuzzy subsets of attributes and the intersection of different linguistic variables of various fuzzy subsets, and also the linguistic variable ( patient ) of an attribute ( class ). Note that the attribute (class) represents the patient's state of health that takes a linguistic variable ( sick , not sick ).
We first calculate: Sim (L S ,LS ) .
Then, we put: LS ^ = Qy ' areP and LS^ = Qsicky ' areP .
or Q = most.
Therefore yQ(x) = x
The degree of truth is calculated by the method proposed in [31] as:
n
T ( Qt e RP (t)) = .^ ( a i -a i + 1) x R Q ( i/n ) (3)
Where a is the degree of membership of the attribute.
The linguistic summary is based on the calculation of the fuzzy cardinality. Note that a - a +i is the degree of membership, which is represented by A in our linguistic summary F .
The membership degree A is incremented by a number from the interval [0, 1], with A =1
And
^ Q ( i / n ) =
cardi ( A ) - cardi - 1( A - 1)/
/ cardi ( A n )
sim (LS., LS~ ) = min( sim (P., P~), sim (Q., Q~),
1 2 1 2 1 2 (5)
sim (R , R ), sim (T ,T ))
However, in Almeida’s work [7], it is reported that the dissimilarity is just the difference between the values of T, which is the degree of truth of the language summary.
d(LS1, LS 2) = T1-T2I
Knowing that sim(LS^, LS^) = 1 - d(LS^, LS^)
and using equations (6) and (7), one gets:
sim (LSr LS2) = 1 - T1-T2I(8)
To find the condition of the patients to be classified, we use the Sugeno integral taken between each degree of similarity of a linguistic variable and the degree of membership of each linguistic variable α; α represents the patient.
According to L. Litérard [3], the full Sugeno integral in the linguistic summary is:
C = max(min( a , f ( a ))) (9)
In our case, f(α) is a similarity function for each fuzzy sub-attribute; α is the degree of membership within the fuzzy set of attributes; it has a risk factor.
C = max(min( a , sim ( LS^ , LS^ ))) (10)
For example, the risk factor of the attribute Glucose in a fuzzy subset is represented by the linguistic variable ( High ).
Our contribution aims at using a medical linguistic summary in a supervised classification system in order to determine the patient’s state of health. It is possible to find the patient’s class ( sick or not sick ), using the Sugeno integral between the degree of membership of each fuzzy subset of the patient and the similarity between linguistic summaries. This is elaborated in the following algorithm.
Our purpose is first to create a classification model using the information provided by our linguistic summary, which was developed by updating the medical data. In the second phase of our model, an attempt is made to deduce the patient’s state of health based on the calculation of similarities between the linguistic summaries of our knowledge base and the linguistic variables related to the patient’s attributes. The patient’s state of health may be deduced using Sugeno’s approach. To do this, the following algorithm is proposed:
According to [19], the similarity of the linguistic summary is
Algorithm
Input A is an attribute, N number of attributes
Input r are linguistic summaries
Output the validity degree C
Process:
L= 0;
For i ^ 1 to N do
( Si , µ i ) = fuzzification ( Ai ) ;
L ^ L+1;
End for;
For i ^ 0 to L do
T ← degree of truth( LS ) ;
T ← degree of truth( LS ) ;
sim (LS , LS ) ← 1 - T 1 - T 2 ;
End for;
C ← max(min( µ , sim ( LS , LS ))) ;
Return C
The execution of this algorithm is explained through the following example:
Either database is PIMA Indiana diabetes.
Here T1 is the degree of truth of each fuzzy set, and T2 is the degree of truth of the intersection between different fuzzy subsets and the fuzzy subset ( sick ).
The following table displays the similarity between the fuzzy subsets.
Inputs:
A patient has 8 attributes (2.0, 179.00, 70.0, 45.0,
543.00, 30.5, 0.15, 53.0) with the linguistic summary of Pima Indian Diabetes database, based on the computation of fuzzy cardinality. We have assigned the value 0.8 to the clustering threshold. It is well known that: sim (LS , LS ) = 1 - T 1 - T 2
Table 3. Fuzzification table of patient attributes
|
Nbgross |
Glu |
Age |
||
|
SE |
Regular High |
Regular High |
Regular high |
|
|
µ |
0 1 |
1 0 |
0.375 0.625 |
The similarity matrix between LS1 and LS2 is calculated in order to get table 5. Knowing that sim(LS ,LS ) = 1 - T1-T2, it becomes possible to calculate T1 and T2 for each fuzzy subset.
Table 4. Table of Values of T1, T2
|
Nbgross |
Glu |
Age |
||
|
SE |
Regular High |
Regular high |
Regular high |
|
|
T1 |
0,9 0.8 |
0.8 0.6 |
0.923 0.0.41 |
|
|
T2 |
0.6 0.5 |
0.4 0.5 |
0.58 0.41 |
Table 5. table of similarities
|
Nbgross |
Glu |
PED |
Age |
||
|
SE |
High |
High |
high |
High |
|
|
α i |
0 |
0 |
0 |
0.625 |
|
|
Sim |
0.7 |
0.9 |
0.87 |
0.98 |
T1 represents the degree of truth for each fuzzy set and T2 represents the degree of truth for the intersection between different fuzzy subsets and the fuzzy subset “ sick ”.
Let’s calculate the class using the Sugeno integral:
C = max(min( α , sim ( LS , LS )))
C = max(0.0, 0.9,0.37,0.9,0.9, 0.0, 0.0,0.62)
C = 0.9
Since C ≥ 0.5 , then the patient is classified as Diabetic .
After verification in the PIMA database, the attribute class = 1 is found, which means that this result is true positive (TP).
Another example:
A patient with 8 attributes (2.0, 99.00, 60.0, 17.0,
160.0, 36.6, 0.453, 21.0)
C = 0.0625
As class C ≤ 0.5 , then the patient is classified as Not Diabetic .
After verification in the PIMA database, the attribute class = 0 is found, which means that this result is true.
-
IV. Results and Discussion
The linguistic summary, based on the medical database PIMA, is interpretable in natural language. It uses linguistic variables with their degrees of membership. It allows searching for a response to the user's request. The query is written in a form close to that of the user's language, rapidly and with transparency. It can be noted that the search response time is very short. The search time in the linguistic summary is 7 milliseconds. The search time in the digital database is 1 second and 108 milliseconds.
Our contribution uses the linguistic summary of the PIMA Indians Database as well as the WBCD database to carry out a supervised classification. The quantitative and qualitative information on the linguistic summary is considered as interpretable knowledge. The calculation of the metric distance proposed by [20] allows us to calculate the degree of similarity between two linguistic summaries. In this work, the degree of similarity is calculated between each fuzzy subset and the intersection of each fuzzy subset with the subset state of the patient; the attribute is "condition". This calculation gives us a cloud of membership of the two fuzzy subsets. Finally, the Sugeno integral is calculated to determine whether the patient is sick or not sick.
The performances of the fuzzy classifier system were evaluated using the following parameters:
CC = TP+TN/(TP+TP+FP+FN)*100, which is the correct classification rate,
With the error rate FP+FN/(TP+TP+FP+FN)*100,
The sensitivity Se = TP/(TP+FN)*100 is the true positive rate,
The specificity Sp = TN/(TN+FP)*100 is the fraction of nonevents that has been correctly rejected.
Also TP, TN, FP and FN denote:
TP: True Positive, which classifies a sick person as Sick,
TN: True Negative, which classifies a healthy person as Not Sick,
FP: False Positive, which classifies a healthy person as Sick,
And FN: False Negative, which classifies a sick person as Not Sick.
Therefore, 80 classification tests were performed on 80 patients in the Pima Indians database. The clustering threshold value of 0.8 was assigned to this database. Also, 80 classification tests were performed on 80 patients in the database WBCD (breast cancer). The clustering threshold value of 0.5 was assigned to this database. As a result, the table below is obtained.
Table 6. Table of results
|
PIMA database |
WBCD database |
|
|
Classification rate |
83% |
95% |
|
Error rate |
17% |
5% |
|
Sensibility |
91% |
100% |
|
Specificity |
79% |
94% |
In Table 6, the classification rate is high, which means that this system provides efficient classification results.
Consequently, one can say that our classification system is effective, easy and fast as it is based on the theory of fuzzy logic. We developed the classification of the linguistic summaries already made, instead of classifying the numerical databases.
Our model increases the sensitivity, specificity and classification rates. Therefore, it may be stated that this model gives the best classification performances. It is also possible to say that the classifiers have a good recognition rate of the minority classes and the majority classes.
Comparative study of related works:
This section is intended to compare the classification accuracy of our method with those of other methods, applied to the same database:
A comparative study was conducted between the results obtained using the summary linguistic classification of those from a classical classification.
Note : In this section, the tests were performed using three classification techniques (CNMC, SVM and K-PPV) and two sets of medical data (PIMA, WDBC) with the objective to give a better interpretation of the results.
Works were tested on the WDBC database and the
PIMA database. Table 7 displays the classification accuracies of our method and those of other methods employing the WDBC database and the PIMA database.
Table 7. Comparative table with related works and our work
|
DATA BASE |
Method |
Classification Accuracy (%) |
|
PIMA |
MLP |
73.85 |
|
SVM |
83.85 |
|
|
K-NN |
80 |
|
|
Our work |
83 |
|
|
WBCD |
MLP |
96.32 |
|
SVM |
97.37 |
|
|
K-NN |
96.32 |
|
|
Our work |
95 |
Tables 6 and 7 - Classification accuracies obtained with our method and other classifiers in the literature (WDBC and PIMA)
According to Table 6, our classification is faster and more efficient. A classification rate of 95% and 83% was found with our linguistic summaries. The results obtained in the present study are much more interesting than the ones reported in the literature. One can easily notice that the classification rates of 95 % and 83% obtained in this work are similar to those found in some other research studies.
Our system is precise and interpretable in natural language; it uses fuzzy logic.
There is no need for the optimization phase, which is encountered in some other fuzzy inference systems for classification works.
This is a comprehensive summary model which is interpretable in natural language; it is a combination of the flexible query system and the supervised classification.
The results obtained are encouraging, and they may be improved in future research works.
-
V. Conclusion
The present work aimed at constructing a model of a medical summary that can be interpreted in natural language, similar to the one used in daily communication among humans (doctor). It is a quick and flexible query system that responds to the user's specific needs.
Moreover, a supervised medical system was created from linguistic summaries. The classification was done using quantitative and qualifying information produced by our linguistic summary, by calculating the potential similarities.
These queries were processed using the scalar product (as proposed by Parde and Dubois), based on the list of fuzzy cardinalities and according to the user's request.
Then, a supervised classification system was constructed from the linguistic summary of the digital base. The classification was done using the quantitative and qualitative information recorded in our linguistic summary and also by calculating the similarity between the different linguistic summaries.
One can notice that the classification rate obtained in this work is the same as that found in other research studies.
This is a comprehensive summary model which is interpretable in natural language; it is the combination of the flexible query system and the supervised classification.
The results obtained are encouraging, and it is possible to improve this model in future studies.
Our hope is to integrate this model in several medical databases, with heterogeneous data and a complete medical care record.
Our linguistic summary may be used in various medical diagnostic research areas. This model may be combined with other classification methods.
References Extracting a linguistic summary from a medical database
- J. Nin, P. Salle, S. Bringay, and M. Teisseire, “Using owa operators for gene sequential pattern clustering,” in Computer-Based Medical Systems, 2009. CBMS 2009. 22nd IEEE International Symposium on, 2009, pp. 1–4.
- S. T. Rosenbloom, R. A. Miller, K. B. Johnson, P. L. Elkin, and S. H. Brown, “Interface terminologies facilitating direct entry of clinical data into electronic health record systems,” J. Am. Med. Informatics Assoc., vol. 13, no. 3, pp. 277–288, 2006.
- L. Liétard, “A functional interpretation of linguistic summaries of data,” Inf. Sci. (Ny)., vol. 188, pp. 1–16, 2012.
- P. Bosc and O. Pivert, “SQLf: a relational database language for fuzzy querying,” Fuzzy Syst. IEEE Trans., vol. 3, no. 1, pp. 1–17, 1995.
- D. Dubois and H. Prade, “On data summarization with fuzzy sets,” fifth IFSA World Congr., vol. 1, pp. 465–468, 1993.
- M. Ros, M. Pegalajar, M. Delgado, A. Vila, D. T. Anderson, J. M. Keller, and M. Popescu, “Linguistic summarization of long-term trends for understanding change in human behavior,” in Fuzzy Systems (FUZZ), 2011 IEEE International Conference on, 2011, pp. 2080–2087.
- R. J. Almeida, M.-J. Lesot, B. Bouchon-Meunier, U. Kaymak, and G. Moyse, “Linguistic summaries of categorical time series for septic shock patient data,” in Fuzzy Systems (FUZZ), 2013 IEEE International Conference on, 2013, pp. 1–8.
- A. Wilbik, J. M. Keller, and G. L. Alexander, “Linguistic summarization of sensor data for eldercare,” in Systems, Man, and Cybernetics (SMC), 2011 IEEE International Conference on, 2011, pp. 2595–2599.
- L. A. Zadeh, “Fuzzy sets,” Inf. Control, vol. 8, no. 3, pp. 338–353, 1965.
- L. A. Zadeh, “A computational approach to fuzzy quantifiers in natural languages,” Comput. Math. with Appl., vol. 9, no. 1, pp. 149–184, 1983.
- W. A. Voglozin, G. Raschia, L. Ughetto, and N. Mouaddib, “Querying the saintetiq summaries-dealing with null answers,” in Fuzzy Systems, 2005. FUZZ’05. The 14th IEEE International Conference on, 2005, pp. 585–590.
- L. Ughetto, W. A. Voglozin, and N. Mouaddib, “Database querying with personalized vocabulary using data summaries,” Fuzzy Sets Syst., vol. 159, no. 15, pp. 2030–2046, 2008.
- R. R. Yager, “A new approach to the summarization of data,” Inf. Sci. (Ny)., vol. 28, no. 1, pp. 69–86, 1982.
- D. Rasmussen and R. R. Yager, “A fuzzy SQL summary language for data discovery,” Fuzzy Inf. Eng. A Guid. tour Appl., pp. 253–264, 1997.
- J. Chomicki, “Preference formulas in relational queries,” ACM Trans. Database Syst., vol. 28, no. 4, pp. 427–466, 2003.
- O. Pivert, A. Hadjali, and G. Smits, “Estimating the relevance of a data source using a fuzzy-cardinality-based summary,” in Intelligent Systems (IS), 2010 5th IEEE International Conference, 2010, pp. 96–101.
- R. D’Ambrosio, “Handling imbalanced datasets by reconstruction rules in decomposition schemes,” Universit{é} Nice Sophia Antipolis; Universit{à} Campus Bio-Medico di Roma, 2014.
- A. Wilbik and J. M. Keller, “A fuzzy measure similarity between sets of linguistic summaries,” Fuzzy Syst. IEEE Trans., vol. 21, no. 1, pp. 183–189, 2013.
- A. Wilbik, J. M. Keller, and G. L. Alexander, “Similarity evaluation of sets of linguistic summaries,” Int. J. Intell. Syst., vol. 27, no. 10, pp. 926–938, 2012.
- A. Wilbik and J. M. Keller, “A distance metric for a space of linguistic summaries,” Fuzzy Sets Syst., vol. 208, pp. 79–94, 2012.
- K. Bache and M. Lichman, “UCI machine learning repository (http://archive. ics. uci. edu/ml). University of California, School of Information and Computer Science,” Irvine, CA, 2013.
- M. Sekkal and M. A. Chikh, “NEURO�GENETIC APPROACH TO CLASSIFICATION OF CARDIAC ARRYTHMIAS,” J. Mech. Med. Biol., vol. 12, no. 01, p. 1250010, 2012.
- I. Nedjar, M. EL HABIB DAHO, N. Settouti, S. Mahmoudi, and M. A. Chikh, “RANDOM FOREST BASED CLASSIFICATION OF MEDICAL X-RAY IMAGES USING A GENETIC ALGORITHM FOR FEATURE SELECTION,” J. Mech. Med. Biol., vol. 15, no. 02, p. 1540025, 2015.
- R. Periyasamy, D. Joshi, S. Atreya, and S. Anand, “LDA aided threshold to classify neuropathy and non neuropathy in diabetic patients,” Int. J. Biomed. Eng. Technol., vol. 7, no. 4, pp. 315–326, 2011.
- J. X. Huang, A. An, and Q. Hu, “Medical search and classification tools for recommendation,” in Proceedings of the 33rd international ACM SIGIR conference on Research and development in information retrieval, 2010, p. 707.
- K. M. Al-Aidaroos, A. A. Bakar, and Z. Othman, “Medical Data Classification with Naive Bayes Approach.pdf,” Information Technology Journal, vol. 11, no. 9. pp. 1166–1174, 2012.
- Y. Bodyanskiy, O. Vynokurova, V. Savvo, T. Tverdokhlib, and P. Mulesa, “Hybrid clustering-classification neural network in the medical diagnostics of reactive arthritis,” arXiv Prepr. arXiv1610.07857, 2016.
- A. Goshvarpour, H. Ebrahimnezhad, and A. Goshvarpour, “Classification of epileptic EEG signals using time-delay neural networks and probabilistic neural networks,” Int. J. Inf. Eng. Electron. Bus., vol. 5, no. 1, p. 59, 2013.
- J. M. Education, C. Science, S. Lanka, and S. Lanka, “The Effect of Evolutionary Algorithm in Gene Subset Selection for Cancer Classification,” J. Mod. Educ. Comput. Sci., no. July, pp. 60–66, 2018.
- R. Saravana, “Medical Big Data Classification Using a Combination of Random Forest Classifier and K- Means Clustering,” I.J. Intell. Syst. Appl., no. November, pp. 11–19, 2018.
- M. Delgado, D. Sánchez, and M. A. Vila, “Fuzzy cardinality based evaluation of quantified sentences,” Int. J. Approx. Reason., vol. 23, no. 1, pp. 23–66, 2000.
