Fault Diagnosis of Mixed-Signal Analog Circuit using Artificial Neural Networks

Author: Ashwani Kumar Narula, Amar Partap Singh
Journal: International Journal of Intelligent Systems and Applications(IJISA) @ijisa
Article in issue: 7 vol.7, 2015.
Free access
This paper presents parametric fault diagnosis in mixed-signal analog circuit using artificial neural networks. Single parametric faults are considered in this study. A benchmark R2R digital to analog converter circuit has been used as an example circuit for experimental validations. The input test pattern required for testing are reduced to optimum value using sensitivity analysis of the circuit under test. The effect of component tolerances has also been taken care of by performing the Monte-Carlo analysis. In this study parametric fault models are defined for the R2R network of the digital to analog converter. The input test patterns are applied to the circuit under test and the output responses are measured for each fault model covering all the Monte-Carlo runs. The classification of the parametric faults is done using artificial neural networks. The fault diagnosis system is developed in LabVIEW environment in the form of a virtual instrument. The artificial neural network is designed using MATLAB and finally embedded in the virtual instrument. The fault diagnosis is validated with simulated data and with the actual data acquired from the circuit hardware.
Mixed-Signal Circuit, Sensitivity Analysis, Monte-Carlo Analysis, Artificial Neural Network, Virtual Instrument
Short address: https://sciup.org/15010728
IDR: 15010728
Text of the scientific article Fault Diagnosis of Mixed-Signal Analog Circuit using Artificial Neural Networks
Fault diagnosis includes fault detection and fault isolation. Generally digital circuits are the parts of all the electronic systems. The tendency of the fault occurrence is in the analog part of the electronic system. Circuit nonlinearities, component tolerances and due to availability of the poor fault models, the fault diagnosis process in the analog and the mixed-signal analog circuits is a bottleneck in the circuit testing leading to slow evolution in the fault diagnosis processes. Hence fault diagnosis is the major component in the mixed-signal circuit design. Faults in mixed-signal analog circuit are categorized as catastrophic (Hard) faults and parametric (soft) faults. Catastrophic faults occur due to the open and short circuit conditions in the circuit under test. On the other hand parametric faults are because of variation in the values of the circuit components.
The methodologies in the fault diagnosis of analog and the mixed-signal circuit design involve, one using the external testing systems and second Built-In-Self Test (BIST). The results of the test methodologies based on these have been reported for the different benchmark circuits. In the study [1] fault diagnosis based on behavior modeling and hardware description language in digital to analog converter has been reported. This method uses circuit level sensitivity analysis. A built in self test technique with input stimulus using ramp generator is given in [2]. This method is implemented using Tspice and used the simulated data. With this fault diagnosis efficiency achieved is 95.22%. Fault diagnosis in digital to analog converter [3] covers the catastrophic faults. Genetic algorithm is used to generate the optimum test patterns needed for fault diagnosis. A built in self test technique is used for the fault diagnosis in digital to analog converter [4]. The circuit testing is done for the different architectures of the circuit under test. Soft fault diagnosis in digital to analog converter using wavelet analysis is done in [5]. A hundred percent fault diagnosis efficiency is reported with this method. This method represents simulation results and lacks fault diagnosis with real time data. Some of the fault diagnosis results for the mixed signal analog circuit using fuzzy math are also reported [6]. A review of the fault diagnosis in electronic systems based on artificial intelligent technique is presented in [7], [8]. This leads to the intelligent fault diagnosis system design in mixed-signal analog circuits. It has been observed from the above discussion that although different fault diagnosis methodologies are presented yet these lacks their implementation in real time domain using actual data obtained from the circuit hardware.
In this paper, parametric fault detection in mixed-signal analog circuit using artificial neural networks has been presented. The parametric variations in the component values are analyzed using Monte-Carlo analysis of the circuit under test. The optimum number of the input test patterns is selected using sensitivity analysis in fault diagnosis process. The experimental fault diagnosis results have been presented both with simulated as well as with real time data.
Finally, development of a virtual instrument using LabVIEW software is given which not only acts as an independent fault diagnosis system but also displays the results visually. The data acquisition in real time implementations is done with NIELVIS II board. Parametric fault diagnosis is implemented and tested for a benchmark R2R digital to analog converter circuit [9].
-
II. Proposed Method
The method is categorized as circuit response measurement, fault classification and development of virtual instrument.
-
A. Circuit Response Measurement
In the circuit response measurements the circuit is simulated with the Multisim software to get the simulated data. In the real time the data is acquired with the data acquisition system of NIELVIS II board. The optimum number of the input stimulus required for the fault diagnosis process are acquired by analyzing the response data using sensitivity analysis of the circuit under test. Change occurred in the measured response with the change of circuit parameters is known as circuit sensitivity [10]. If the response of the circuit is with respect to the parameter of the component , the sensitivity is denoted by , and is defined as
Д у ]
У > = x d y (1) Д х у д х
х
The equation (1) is a general equation for sensitivity and can be used to evaluate the variation of circuit output, relative to a change in value of any circuit component. It represents that the percentage that the dependent variable changes, with respect to the percentage that the independent variable changes, .Taking the limit as the change in x approaches to zero evaluates this ratio for small variations. Sensitivity can be positive or negative.
, у _ lim
'х ” А х ^ 0 ‘
Positive sensitivity means the response function increases as the variation in the component parameter increases and in negative sensitivity response function decreases as the variation in component parameter increases or vice versa.
The analog output of R2R digital to analog converter is represented as a fraction of the reference = where is analog output, D is digital input code, N is number of digital bits and is the reference voltage.
The sensitivity analysis of the DAC determines the effects of the various register values affecting the output of the circuit. It is seen that each resistances in the R2R network has different sensitivity values for each combination of digital input data.
The fault models are selected with parametric variation ±50% in the resistance values of the R2R network. Parametric behavior of the components is checked by performing the Monte-Carlo analysis. The sensitivity of all the resistances is calculated for each run of all the defined fault models. These sensitivity values are used to derive the number of digital input combinations required to correctly diagnose the faults. The optimum numbers of input digital combinations required for the fault diagnosis process are derived from these sensitivity values of different components.
-
B. Fault Classification
The sensitivity analysis gives the optimum number of the input digital combinations required for the fault diagnosis. These input combinations are applied for each Monte-Carlo run of each defined fault model to get the output response of the circuit under test. The fault classification includes the preparation of the fault dictionary and then the desgin of the artificial neural network. The fault dictionary includes the values of the output responses for the different fault models. Total number of fault models, output response values and number of Monte-Carlo runs decide the size of the fault dictionary. The proposed artificial neural network model used for the fault diagnosis in mixed-signal analog circuit is shown in the Fig.1.
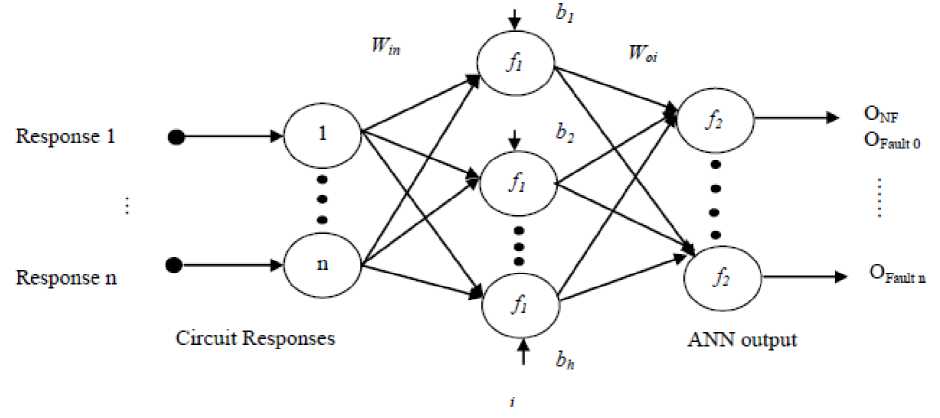
Fig. 1. Proposed ANN Model for the Fault Diagnosis in Mixed-Signal Analog Circuit
It is a multilayer artificial neural network containing input layer neurons, hidden layer neurons and the output layer neurons [11],[12]. The number of input layer neurons are equal to the number of output responses obtained from optimum number of inputs and the number of output layer neurons are equal number of fault models including fault free state of mixed-signal analog circuit.
The neurons in the hidden layer are varied to get the minimum error for the best fault classification. The artificial neural network is trained by using error back propagation training algorithm. It implements training in forward and the back propagation phase. In the forward phase the inputs are applied to the neural network and the output response is collected, by keeping fixed network weights. In the second phase of training the error propagates back and the weights are changed according to the error produced. The error produced is the difference of the actual output value of ANN and the required target output value of the artificial neural network.This training process is repeated until the output values with minimum error is obtained. Mean square error has been taken as the performance metric for artificial neural network and is given as
N 2
MSE = I T - Y nn n = 1
Where T and Y are the target output and output of artificial neural network respectively. In this work artificial neural network is designed and debugged in MATLAB software.
-
C. Virtual Instrument Design
The virtual instrument designed in LabVIEW software contains two parts block diagram and the front panel [13]. The block diagram involves the graphical code of the fault diagnosis system and the front panel contains displays of the input response values, output of artificial neural network and the fault indicators. It serves as an independent fault diagnosis system and is tested both for the simulation and real time data.
-
III. Experimental Validation
The proposed method described in the previous section is applied to a benchmark four bit R2R digital to analog converter mixed signal analog circuit. As this mixed-signal analog circuit has already been used as an example circuit in other fault diagnosis studies and is found to be a suitable choice. The fault diagnosis is validated both for simulated and real time data obtained from the circuit hardware
-
A. Illustration
The circuit shown in Fig. 2 is the benchmark four bit R2R digital to analog converter mixed signal analog circuit We have taken up this mixed-signal analog circuit to illustrate the proposed method.
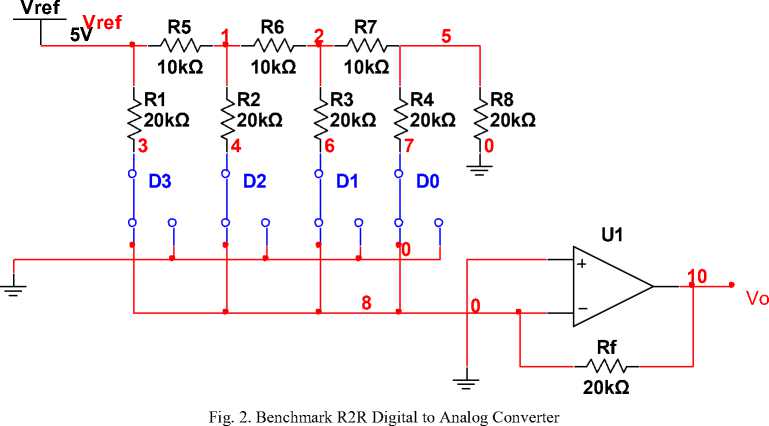
The output voltage of the circuit under test is given by the equation
Rf Г Do DI
KA = -f У r -0 + ^ + ^- + -^(3)
0 R ref 16 8 42
Where R=10KΩ and hence 2R=20KΩ. Therefore the values of the resistances in the R2R network of digital to analog converter are R1= R2=R3=R4=R8=20KΩ and R5=R6=R7=10KΩ. Sixteen fault models namely R1(+),
R1(-), R2(+), R2(-), R3(+), R3(-), R4(+), R4(-), R5(+), R5(-), R6(+), R6(-), R7(+), R7(-), R8(+) and R8(-) two for each of the resistances R1 to R8 are defined. The (+) and (-) represents the parametric variation in the component value +50% and -50% respectively. The output response of the DAC is measured for all the sixteen combinations of the input digital signal for all fault and fault free models and the response of the circuit is noted, keeping value of other components within their tolerance limit. 50 Monte Carlo runs are carried out for all the fault models and for the fault free condition. The output response of the circuit under test is measured for each run to prepare the fault dictionary. The parametric variation in resistance values remains within the ±5% of its nominal value under fault free conditions.
Now to keep the number of test inputs optimum for fault diagnosis, the sensitivity analysis of the circuit under test is performed using of MULTISIM software for each simulation run of the Monte-Carlo analysis for all the fault models. The Table 1 shows the sensitivity of various components under no fault conditions. Similarly the sensitivities of the circuit components have been found for all the parametric fault models and for each Monte-Carlo run.
Table 1. Sensitivities of Various Components under No Fault Condition
|
R1 |
R2 |
R3 |
R4 |
R5 |
R6 |
R7 |
R8 |
|
|
0001 |
0 |
-7.8126 |
-9.76672 |
20.97333 |
31.24883 |
23.43545 |
21.47821 |
-10.2591 |
|
0010 |
0 |
-15.6256 |
42.94473 |
-4.88396 |
62.49611 |
46.86742 |
-19.5359 |
-4.88396 |
|
0011 |
0 |
-23.439 |
33.18879 |
16.09994 |
93.74203 |
70.29607 |
1.95306 |
-15.1482 |
|
0100 |
0 |
93.72108 |
-7.81318 |
-1.95329 |
124.9861 |
-31.2527 |
-7.81318 |
-1.95329 |
|
0101 |
0 |
85.91342 |
-17.5819 |
19.02451 |
156.2293 |
-7.81262 |
13.66939 |
-12.2144 |
|
0110 |
0 |
78.10505 |
35.14037 |
-6.83822 |
187.4705 |
15.62408 |
-27.3529 |
-6.83822 |
|
0111 |
0 |
70.2964 |
25.38233 |
14.14999 |
218.7106 |
39.05738 |
-5.85975 |
-17.1043 |
|
1000 |
249.9485 |
0 |
0 |
0 |
0 |
0 |
0 |
0 |
|
1001 |
249.9495 |
-7.81263 |
-9.76674 |
20.974 |
31.249 |
23.43561 |
21.47847 |
-10.2591 |
|
1010 |
249.9497 |
-15.6256 |
42.94553 |
-4.88396 |
62.4965 |
46.86784 |
-19.5358 |
-4.88396 |
|
1011 |
249.9503 |
-23.4391 |
33.18931 |
16.10035 |
93.74267 |
70.29682 |
1.95307 |
-15.148 |
|
1100 |
249.9501 |
93.72225 |
-7.8132 |
-1.9533 |
124.9871 |
-31.2528 |
-7.8132 |
-1.9533 |
|
1101 |
249.9509 |
85.91444 |
-17.5818 |
19.02507 |
156.2306 |
-7.81265 |
13.66952 |
-12.2143 |
|
1110 |
249.9509 |
78.10593 |
35.14094 |
-6.83819 |
187.4722 |
15.62417 |
-27.3528 |
-6.83819 |
|
1111 |
249.9514 |
70.29715 |
25.38266 |
14.15032 |
218.7127 |
39.05769 |
-5.85977 |
-17.104 |
Table 2. Fault Dictionary Containing the Sample Values of Circuit Responses for Proposed Parametric Faults.
|
Test Input |
1 0001 |
0010 |
0011 |
0100 |
0101 |
0110 |
0111 1 |
1000 |
|
|
Fault Models |
Response Output |
||||||||
|
No Fault |
Simulated |
-0.62192 |
-1.2469 |
-1.87154 |
-2.49682 |
-3.12128 |
-3.74638 |
-4.37114 |
-4.99655 |
|
Real time |
-0.62262 |
-1.23888 |
-1.8603 |
-2.4714 |
-3.09217 |
-3.70907 |
-4.33145 |
-4.9029 |
|
|
R1(+) |
Simulated |
-0.6219 |
-1.2469 |
-1.87154 |
-2.49682 |
-3.12128 |
-3.74638 |
-4.37114 |
-3.33023 |
|
Real time |
-0.6223 |
-1.23824 |
-1.85933 |
-2.47075 |
-3.0912 |
-3.70875 |
-4.32984 |
-3.29006 |
|
|
R1(-) |
Simulated |
-0.62192 |
-1.2469 |
-1.87154 |
-2.49682 |
-3.12128 |
-3.74638 |
-4.37114 |
-9.99555 |
|
Real time |
-0.61781 |
-1.23208 |
-1.85144 |
-2.46097 |
-3.07991 |
-3.69594 |
-4.31623 |
-9.59228 |
|
|
R2(+) |
Simulated |
-0.67874 |
-1.36054 |
-2.042 |
-1.81521 |
-2.49645 |
-3.17834 |
-3.8599 |
-4.99655 |
|
Real time |
-0.67446 |
-1.34524 |
-2.02147 |
-1.79955 |
-2.47473 |
-3.14671 |
-3.82367 |
-4.89594 |
|
|
R2(-) |
Simulated |
-0.49692 |
-0.99689 |
-1.49651 |
-3.99636 |
-4.4959 |
-4.99606 |
-5.49589 |
-4.99655 |
|
Real time |
-0.49771 |
-0.99263 |
-1.49161 |
-3.91362 |
-4.41369 |
-4.91163 |
-5.41818 |
-4.8993 |
|
|
R3(+) |
Simulated |
-0.6946 |
-0.92731 |
-1.62455 |
-2.55497 |
-3.25212 |
-3.48487 |
-4.18225 |
-4.99655 |
|
Real time |
-0.69012 |
-0.92243 |
-1.61369 |
-1.61369 |
-3.21572 |
-3.44864 |
-4.14106 |
-4.8986 |
|
|
R3(-) |
Simulated |
-0.47309 |
-1.9013 |
-2.37727 |
-2.37776 |
-2.85336 |
-4.28185 |
-4.75792 |
-4.99655 |
|
Real time |
-0.47445 |
-1.87322 |
-2.35071 |
-2.3521 |
-2.82753 |
-4.22907 |
-4.70733 |
-4.89957 |
|
|
R4(+) |
Simulated |
-0.46493 |
-1.28346 |
-1.75102 |
-2.51144 |
-2.97887 |
-3.79757 |
-4.26523 |
-4.99655 |
|
Real time |
-0.46518 |
-1.27103 |
-1.73723 |
-2.48129 |
-2.94714 |
-3.75472 |
-4.22142 |
-4.8974 |
|
|
R4(-) |
Simulated |
-0.93776 |
-1.17335 |
-2.11398 |
-2.46741 |
-3.40776 |
-3.6434 |
-4.58423 |
-4.99655 |
|
Real time |
-0.92806 |
-1.16314 |
-2.09379 |
-2.43918 |
-3.36895 |
-3.6047 |
-4.53709 |
-4.89994 |
|
|
R5(+) |
Simulated |
-0.49693 |
-0.99691 |
-1.49657 |
-1.99688 |
-2.49636 |
-2.9965 |
-3.4963 |
-4.99655 |
|
Real time |
-0.49526 |
-0.98718 |
-1.48377 |
-1.97703 |
-2.47339 |
-2.96663 |
-3.4642 |
-4.89925 |
|
|
R5(-) |
Simulated |
-0.83025 |
-1.66354 |
-2.49648 |
-3.33006 |
-4.16281 |
-4.99618 |
-5.82922 |
-4.99655 |
|
Real time |
-0.8242 |
-1.64408 |
-2.4688 |
-3.28814 |
-4.11344 |
-4.93327 |
-5.76296 |
-4.9001 |
|
|
R6(+) |
Simulated |
-0.52325 |
-1.04956 |
-1.57555 |
-2.62841 |
-3.15417 |
-3.68059 |
-4.20669 |
-4.99655 |
|
Real time |
-0.52178 |
-1.04031 |
-1.5636 |
-2.59814 |
-3.12094 |
-3.64067 |
-4.16477 |
-4.90047 |
|
|
R6(-) |
Simulated |
-0.76614 |
-1.53531 |
-2.30413 |
-2.3045 |
-3.0732 |
-3.84253 |
-4.6115 |
-4.99655 |
|
Real time |
-0.76163 |
-1.51802 |
-2.2816 |
-2.27888 |
-3.0421 |
-3.80025 |
-4.56503 |
-4.90052 |
|
|
R7(+) |
Simulated |
-0.53028 |
-1.33025 |
-1.8632 |
-2.53016 |
-3.06295 |
-3.86308 |
-4.39614 |
-4.99655 |
|
Real time |
-0.52782 |
-1.31722 |
-1.84615 |
-2.49931 |
-3.02794 |
-3.82453 |
-4.35489 |
-4.90214 |
|
|
R7(-) |
Simulated |
-0.7516 |
-1.12895 |
-1.88333 |
-2.44965 |
-3.20381 |
-3.58123 |
-4.33576 |
-4.99655 |
|
Real time |
-0.74585 |
-1.11837 |
-1.86591 |
-2.41967 |
-3.16667 |
-3.54016 |
-4.28907 |
-4.90222 |
|
|
R8(+) |
Simulated |
-0.69871 |
-1.28346 |
-1.98493 |
-2.51144 |
-3.21271 |
-3.79757 |
-4.49918 |
-4.99655 |
|
Real time |
-0.69606 |
-1.27222 |
-1.96995 |
-2.48202 |
-3.17918 |
-3.75719 |
-4.45603 |
-4.89852 |
|
|
R8(-) |
Simulated |
-0.46743 |
-1.17335 |
-1.64342 |
-2.46741 |
-2.93734 |
-3.6434 |
-4.11357 |
-4.99655 |
|
Real time |
-0.46503 |
-1.16137 |
-1.62723 |
-2.43721 |
-2.9027 |
-3.60063 |
-4.06707 |
-4.89739 |
|
It has been concluded from these sensitivity values of the circuit components that the test inputs with input digital value 1 to 8 are optimum to diagnose the proposed faults. Finally a fault dictionary has been prepared for the responses of the circuit under test for the optimum number of test patterns derived from the sensitivity analysis of the mixed-signal analog circuit. The Table 2 shows the fault dictionary containing sample value of the output response of simulated and real time data for all the defined fault models.
-
B. Fault Classification
A backpropagation artificial neural network is designed for the fault classification process. The proposed architecture of the artificial neural network has been designed using artificial neural network tool box of MATLAB software. The input layer of the artificial neural network contains 8 inputs as there are 8 distinguish features in the form of output responses of the circuit under test. The output layer of ANN contains 17 outputs, 16 for the different fault models and one for the non faulty state of the circuit. The number of hidden layer neurons is varied to get the best performance of the artificial neural network. Mean square error of ANN is taken as the performance parameter. The artificial neural network is trained with Levenberg-Marquardt backpropagation (trainlm) algorithm as this algorithm has been proved to be the best in estimation and it gives minimum error as compared to the other training algorithms used in ANN [14],[15].
The 867 samples of the output responses are used for training, validation and testing of the artificial neural network. The 70% of the total input samples are used in training the artificial neural network, 15% are used for validation check and the 15% are used for testing. Therefore 607 samples are used for training, 130 samples for validation and 130 samples for testing of the artificial neural network. The random input selection function is used to distribute these inputs in the artificial neural network. The training parameters involve maximum number of epochs 1000, validation sample fail 6 and minimum mean square error. The training, validation and the testing graphs for fault classification in mixed-signal analog circuit are shown in Fig.3
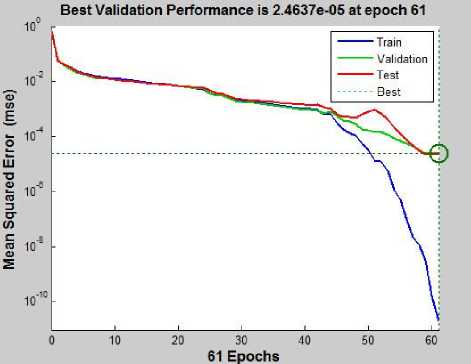
Fig. 3. Artificial neural network training, validation and test graphs for fault classification in mixed-signal analog circuit.
In the fault classification in mixed-signal analog circuit the 19 hidden neurons are used in the artificial neural network design. The best validation performance of the artificial neural network is 2.4637e-05 at epoch 61.
-
C. Virtual Instrument Design for Fault Diagnosis
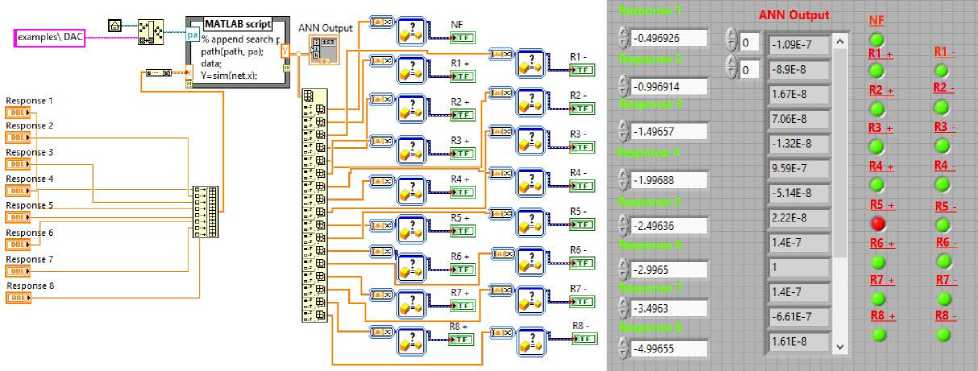
The fault diagnosis system has been designed in the LabVIEW environment in the form of a virtual instrument. The results of the fault diagnosis i.e the output of the artificial neural network is made available with visual view by a virtual instrument design. The front panel of the virtual instrument contain eight test input controls namely response1, response2,………and response8, ANN output, and the display variables R1(+), R1(-), R2(+), R2(-), R3(+), R3(-), R4(+), R4(-), R5(+), R5(-), R6(+), R6(-), R7(+), R7(-), R8(+) and R8(-) with visual indicators. The block diagram of the virtual instrument contains graphical code of the fault diagnosis system. This includes input output blocks, artificial neural network and some data processing blocks.
(a)
(b)
Fig. 4. Design of Virtual Instrument for Fault Diagnosis of Digital to Analog Converter (a) Block diagram (b) Front panel
The front panel and the block diagram of the virtual instrument are shown in Fig.4. In the virtual instrument, artificial neural network program is embedded with the help of MATLAB Script node. Finally the output of the artificial neural network is processed to classify the different defined fault in the mixed-signal analog circuit. Along with the other fault models a no fault (NF) is also provided as one of the outputs. It can be seen from the Fig. 4, that R5(+) is there in the circuit under test. In the front panel of the virtual instrument red indicator shows that fault occurred and the green indicator shows no fault occurred.
-
IV. Results and Discussion
In this section results of parametric fault diagnosis using intelligent virtual instrument in four bit R2R digital to analog converter circuit with simulated and with the real time data are presented. The performance of the artificial neural networks designed for the fault diagnosis process is given in the Table 3. The artificial neural network used in the fault classification in mixed-signal analog circuit uses 19 hidden layer neurons. The artificial neural network gets training in 61 epochs. Mean square error is defined as average squared difference between output and the target values of the ANN. The mean square error obtained for training data is 1.91907e-11, for validation data is 2.46370e-5 and for test data is 2.28248e-5. The regression value in ANN gives measure of the correlation between the output and the target values. The regression value 1 shows their close relation and 0 shows a random relation. The regression value for training data is 9.99999e-1, for validation data is 9.99777e-1and for test data is 9.99794e-1. These values are approaching one show the close relation between output and the target values. The regression plots of the artificial neural network are shown in Fig.5.
Table 3. Performance of the Artificial Neural Network used for Fault Diagnosis Mixed-signal Analog Circuit
|
Mixed Signal Analog Circuit |
No. of Hidden Layer Neurons |
No. of Epochs |
Mean Square Error |
Regression Value |
||||
|
Training |
Validation |
Test |
Training |
Validation |
Test |
|||
|
19 |
61 |
1.91907e-11 |
2.46370e-5 |
2.28248e-5 |
9.99999e-1 |
9.99777e-1 |
9.99794e-1 |
|
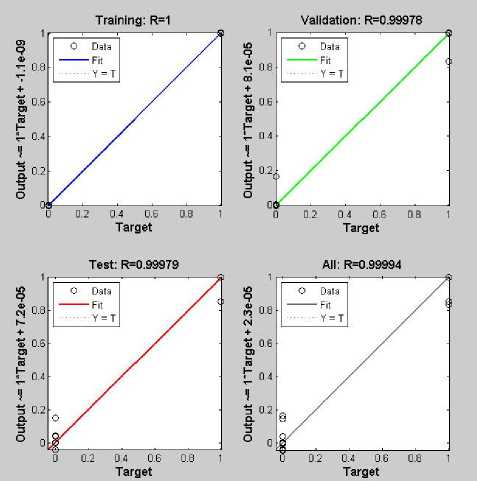
Fig. 5. Regression Plots of ANN used in Fault Classification of Mixed-Signal Analog Circuit
With simulated and real time data results are checked for all the defined parametric fault models (R1(+), R1(-), R2(+), R2(-), R3(+), R3(-), R4(+), R4(-), R5(+), R5(-), R6(+), R6(-), R7(+), R7(-), R8(+) and R8(-)) in the R2R network of DAC. It has been concluded that in both the cases the fault diagnosis efficiency is 100%. Here one of the sample results of fault diagnosis test is shown in Fig.4. A set of output responses (-0.496926, -0.996914, -1.49657, -1.99688, -2.49636, -2.9965, -3.4963, -4.99655)
of the circuit under test obtained from the Monte Carlo run for the fault model R5(+) is applied to the virtual instrument input. In the front panel fault indicator shows that the component R5(+) fault is detected.
-
V. Conclusion
In this paper, fault diagnosis in a four bit R2R digital to analog converter using artificial neural network is presented. The novelty of the proposed method lies in the fact that testing of the mixed-signal analog circuit has been presented with less number of input test patterns obtained with the sensitivity analysis of the circuit. This significantly reduces the complexity involved in the fault diagnosis process. In addition to this, the fault diagnosis methodology has been generalized by validating with simulated as well as real time data for a 4 bit DAC. It will also be valid for the other higher architectures of DACs with more number of bits. Moreover analyzing the component tolerances using Monte-Carlo analysis makes the testing of DAC in real time domain.
The use of the artificial neural network leads to the automation in the fault diagnosis process even with the unknown fault features. The development of fault diagnosis system in the form of virtual instrument represents a standalone fault diagnostic system which in turn decreases the human effort needed in the fault diagnosis of mixed signal circuits. Hence it has been concluded that the proposed fault diagnosis system is an intelligent virtual diagnosis system with good diagnosis ability for the parametric fault diagnosis in mixed-signal analog circuit.
Acknowledgement
References Fault Diagnosis of Mixed-Signal Analog Circuit using Artificial Neural Networks
- Liu, E. Kao, W., Felt, E. “Analog testability analysis and fault diagnosis using behavioral modeling” Custom Integrated Circuits Conference, pp. 413-416. 1994.
- Charles Stroud, Jason Morton, Atia Islam and Hazem Alassaly, “A Mixed-Signal Built-In Self-Test Approach for Analog Circuits” Southwest Symposium on Mixed-Signal Design, pp. 196-201, 2003.
- P.Kalpana, K.Gunavathi, “Fault oriented Test Pattern Generator for Digital to Analog converters” Academic Open Internet Journal, Volume 13, 2004.
- Ramesh, J. Srinivasulu, M.; Gunavathi, K. “A novel on chip circuit for fault detection in digital to analog converters” International Conference on Control, Automation, Communication and Energy Conservation, pp. 1-8, 2009.
- P. Kalpana, K. Gunavathi, “A Novel Implicit Parametric Fault Detection Method for Analog/Mixed Signal Circuits Using Wavelets” ICGST-PDCS Journal, Volume 7, Issue 1, pp. 43-48, May, 2007.
- Peng Wang, Shiyuan Yang, “ A New Diagnosis Approach for Handling Tolerence in Analog and Mixed-Signal Circuits by Using Fuzzy Math” IEEE Transactions on Circuits and Systems-I: Regular Papers, Vol. 52, No.10, pp. 2118-2127, 2005.
- William G. Fenton, T. M. McGinnity, and Liam P.Maguire, Fault Diagnosis of Electronic Systems Using Intelligent Techniques: A Review, IEEE Transactions on Systems, Man, and Cybernetics—part c: Applications and Reviews 31, No.3 pp. 269-281. 2001.
- Haipeng Pan, Bo Chen, “Intelligent Fault Diagnosis Based on ANN: A Review” The 2nd International Conference on Computer Application and System Modeling, pp. 115-118, 2012.
- B. Kaminaska, K. Arabi, I. Bell, p. Goteti, J.L Huertas, B. Kim, A. Rueda, M.Soma, “Analog and Mixed-signal Benchmark Circuits- First Release” International Test Conference, pp. 183-190, 1997.
- Mihai Iordache, Lucia Dumitriu, Dragos Niculae, “On The Sensitivity Analysis Of Analog Circuits”, Annals of the University of Craiova, Electrical Engineering series, No. 32, pp. 11-16, 2008.
- S. Bhuvaneswari, J. Sabarathinam, “Defect Analysis Using Artificial Neural Network” I.J. Intelligent Systems and Applications, 05, pp. 33-38, 2013.
- Milad Malekzadeh, Alireza Khosravi, Abolfazl Ranjbar Noei, Reza Ghaderi,“Application of Adaptive Neural Network Observer in Chaotic Systems” I.J. Intelligent Systems and Applications, 02, pp. 37-43, 2014.
- Jafferey Travis, Jim Kring, LabVIEW for Everyone: Graphical Programming Made Easy and Fun, Pearson Education, 2009.
- Jayabalan Ramesh, Ponnusamy Thangapandian Vanathi, Kandasamy Gunavathi, “Fault Classification in Phase-Locked Loops Using Back Propagation Neural Networks”. ETRI Journal, 30, pp.557-554, 2008.
- Jagtar Singh, Amar Partap Singh, “Estimation of Feed Position of a Rectangular Microstrip Antenna Using ANN”, IE(I) Journal-Electronics and Telecommunication, pp. 20-25, 2010.
