FBSEM: A Novel Feature-Based Stacked Ensemble Method for Sentiment Analysis

Author: Yasin Görmez, Yunus E. Işık, Mustafa Temiz, Zafer Aydın
Journal: International Journal of Information Technology and Computer Science @ijitcs
Article in issue: 6 Vol. 12, 2020.
Free access
Sentiment analysis is the process of determining the attitude or the emotional state of a text automatically. Many algorithms are proposed for this task including ensemble methods, which have the potential to decrease error rates of the individual base learners considerably. In many machine learning tasks and especially in sentiment analysis, extracting informative features is as important as developing sophisticated classifiers. In this study, a stacked ensemble method is proposed for sentiment analysis, which systematically combines six feature extraction methods and three classifiers. The proposed method obtains cross-validation accuracies of 89.6%, 90.7% and 67.2% on large movie, Turkish movie and SemEval-2017 datasets, respectively, outperforming the other classifiers. The accuracy improvements are shown to be statistically significant at the 99% confidence level by performing a Z-test.
Sentiment analysis, ensemble methods, machine learning, feature extraction
Short address: https://sciup.org/15017471
IDR: 15017471 | DOI: 10.5815/ijitcs.2020.06.02
Text of the scientific article FBSEM: A Novel Feature-Based Stacked Ensemble Method for Sentiment Analysis
Published Online December 2020 in MECS DOI: 10.5815/ijitcs.2020.06.02
With the recent developments in technology, the internet has entered to almost every field of our lives including health, science, entertainment, sports, and art. Due to the widespread availability of web pages and mobile applications, people are able to share their comments, ideas or opinions in many different topics on various platforms. As a result of this dense information flow, the internet now accommodates a huge repository of data providing a rich and diverse content. However, accessing the right information from a large surplus of data is a challenging task. To overcome this problem, text mining methods have been developed to automatically extract knowledge from web sites. Text mining can be defined as the process of obtaining meaningful and usable information from text using statistical or machine learning methods [1]. It can be divided into sub-categories such as summarization, classification, clustering, information extraction, and sentiment analysis. This paper concentrates on sentiment analysis, which is the process of extracting idea, opinion or emotion of a text by employing mathematical models and algorithms. Two types of approaches have been developed for this problem: dictionary based and machine learning based models [1]. In the first phase of dictionary based models, initially the desired sentiment is determined. Subsequently, the words expressing this sentiment and the meanings of the words are searched in the text. Then a score for that sentiment is calculated with the help of a dictionary. In the last phase, the sentiment state is extracted using statistical methods. Dictionary based models require a pre-defined dictionary containing positive, negative, and neutral weight scores for each word, which may not be available for each language. In machine learning based models, first, texts are labeled followed by data cleaning and preprocessing steps. Next, vector space models are formed that allow samples to be represented as feature vectors. After dividing samples into training, test and validation sets, models are learned and validated by training and testing procedures. Machine learning methods are independent from the language and can achieve high success rates. For this reason, they are preferred over dictionary based methods in academic studies on sentiment analysis.
Machine learning methods are divided into two main categories as supervised and unsupervised learning. The most important feature that distinguishes supervised learning from unsupervised learning is that it utilizes label information during training. When studies on sentiment analysis are examined, supervised machine learning methods are employed more frequently. Several methods have been developed in the literature for this purpose. Liu et al. proposed Chinese character based bigram feature extraction method and compared it with traditional bigram, trigram and word-based unigram by using support vector machines (SVM), naïve Bayes (NB), and artificial neural networks (ANN). The proposed method obtained the best F1 score of 91.62% on a dataset generated using 16,000 texts from Chinese web sites [2]. Go et al. trained three different models using maximum entropy (ME), NB and SVM on twitter data and obtained an 83% accuracy rate [3]. Mouthami et al. proposed a fuzzy logic and increased the accuracy rate for Cornell movie reviews [4]. Gautham and Yadav achieved success rates between 83.8% and 89.9% in the models designed using NB, SVM, ME and the Wordnet approach [5]. Nizam and Akın developed two datasets from twitter data to show the effect of employing balanced and unbalanced datasets. They used NB, random forest (RF), sequential minimal optimization, J48 and k-nearest neighbor (k-NN) and achieved an improvement of up to 6% in the success rate when the balanced dataset is used for model training [6]. Çoban et al. trained Turkish twitter data using NB, Multinomial naïve Bayes (MNB), SVM and k-NN and obtained 66.06% accuracy rate [7]. Kranjc et al. generated two SVM models using active learning and observed that the active learning based model was 6.7% more successful [8]. Tripathy et al. used ngram feature extraction methods with four classification algorithms and obtained a 95% accuracy rate [9]. Rohini et al. created several models to compare the text written in English and Kannada and showed that the models generated from English texts are more successful [10]. Hassan and Mahmood combined a convolutional neural network (CNN) with a long short term memory (LSTM) recurrent neural network (RNN) on IMDB movie and Stanford sentiment treebank (SST) datasets and obtained a 47.5% accuracy rate for SST and 88.3% for IMDB [11]. Al-Smadi et al. applied comparative sentiment analysis using SVM and deep recurrent neural networks (RNN) for three different tasks on Arabic hotel reviews dataset and they observed that SVM outperformed RNN with an accuracy rate of 90% [12]. Chiong et al. performed sentiment analysis to predict financial markets. They optimized the SVM’s parameters using particle swarm optimization and obtained a 59% accuracy rate [13]. Sohangir et al. applied several deep learning techniques on stock market dataset and achieved a 90.93% accuracy by CNN [14]. Demirtas and Pechenizkiy applied Naive Bayes, Linear SVC and Maximum Entropy classifiers to Turkish Movie review dataset and obtained 69.5% accuracy with NB [15]. Baziotis et. al. applied Deep Long-Short Term Memory networks on SemEval-2017 dataset and 67.5% F1 score was obtained [16]. Gonzales et.al. offer a Convolutional Recurrent Neural Network (CRNN) and they obtained 59.9% accuracy rate for SemEval-2017 dataset [17].
In addition to using individual learning models, it is also possible to combine the decisions of several methods in an ensemble setting in order to eliminate the inherent disadvantages of the individual methods. Xia et al. combined SVM, NB and ME using three different ensemble methods and achieved an 88.65% accuracy on several datasets [18]. Neethu and Rajasree combined SVM, MBE and NB using ensemble methods and achieved a 90% accuracy rate on twitter data [19]. Fersini et al. used NB, ME, SVM and Markov random fields to compare traditional ensemble methods with a Bayesian based ensemble method. According to the results of experiments on six different datasets, Bayesian based methods increased the success rate and reduced the computational cost [20]. Da Silva et al. combined MNB, SVM, RF and logistic regression (LR) using the ensemble method they proposed, and achieved accuracy rates from 76.84% to 87.20% on five different datasets [21]. Çatal and Nangir combined NB and SVM using several ensemble methods and achieved the accuracy rates up to 86.13% [22]. Ankit and Saleena combined NB, SVM, LR and RF using a voting method and achieved accuracy rates of 70% to 76% on five different datasets that were generated from twitter [23]. Araque et al. applied voting and stacking ensemble methods on several datasets and achieved a 90% accuracy rate [24]. Dedhia and Ramteke combined linear and RBF SVM using AdaBoost and achieved an 83% accuracy rate [25]. Cliche offered a-state-art an ensemble method that combine Convolutional Neural Networks (CNNs) and Long-Short Term Memory(LSTM) Networks for SemEval-2017 dataset and obtained 68.1% recall score [26].
In addition to the classification algorithms, the quality of the attributes in a dataset is also an important factor affecting the success rate of the prediction methods. Various dimension reduction and feature selection methods are frequently employed in order to eliminate unnecessary and noisy attributes that adversely affect classification performance. Tan and Zhang applied document frequency (DF), chi-square (CS), information gain (IG) and mutual information (MI) metrics for feature selection on a dataset generated from Chinese documents and achieved an 88.58% accuracy rate using five different classifiers [27]. Go et al. applied MI, ME, CS metrics and frequency-based feature selection techniques on twitter data and obtained an 84% accuracy rate [28]. Meral and Diri applied correlation-based feature selection technique on twitter data and achieved a 90% F1-score using SVM, NB and RF [29]. Vinodhini and Chandrasekaran achieved 77% accuracy using principal component analysis (PCA), NB and SVM [30]. Yousefpour et al. applied proposed dimension reduction technique on different datasets and achieved a 90.91% accuracy using SVM, NB, ME and an ensemble of these three classifiers [31]. Kim and Lee applied proposed semi-supervised nonlinear dimensionality reduction technique on four different datasets and showed that the proposed techniques are better than the traditional dimension reduction methods [32]. Kaynar et al. showed that deep autoencoder is better than traditional dimension reduction techniques in many cases [1]. Kim proposed improved semi-supervised dimensionality reduction using feature weighting for sentiment analysis and obtained improved accuracy based on the experiments on six benchmark datasets [33].
Traditional ensemble methods try to reduce the error by combining multiple classification algorithms that typically act on a common feature set. When the features are computed by different feature extraction methods it could be useful to train separate learners for each feature representation and combine their decisions. In this paper, a novel ensemble method, FBSEM, is proposed for sentiment analysis that employs various classifiers as well as attributes derived by different feature extraction methods. The purpose of this study is to compare proposed classifier technique, FBSEM, with support vector machine [34], logistic regression [35], multi-layer perceptron [36], naïve bayes [37], random forest [38] k-nearest neighbor [39], ensemble voting [40] and ensemble stacking [41].
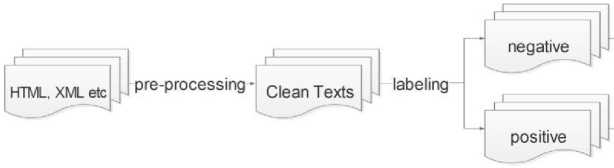
Fig.1. Steps of Sentiment Analysis
feature extraction
Trained Model
2. Material and Methodology 2.1. Dataset
In this study, three sentiment datasets are used. The first one is a large movie review dataset [42], which contains 50,000 movie reviews from IMDB with 25,000 positive and 25,000 negative samples. When constructing this dataset, no more than 30 reviews are allowed for any given movie. The second dataset is a Turkish movie dataset that is generated by Demirtaş and Pechenizkiy from Beyazperde web page [15]. It contains 10,662 movie reviews including 5,331 negatives and 5,331 positives. The third dataset is the SemEval-2017 benchmark that is collected by Rosenthal et al. from twitter web page [43]. It contains 20,632 tweets including 7059 positives, 3,231 negatives and 10,342 neutrals.
-
2.2. Sentiment Analysis
-
2.3. Pre-processing and Feature Extraction for Sentiment Analysis
-
2.4. Classification Methods
Sentiment analysis (SA) is basically a sub-field of natural language processing and text mining, which aims to find the idea, opinion or emotion (such as negative or positive) in the documents. It consist of data collection, pre-processing, labeling, feature extraction and classification steps as shown in Figure 1.
Before extracting input features for machine learning models, it is possible to pre-process the textual data using techniques such as post-tagging, cleaning the stop words, and stemming. In the next step, numerical feature vectors are extracted and labeled. In this study, TF [44], TF-IDF [45], continuous bag of words and skip-gram [46] are used as feature extraction techniques. For the TF and TF-IDF, unigram [47] model is used to separate words. For the continuous bag of words and skip-gram, negative sampling [48] and hierarchical softmax [49] methods are used.
A. Feature-Based Stacked Ensemble Method for Sentiment Analysis (FBSEM)
3. Application Results
FBSEM is a two-stage classifier that includes LR and MLP in the first stage, and SVM in the second stage. A separate LR and MLP is trained for each data matrix that is produced by unigram TF (UNI_TF), unigram TF-IDF (UNI_TFIDF), negative sampling skip-gram (SG_NS), hierarchical softmax skip-gram (SG_HS), negative sampling continuous bag of words (CBOW_NS) and hierarchical softmax continuous bag of words (CBOW_HS). Then the predictions of LR and MLP are concatenated with feature vectors extracted by these six methods and sent as input to an SVM classifier. Figure 2 summarizes the steps of FBSEM.
In figure 2, distributions represent predicted probability scores calculated using the corresponding feature extraction and classification methods. As a result, a set of twelve distributions are generated each as a matrix of dimensions nxm. Here, n represents the number of documents and m the number of different classes. Therefore, for large movie and Turkish movie reviews datasets m will be 2 and for SemEval-2017 dataset m will be 3. In the first phase of the FBSEM, the dataset is divided into train and test sets. Subsequently, LR and MLP are used as classifiers, which are trained on train set and validated on test set. To prevent overfitting in the second phase of FBSEM, first, a 2fold cross validation is performed on the train set during the first phase. Then, predictions on test set are computed using the model trained during the first phase. This technique makes it possible to compute predictions on train set as well as the test set using the methods of the first phase (i.e. LR and MLP). These predictions are later employed in the feature vector of the SVM. In the second phase of FBSEM, after distributions are concatenated with feature sets, an SVM classifier makes the final decision. This approach helps to reduce the errors from using different attributes and classifiers. A standard support vector machine can separate two classes only. For three or more classes, two techniques can be used: one versus all (OVA), or one versus one (OVO) [50]. In this study, OVO method is used for the SemEval-2017 dataset. In this section, the FBSEM method is compared with several classifiers on three benchmark datasets. Except for stacking and MLP, traditional classifiers are implemented using scikit-learn [51] library of Python. The stacking ensemble is implemented using mlxtend [52] library of Python and MLP using keras [53] library of Python. FBSEM method is implemented in Python. Accuracy, area under the ROC curve (AUROC), area under the precision and recall curve (AUPRC) are used as the performance measures [54].
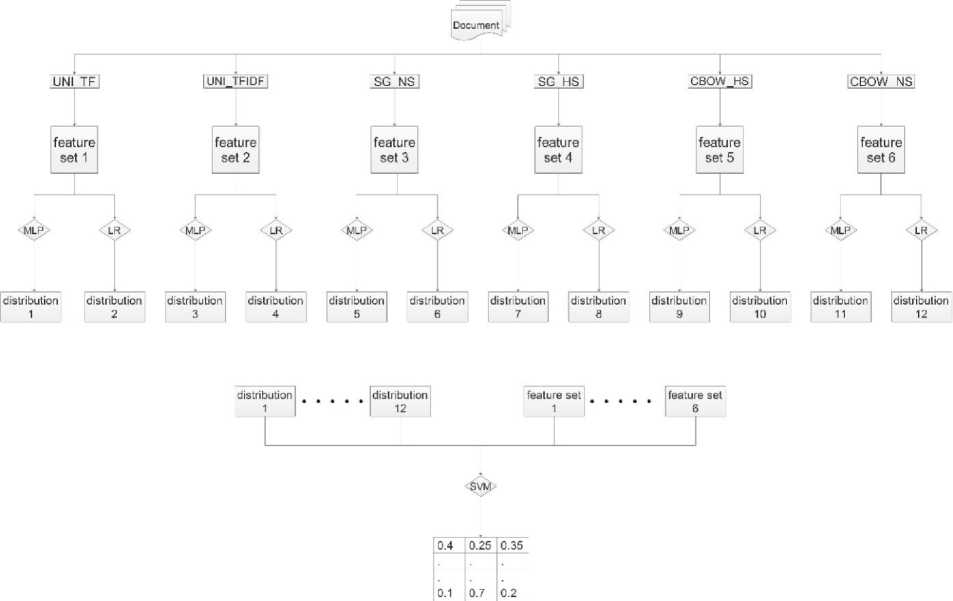
Fig.2. Steps of FBSEM Classifier
A 10-fold cross-validation experiment is performed on each dataset to assess the prediction accuracy of the methods. Documents are randomly assigned to train and test sets for each fold. Then, from each train set, 20% of documents are chosen randomly to form a second train set (train-set-small) and 5% of the remaining documents are chosen randomly to form a second test set (test-set-small), which are used for hyper-parameter optimization in each fold of the cross-validation. This enables to reduce the computational cost of hyper-parameter optimization and prevent over-fitting. As a result, for each fold, four different datasets are generated: train set, test set, test-set-small, train-set-small.
Features for each dataset are extracted using UNI_TF, UNI_TFIDF, SG_NS, SG_HS, CBOW_NS and CBOW_HS. Subsequently, hyper-parameters of MLP, SVM, LR, k-NN and RF are optimized using train-set-small and test-set-small. For MLP, one hidden layer and the ADAM optimizer are used. The number of epochs, number of neurons in hidden layer, learning rate, beta1 and beta2 parameters for ADAM are optimized by performing grid search. Similarly, the number of iterations, C parameter for SVM, C parameter for LR, number of neighbors for k-NN and maximum depth and number of trees for RF are optimized separately for each fold of the cross-validation. After optimization, the models are trained using the optimum hyper-parameter configurations and predictions are computed on test sets. In addition to these classifiers, Gaussian Naïve Bayes, ensemble with majority voting and stacking ensemble models are also trained and tested. For the ensemble with majority voting MLP, SVM and LR are employed as the base learners, while for the stacking ensemble LR and MLP are selected as the base learners and SVM as the meta learner. Tables 1-3 show experiment results for large movie review dataset, Turkish movie review dataset and SemEval-2017 dataset, respectively. In these tables, acc represents the mean accuracy result of 10 folds, std represents the standard deviation of the accuracies across the folds, AUPRC represents the mean area under the precision and recall curve and AUROC represents the mean area under the ROC curve. Based on the these results, the best accuracy results are obtained by UNI_TF and UNI_TFIDF feature extraction methods. FBSEM obtained the best accuracy in all settings. However in terms of AUPRC and AUROC scores, other classifiers may perform slightly better than FBSEM in some of the feature extraction settings.
Table 1. Accuracy measures of classification methods and standard deviation values for sentiment analysis evaluated by 10-fold cross validation experiment on large movie review dataset. (EV represents the ensemble with majority voting and STE represents the stacking ensemble.)
|
METHOD |
UNI_TF |
UNI_TFIDF |
SG_NS |
|||||||||
|
acc |
std |
AUPRC |
AUROC |
acc |
std |
AUPRC |
AUROC |
acc |
std |
AUPRC |
AUROC |
|
|
MLP |
86.3% |
0.024 |
77.0% |
77.3% |
88.5% |
0.005 |
86.4% |
87.2% |
83.6% |
0.117 |
89.5% |
89.5% |
|
SVM |
88.6% |
0.005 |
94.7% |
95.1% |
89.0% |
0.005 |
95.4% |
95.6% |
87.2% |
0.006 |
94.0% |
94.3% |
|
LR |
88.6% |
0.005 |
90.3% |
91.9% |
89.0% |
0.005 |
95.2% |
95.4% |
87.3% |
0.006 |
79.3% |
85.5% |
|
k-NN |
70.6% |
0.018 |
88.4% |
78.2% |
79.5% |
0.005 |
93.1% |
75.1% |
81.0% |
0.007 |
83.9% |
84.2% |
|
RF |
85.1% |
0.004 |
92.6% |
92.9% |
85.2% |
0.003 |
92.7% |
93.0% |
83.3% |
0.006 |
91.0% |
91.2% |
|
NB |
71.7% |
0.007 |
94.8% |
95.1% |
78.4% |
0.004 |
95.5% |
95.6% |
76.4% |
0.007 |
94.0% |
94.3% |
|
EV |
87.6% |
0.006 |
88.5% |
92.1% |
88.9% |
0.005 |
90.9% |
93.4% |
87.5% |
0.007 |
87.6% |
91.0% |
|
STE |
87.6% |
0.006 |
92.8% |
93.5% |
88.1% |
0.005 |
95.4% |
95.6% |
86.7% |
0.013 |
94.3% |
94.5% |
|
METHOD |
SG_HS |
CBOW_NS |
CBOW_HS |
|||||||||
|
acc |
std |
AUPRC |
AUROC |
acc |
std |
AUPRC |
AUROC |
acc |
std |
AUPRC |
AUROC |
|
|
MLP |
87.1% |
0.007 |
88.9% |
88.7% |
87.9% |
0.009 |
91.7% |
91.3% |
88.0% |
0.008 |
91.3% |
91.2% |
|
SVM |
87.2% |
0.004 |
93.9% |
94.2% |
88.8% |
0.005 |
95.1% |
95.3% |
88.5% |
0.005 |
94.8% |
95.1% |
|
LR |
87.2% |
0.005 |
94.0% |
94.2% |
88.8% |
0.004 |
94.6% |
94.8% |
88.6% |
0.005 |
94.4% |
94.8% |
|
k-NN |
80.9% |
0.007 |
83.3% |
81.4% |
83.2% |
0.006 |
85.9% |
86.1% |
83.0% |
0.006 |
85.5% |
85.2% |
|
RF |
83.7% |
0.007 |
91.2% |
91.4% |
84.3% |
0.006 |
92.0% |
92.2% |
84.8% |
0.005 |
92.2% |
92.5% |
|
NB |
74.4% |
0.007 |
94.0% |
94.3% |
78.4% |
0.009 |
95.1% |
95.3% |
77.6% |
0.008 |
94.9% |
95.2% |
|
EV |
87.4% |
0.007 |
89.8% |
92.4% |
88.6% |
0.003 |
93.0% |
94.3% |
88.5% |
0.005 |
93.4% |
94.4% |
|
STE |
86.9% |
0.008 |
94.2% |
94.4% |
88.6% |
0.007 |
94.8% |
95.1% |
88.3% |
0.006 |
94.9% |
95.2% |
Table 2. Accuracy measures of classification methods and standard deviation values for sentiment analysis evaluated by 10-fold cross validation experiment on Turkish movie review dataset. (EV represents the ensemble with majority voting and STE represents the stacking ensemble.)
|
METHOD |
UNI_TF |
UNI_TFIDF |
SG_NS |
|||||||||
|
acc |
std |
AUPRC |
AUROC |
acc |
std |
AUPRC |
AUROC |
acc |
std |
AUPRC |
AUROC |
|
|
MLP |
89.1% |
0.012 |
81.8% |
79.2% |
88.9% |
0.010 |
86.6% |
84.1% |
82.0% |
0.108 |
93.3% |
92.5% |
|
SVM |
88.1% |
0.008 |
94.2% |
94.5% |
88.8% |
0.010 |
94.9% |
95.2% |
86.6% |
0.004 |
93.0% |
93.8% |
|
LR |
88.1% |
0.008 |
92.8% |
93.8% |
88.9% |
0.009 |
93.7% |
94.6% |
87.2% |
0.009 |
79.0% |
84.6% |
|
k-NN |
74.2% |
0.016 |
96.1% |
63.0% |
76.3% |
0.147 |
95.9% |
65.1% |
85.8% |
0.008 |
94.6% |
89.8% |
|
RF |
85.9% |
0.012 |
92.9% |
93.2% |
85.7% |
0.011 |
93.1% |
93.3% |
86.2% |
0.007 |
93.5% |
93.5% |
|
NB |
78.3% |
0.016 |
94.8% |
95.0% |
79.4% |
0.014 |
95.0% |
95.4% |
85.5% |
0.007 |
92.9% |
93.7% |
|
EV |
88.1% |
0.011 |
85.3% |
90.0% |
88.5% |
0.008 |
82.9% |
88.2% |
86.6% |
0.007 |
93.0% |
93.5% |
|
STE |
87.5% |
0.010 |
94.7% |
94.9% |
86.9% |
0.012 |
95.1% |
95.4% |
86.3% |
0.007 |
93.2% |
93.6% |
|
METHOD |
SG_HS |
CBOW_NS |
CBOW_HS |
|||||||||
|
acc |
std |
AUPRC |
AUROC |
acc |
std |
AUPRC |
AUROC |
acc |
std |
AUPRC |
AUROC |
|
|
MLP |
84.7% |
0.026 |
93.7% |
93.6% |
79.9% |
0.020 |
85.8% |
84.9% |
83.1% |
0.024 |
91.3% |
90.7% |
|
SVM |
87.1% |
0.007 |
93.1% |
93.7% |
82.5% |
0.010 |
91.9% |
92.4% |
85.4% |
0.008 |
92.6% |
93.1% |
|
LR |
87.2% |
0.006 |
90.4% |
91.1% |
84.9% |
0.007 |
87.8% |
87.8% |
85.8% |
0.008 |
89.7% |
90.7% |
|
k-NN |
86.4% |
0.006 |
94.3% |
91.4% |
77.5% |
0.008 |
88.8% |
77.8% |
83.1% |
0.008 |
92.6% |
85.7% |
|
RF |
86.8% |
0.010 |
93.7% |
93.8% |
79.0% |
0.011 |
87.7% |
87.3% |
83.7% |
0.007 |
91.8% |
91.7% |
|
NB |
85.7% |
0.007 |
93.2% |
93.8% |
75.7% |
0.008 |
89.6% |
90.1% |
81.9% |
0.008 |
92.0% |
92.5% |
|
EV |
87.4% |
0.008 |
92.0% |
93.4% |
80.2% |
0.007 |
87.0% |
87.6% |
84.8% |
0.009 |
91.1% |
91.9% |
|
STE |
87.0% |
0.008 |
93.7% |
94.3% |
79.7% |
0.009 |
87.5% |
87.8% |
84.4% |
0.007 |
92.0% |
92.3% |
Table 3. Accuracy measures of classification methods and standard deviation values for sentiment analysis evaluated by 10-fold cross validation experiment on SemEval-2017 dataset. (EV represents the ensemble with majority voting and STE represents the stacking ensemble.)
|
METHOD |
UNI_TF |
UNI_TFIDF |
SG_NS |
|||||||||
|
acc |
std |
AUPRC |
AUROC |
acc |
std |
AUPRC |
AUROC |
acc |
std |
AUPRC |
AUROC |
|
|
MLP |
56.3% |
0.071 |
49.9% |
55.3% |
58.6% |
0.034 |
54.8% |
64.2% |
54.4% |
0.065 |
56.0% |
66.5% |
|
SVM |
62.6% |
0.034 |
65.6% |
76.0% |
63.3% |
0.031 |
66.5% |
76.3% |
56.0% |
0.039 |
58.8% |
70.1% |
|
LR |
63.1% |
0.037 |
62.1% |
60.8% |
62.9% |
0.041 |
63.5% |
64.7% |
57.4% |
0.046 |
49.7% |
60.5% |
|
k-NN |
51.4% |
0.039 |
67.0% |
20.1% |
55.8% |
0.038 |
66.7% |
20.3% |
55.1% |
0.029 |
57.2% |
63.7% |
|
RF |
58.7% |
0.042 |
61.7% |
71.7% |
57.8% |
0.035 |
59.5% |
70.2% |
54.9% |
0.053 |
55.3% |
67.3% |
|
NB |
29.9% |
0.031 |
65.9% |
75.4% |
29.9% |
0.032 |
66.7% |
76.2% |
43.7% |
0.037 |
55.6% |
67.7% |
|
EV |
61.9% |
0.033 |
58.6% |
70.7% |
64.0% |
0.030 |
60.8% |
72.2% |
57.5% |
0.031 |
57.7% |
69.5% |
|
STE |
60.4% |
0.032 |
64.8% |
74.6% |
61.5% |
0.029 |
67.6% |
76.8% |
57.4% |
0.031 |
58.2% |
69.8% |
|
METHOD |
SG_HS |
CBOW_NS |
CBOW_HS |
|||||||||
|
acc |
std |
AUPRC |
AUROC |
acc |
std |
AUPRC |
AUROC |
acc |
std |
AUPRC |
AUROC |
|
|
MLP |
56.0% |
0.041 |
56.7% |
66.2% |
49.5% |
0.056 |
49.2% |
61.4% |
53.9% |
0.041 |
54.4% |
65.5% |
|
SVM |
57.1% |
0.031 |
59.5% |
71.0% |
51.4% |
0.039 |
55.4% |
67.3% |
53.3% |
0.045 |
55.6% |
67.5% |
|
LR |
58.6% |
0.027 |
56.0% |
68.4% |
55.4% |
0.040 |
48.8% |
61.5% |
56.0% |
0.036 |
52.5% |
65.4% |
|
k-NN |
55.6% |
0.031 |
55.9% |
65.4% |
51.5% |
0.030 |
55.0% |
53.0% |
54.3% |
0.028 |
55.5% |
62.6% |
|
RF |
56.5% |
0.044 |
55.8% |
67.5% |
51.9% |
0.041 |
49.3% |
61.8% |
55.9% |
0.030 |
55.1% |
67.1% |
|
NB |
46.3% |
0.036 |
57.9% |
69.6% |
26.8% |
0.034 |
49.7% |
62.9% |
42.4% |
0.039 |
52.9% |
65.2% |
|
EV |
59.2% |
0.031 |
59.1% |
71.0% |
52.8% |
0.040 |
51.0% |
63.7% |
56.8% |
0.027 |
56.0% |
68.0% |
|
STE |
58.6% |
0.028 |
61.3% |
72.3% |
53.1% |
0.036 |
51.4% |
64.3% |
56.5% |
0.024 |
56.8% |
68.7% |
|
Table 4. Accuracy measures movie review dataset |
of FBSEM classifier |
for sentiment |
analysis evaluated by 10-fold cross validation experiment on large |
||
|
acc |
AUPRC |
AUROC |
AP |
variance |
|
|
Fold-1 |
89.4% |
96.2% |
96.2% |
96.2% |
0.043 |
|
Fold-2 |
89.8% |
95.8% |
96.1% |
95.8% |
0.029 |
|
Fold-3 |
89.0% |
95.4% |
95.6% |
95.4% |
0.029 |
|
Fold-4 |
89.8% |
96.3% |
96.2% |
96.3% |
0.022 |
|
Fold-5 |
88.9% |
95.5% |
95.7% |
95.5% |
0.026 |
|
Fold-6 |
89.8% |
95.9% |
96.1% |
95.9% |
0.026 |
|
Fold-7 |
90.3% |
95.4% |
96.1% |
95.4% |
0.020 |
|
Fold-8 |
89.2% |
95.8% |
95.8% |
95.8% |
0.019 |
|
Fold-9 |
89.7% |
96.1% |
96.2% |
96.1% |
0.027 |
|
Fold-10 |
90.3% |
95.7% |
96.3% |
95.7% |
0.036 |
|
Mean Result |
89.6% |
95.8% |
96.0% |
95.8% |
0.003 |
In the second step, sentiment classes are predicted using the first phase of FBSEM method for each feature extraction technique and a total of twelve distributions are obtained. These distributions are concatenated with six feature sets generated using the extraction techniques listed in Section II C. Then, SVM is trained using these datasets. Results for 10-fold cross-validation experiment are shown in Tables 4-6 for large movie review dataset, Turkish movie review dataset and SemEval-2017 dataset respectively. In these tables, AP represents average precision of each fold and variance represents the variance between the intermediate scores obtained when computing the ROC.
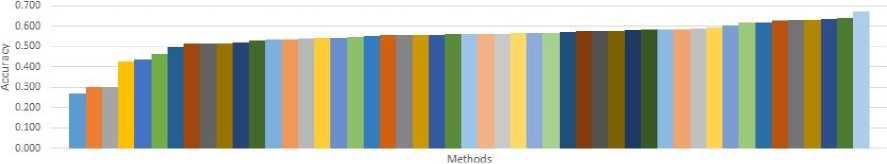
Figures 3-5 compare the accuracy values of all the classification methods on large movie review dataset, Turkish movie review dataset and SemEval-2017 dataset, respectively. In these figures, methods are sorted according to their mean accuracy rates obtained from the 10-fold cross-validation experiments. Since the last column always shows the accuracy rates of FBSEM, the proposed method obtains the best accuracy on all of the three benchmarks. The improvements are obtained as 0.6% for large movie review dataset, 1.6% for Turkish movie review dataset, and 3.9% for SemEval-2017 dataset.
In order to assess whether the improvements obtained using FBSEM are statistically significant , a two-tailed Z-test is performed using a confidence level of 99% [55]
|
Table 5. Accuracy measures of FBSEM classifier for sentiment analysis evaluated by 10-fold cross validation experiment on Turkish movie review dataset |
|||||
|
acc |
AUPRC |
AUROC |
AP |
variance |
|
|
Fold-1 |
90.3% |
95.5% |
95.8% |
95.5% |
0.100 |
|
Fold-2 |
92.0% |
96.3% |
96.6% |
96.3% |
0.089 |
|
Fold-3 |
89.4% |
94.5% |
94.9% |
94.5% |
0.083 |
|
Fold-4 |
90.0% |
95.1% |
95.3% |
95.1% |
0.075 |
|
Fold-5 |
90.2% |
94.6% |
95.5% |
94.6% |
0.138 |
|
Fold-6 |
91.8% |
95.7% |
96.5% |
95.7% |
0.131 |
|
Fold-7 |
90.8% |
95.9% |
96.3% |
95.9% |
0.101 |
|
Fold-8 |
91.8% |
95.8% |
96.2% |
95.8% |
0.081 |
|
Fold-9 |
88.8% |
92.8% |
93.7% |
92.8% |
0.082 |
|
Fold-10 |
91.7% |
96.5% |
96.4% |
96.5% |
0.083 |
|
Mean Result |
90.7% |
95.2% |
95.6% |
95.2% |
0.016 |
|
Table 6. Accuracy measures |
of FBSEM classifier for sentiment analysis evaluated by 10-fold cross validation experiment on |
SemEval-2017 dataset |
|||
|
acc |
AUPRC |
AUROC |
AP |
variance |
|
|
Fold-1 |
65.2% |
65.4% |
73.5% |
65.7% |
0.012 |
|
Fold-2 |
60.5% |
63.6% |
72.6% |
63.9% |
0.010 |
|
Fold-3 |
67.2% |
67.2% |
75.4% |
67.7% |
0.008 |
|
Fold-4 |
64.8% |
60.7% |
72.9% |
61.3% |
0.010 |
|
Fold-5 |
69.1% |
67.4% |
78.4% |
67.9% |
0.011 |
|
Fold-6 |
69.1% |
66.5% |
74.9% |
66.9% |
0.007 |
|
Fold-7 |
72.7% |
68.2% |
77.5% |
68.6% |
0.010 |
|
Fold-8 |
68.0% |
65.7% |
75.4% |
66.1% |
0.008 |
|
Fold-9 |
69.1% |
68.4% |
77.7% |
69.0% |
0.010 |
|
Fold-10 |
66.4% |
68.2% |
77.4% |
68.6% |
0.007 |
|
Mean Result |
67.2% |
65.1% |
74.9% |
65.2% |
0.001 |
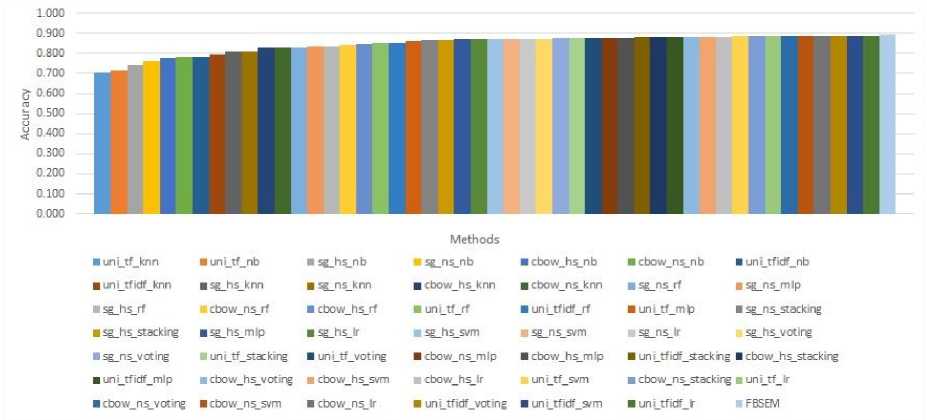
Fig.3. Accuracy comparison for large movie review dataset
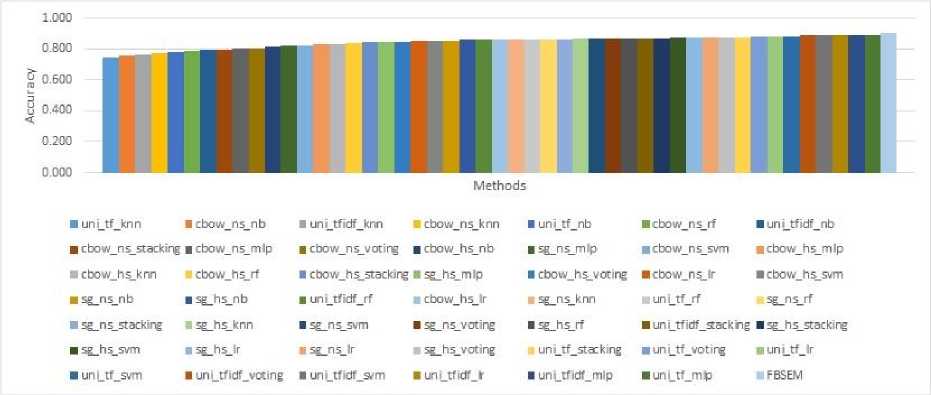
Fig.4. Accuracy comparison for Turkish movie review dataset
0.800
-
■ cbow_ns_nb
-
■ €bow_ns_svm
-
■ cbow_hs_m Ip
-
■ uni_tfidf_knn
-
■ uni_tf_voting
-
■ un i_tf_nb
-
■ uni_tf_knn
cbow_hs_knn
-
■ cbow_hs_rf
-
■ cbow_hs_vcting
-
■ sg_hs_stacking
-
■ un i_tf_svm
-
■ uni_tfidf_nb
-
■ cbow_ns_knn
-
■ 5g_rs_m!p
-
■ cbow_h5_lr
-
■ sg_hs_svm
-
■ uni_tfidf_mip
-
■ uni_tfidf_f
-
■ cbow_hs_nb
-
■ cbow_ns_rf
-
■ sg_hs_m!p
-
■ sg_ns_stackjng
-
■ uni_tf_rf
-
■ uni_tf_lr
-
■ sg_ns_nb
-
■ cbow_ns_voting
-
■ sg_ns_knn
-
■ 5g_ns_svm
sg_hs_vot!ng
-
■ uni_tfidf_9/m
-
■ 5g_hs_nb
-
■ cbow_n5_stacking
-
■ cbow_n5_lr
-
■ uni_tf_m|D
-
■ sg_ns_votir$
-
■ un i_tf_stac king
-
■ un i_tf idf_voting
-
■ cbow_ns_m ip
-
■ cbow_h5_svm
-
■ 5g_hs_knn
cbow_hs_5tackirg
■ uni_tfidf_rf
■ uni_tfidf_5tacking
■ FBSEM
4. Conclusions
Fig.5. Accuracy comparison for SemEval-2017 dataset
Table 7. p-values between the mean accuracy of FBSEM and other models on large movie review dataset
|
CBOW_HS |
CBOW_NS |
SG_HS |
SG_NS |
UNI_TF |
UNI_TFIDF |
|
|
MLP |
0.001 |
0.001 |
0.001 |
0.001 |
0.001 |
0.002 |
|
SVM |
0.001 |
0.001 |
0.001 |
0.001 |
0.007 |
0.008 |
|
LR |
0.001 |
0.001 |
0.001 |
0.001 |
0.007 |
0.008 |
|
k-nn |
0.001 |
0.001 |
0.001 |
0.001 |
0.001 |
0.001 |
|
RF |
0.001 |
0.001 |
0.001 |
0.001 |
0.001 |
0.001 |
|
NB |
0.001 |
0.001 |
0.001 |
0.001 |
0.001 |
0.001 |
|
Voting |
0.001 |
0.001 |
0.001 |
0.001 |
0.006 |
0.006 |
|
Stacking |
0.001 |
0.001 |
0.001 |
0.001 |
0.007 |
0.008 |
|
Table 8. p-values between the mean accuracy |
of FBSEM and other models on Turkish |
movie review dataset |
||||
|
CBOW_HS |
CBOW_NS |
SG_HS |
SG_NS |
UNI_TF |
UNI_TFIDF |
|
|
MLP |
0.001 |
0.001 |
0.001 |
0.001 |
0.007 |
0.002 |
|
SVM |
0.001 |
0.001 |
0.001 |
0.001 |
0.007 |
0.001 |
|
LR |
0.003 |
0.003 |
0.002 |
0.002 |
0.008 |
0.006 |
|
k-nn |
0.001 |
0.001 |
0.001 |
0.001 |
0.004 |
0.002 |
|
RF |
0.001 |
0.001 |
0.001 |
0.001 |
0.003 |
0.001 |
|
NB |
0.001 |
0.001 |
0.001 |
0.001 |
0.002 |
0.001 |
|
Voting |
0.001 |
0.001 |
0.001 |
0.001 |
0.006 |
0.001 |
|
Stacking |
0.001 |
0.001 |
0.001 |
0.001 |
0.008 |
0.001 |
|
Table 9. p-values between mean accuracy of FBSEM and other models on SemEval-2017 dataset |
||||||
|
CBOW_HS |
CBOW_NS |
SG_HS |
SG_NS |
UNI_TF |
UNI_TFIDF |
|
|
MLP |
0.001 |
0.001 |
0.001 |
0.001 |
0.001 |
0.001 |
|
SVM |
0.001 |
0.001 |
0.001 |
0.001 |
0.001 |
0.001 |
|
LR |
0.001 |
0.001 |
0.001 |
0.001 |
0.001 |
0.001 |
|
k-nn |
0.001 |
0.001 |
0.001 |
0.001 |
0.001 |
0.001 |
|
RF |
0.001 |
0.001 |
0.001 |
0.001 |
0.001 |
0.001 |
|
NB |
0.001 |
0.001 |
0.001 |
0.001 |
0.001 |
0.001 |
|
Voting |
0.001 |
0.001 |
0.001 |
0.001 |
0.001 |
0.004 |
|
Stacking |
0.001 |
0.001 |
0.001 |
0.001 |
0.001 |
0.001 |
Tables 7-9 include the p-values obtained for the Z-test for large movie review dataset, Turkish movie review dataset and SemEval-2017 dataset, respectively. In these tables, rows correspond to classifiers, columns denote feature extraction techniques and values represent p-values. A p-value smaller than 0.01 shows that the improvement made by FBSEM is statically significant. Based on these results, FBSEM performs significantly better than all the other methods implemented in this work.
In this study, we proposed a novel stacked ensemble technique called FBSEM for sentiment analysis and compared it with the traditional classifiers trained using six different feature extraction techniques and with two ensemble methods on three benchmark datasets. FBSEM obtained the best accuracy rates in all datasets and the improvements are shown to be statistically significant. For different datasets, different feature extraction methods may obtain the best accuracy rate. In this work, FBSEM employed all the feature extraction methods available. As a future work, dimension reduction including deep auto-encoders and feature selection techniques can be developed to select the most important features or to design novel feature representations, which may potentially improve the accuracy of FBSEM further.
Acknowledgment
The numerical calculations reported in this paper were fully/partially performed at TUBITAK ULAKBIM, High Performance and Grid Computing Center (TRUBA resources).
References FBSEM: A Novel Feature-Based Stacked Ensemble Method for Sentiment Analysis
- Kaynar, O., Aydin, Z., Görmez, Y., 2017. Sentiment Analizinde Öznitelik Düşürme Yöntemlerinin Oto Kodlayıcılı Derin Öğrenme Makinaları ile Karşılaştırılması. Bilişim Teknol. Derg. 10, 319–326. https://doi.org/10.17671/gazibtd.331046
- Li, J., Sun, M., 2007. Experimental Study on Sentiment Classification of Chinese Review using Machine Learning Techniques, in: 2007 International Conference on Natural Language Processing and Knowledge Engineering. Presented at the 2007 International Conference on Natural Language Processing and Knowledge Engineering, pp. 393–400. https://doi.org/10.1109/NLPKE.2007.4368061
- Go, A., Bhayani, R., Huang, L., 2009a. Twitter Sentiment Classification using Distant Supervision.
- Mouthami, K., Devi, K.N., Bhaskaran, V.M., 2013. Sentiment analysis and classification based on textual reviews, in: 2013 International Conference on Information Communication and Embedded Systems (ICICES). Presented at the 2013 International Conference on Information Communication and Embedded Systems (ICICES), pp. 271–276. https://doi.org/10.1109/ICICES.2013.6508366
- Gautam, G., Yadav, D., 2014. Sentiment analysis of twitter data using machine learning approaches and semantic analysis, in: 2014 Seventh International Conference on Contemporary Computing (IC3). Presented at the 2014 Seventh International Conference on Contemporary Computing (IC3), pp. 437–442. https://doi.org/10.1109/IC3.2014.6897213
- Nizam, H., Akın, S.S., 2014. Sosyal Medyada Makine Öğrenmesi ile Duygu Analizinde Dengeli ve Dengesiz Veri Setlerinin Performanslarının Karşılaştırılması. Presented at the XIX. Türkiye’de İnternet Konferansı, p. 6.
- Çoban, Ö., Özyer, B., Özyer, G.T., 2015. Sentiment analysis for Turkish Twitter feeds, in: 2015 23nd Signal Processing and Communications Applications Conference (SIU). Presented at the 2015 23nd Signal Processing and Communications Applications Conference (SIU), pp. 2388–2391. https://doi.org/10.1109/SIU.2015.7130362
- Kranjc, J., Smailović, J., Podpečan, V., Grčar, M., Žnidaršič, M., Lavrač, N., 2015. Active learning for sentiment analysis on data streams: Methodology and workflow implementation in the ClowdFlows platform. Inf. Process. Manag. 51, 187–203. https://doi.org/10.1016/j.ipm.2014.04.001
- Tripathy, A., Agrawal, A., Rath, S.K., 2016. Classification of sentiment reviews using n-gram machine learning approach. Expert Syst. Appl. 57, 117–126. https://doi.org/10.1016/j.eswa.2016.03.028
- Rohini, V., Thomas, M., Latha, C.A., 2016. Domain based sentiment analysis in regional Language-Kannada using machine learning algorithm, in: 2016 IEEE International Conference on Recent Trends in Electronics, Information Communication Technology (RTEICT). Presented at the 2016 IEEE International Conference on Recent Trends in Electronics, Information Communication Technology (RTEICT), pp. 503–507. https://doi.org/10.1109/RTEICT.2016.7807872
- Hassan, A., Mahmood, A., 2017. Deep Learning approach for sentiment analysis of short texts, in: 2017 3rd International Conference on Control, Automation and Robotics (ICCAR). Presented at the 2017 3rd International Conference on Control, Automation and Robotics (ICCAR), pp. 705–710. https://doi.org/10.1109/ICCAR.2017.7942788
- Al-Smadi, M., Qawasmeh, O., Al-Ayyoub, M., Jararweh, Y., Gupta, B., 2018. Deep Recurrent neural network vs. support vector machine for aspect-based sentiment analysis of Arabic hotels’ reviews. J. Comput. Sci. 27, 386–393. https://doi.org/10.1016/j.jocs.2017.11.006
- Chiong, R., Fan, Z., Hu, Z., Adam, M.T.P., Lutz, B., Neumann, D., 2018. A Sentiment Analysis-based Machine Learning Approach for Financial Market Prediction via News Disclosures, in: Proceedings of the Genetic and Evolutionary Computation Conference Companion, GECCO ’18. ACM, New York, NY, USA, pp. 278–279. https://doi.org/10.1145/3205651.3205682
- Sohangir, S., Wang, D., Pomeranets, A., Khoshgoftaar, T.M., 2018. Big Data: Deep Learning for financial sentiment analysis. J. Big Data 5, 3. https://doi.org/10.1186/s40537-017-0111-6
- Demirtas, E., Pechenizkiy, M., 2013. Cross-lingual Polarity Detection with Machine Translation, in: Proceedings of the Second International Workshop on Issues of Sentiment Discovery and Opinion Mining, WISDOM ’13. ACM, New York, NY, USA, pp. 9:1–9:8. https://doi.org/10.1145/2502069.2502078
- Baziotis, C., Pelekis, N., Doulkeridis, C., 2017. DataStories at SemEval-2017 Task 4: Deep LSTM with Attention for Message-level and Topic-based Sentiment Analysis, in: Proceedings of the 11th International Workshop on Semantic Evaluation (SemEval-2017). Association for Computational Linguistics, Vancouver, Canada, pp. 747–754.
- González, J.-Á., Pla, F., Hurtado, L.-F., 2017. ELiRF-UPV at SemEval-2017 Task 4: Sentiment Analysis using Deep Learning, in: Proceedings of the 11th International Workshop on Semantic Evaluation (SemEval-2017). Association for Computational Linguistics, Vancouver, Canada, pp. 723–727.
- Xia, R., Zong, C., Li, S., 2011. Ensemble of feature sets and classification algorithms for sentiment classification. Inf. Sci. 181, 1138–1152. https://doi.org/10.1016/j.ins.2010.11.023
- Neethu, M.S., Rajasree, R., 2013. Sentiment analysis in twitter using machine learning techniques, in: 2013 Fourth International Conference on Computing, Communications and Networking Technologies (ICCCNT). Presented at the 2013 Fourth International Conference on Computing, Communications and Networking Technologies (ICCCNT), pp. 1–5. https://doi.org/10.1109/ICCCNT.2013.6726818
- Fersini, E., Messina, E., Pozzi, F.A., 2014. Sentiment analysis: Bayesian Ensemble Learning. Decis. Support Syst. 68, 26–38. https://doi.org/10.1016/j.dss.2014.10.004
- da Silva, N.F.F., Hruschka, Eduardo R., Hruschka, Estevam R., 2014. Tweet sentiment analysis with classifier ensembles. Decis. Support Syst. 66, 170–179. https://doi.org/10.1016/j.dss.2014.07.003
- Catal, C., Nangir, M., 2017. A sentiment classification model based on multiple classifiers. Appl. Soft Comput. 50, 135–141. https://doi.org/10.1016/j.asoc.2016.11.022
- Ankit, Saleena, N., 2018. An Ensemble Classification System for Twitter Sentiment Analysis. Procedia Comput. Sci., International Conference on Computational Intelligence and Data Science 132, 937–946. https://doi.org/10.1016/j.procs.2018.05.109
- Araque, O., Corcuera-Platas, I., Sánchez-Rada, J.F., Iglesias, C.A., 2017. Enhancing deep learning sentiment analysis with ensemble techniques in social applications. Expert Syst. Appl. 77, 236–246. https://doi.org/10.1016/j.eswa.2017.02.002
- Dedhia, C., Ramteke, J., 2017. Ensemble model for Twitter sentiment analysis, in: 2017 International Conference on Inventive Systems and Control (ICISC). Presented at the 2017 International Conference on Inventive Systems and Control (ICISC), pp. 1–5. https://doi.org/10.1109/ICISC.2017.8068711
- Cliche, M., 2017. BB_twtr at SemEval-2017 Task 4: Twitter Sentiment Analysis with CNNs and LSTMs. ArXiv170406125 Cs Stat.
- Tan, S., Zhang, J., 2008. An empirical study of sentiment analysis for chinese documents. Expert Syst. Appl. 34, 2622–2629. https://doi.org/10.1016/j.eswa.2007.05.028
- Go, A., Huang, L., Bhayani, R., 2009b. Twitter Sentiment Analysis.
- Meral, M., Diri, B., 2014. Sentiment analysis on Twitter, in: 2014 22nd Signal Processing and Communications Applications Conference (SIU). Presented at the 2014 22nd Signal Processing and Communications Applications Conference (SIU), pp. 690–693. https://doi.org/10.1109/SIU.2014.6830323
- Vinodhini, G., Chandrasekaran, R., n.d. Effect of Feature Reduction in Sentiment analysis of online reviews. IJARCET 2, 9.
- Yousefpour, A., Ibrahim, R., Abdull Hamed, H.N., 2014. A Novel Feature Reduction Method in Sentiment Analysis. Int. J. Innov. Comput. 4.
- Kim, K., Lee, J., 2014. Sentiment visualization and classification via semi-supervised nonlinear dimensionality reduction. Pattern Recognit. 47, 758–768. https://doi.org/10.1016/j.patcog.2013.07.022
- Kim, K., 2018. An improved semi-supervised dimensionality reduction using feature weighting: Application to sentiment analysis. Expert Syst. Appl. 109, 49–65. https://doi.org/10.1016/j.eswa.2018.05.023
- Vapnik, V., 2013. The Nature of Statistical Learning Theory. Springer Science & Business Media.
- Wright, R.E., 1995. Logistic regression, in: Reading and Understanding Multivariate Statistics. American Psychological Association, Washington, DC, US, pp. 217–244.
- Dayhoff, J.E., DeLeo, J.M., 2001. Artificial neural networks. Cancer 91, 1615–1635. https://doi.org/10.1002/1097-0142(20010415)91:8+1615::AID-CNCR11753.0.CO;2-L
- Lowd, D., Domingos, P., 2005. Naive Bayes Models for Probability Estimation, in: Proceedings of the 22Nd International Conference on Machine Learning, ICML ’05. ACM, New York, NY, USA, pp. 529–536. https://doi.org/10.1145/1102351.1102418
- Pal, M., 2005. Random forest classifier for remote sensing classification. Int. J. Remote Sens. 26, 217–222. https://doi.org/10.1080/01431160412331269698
- Larose, D.T., 2004. k-Nearest Neighbor Algorithm, in: Discovering Knowledge in Data. John Wiley & Sons, Inc., pp. 90–106. https://doi.org/10.1002/0471687545.ch5
- Chen, Y., Chen, F., Yang, J.Y., Yang, M.Q., 2008. Ensemble voting system for multiclass protein fold recognition. Int. J. Pattern Recognit. Artif. Intell. 22, 747–763. https://doi.org/10.1142/S0218001408006454
- Chen, Y., Wong, M.L., 2011. Optimizing Stacking Ensemble by an Ant Colony Optimization Approach, in: Proceedings of the 13th Annual Conference Companion on Genetic and Evolutionary Computation, GECCO ’11. ACM, New York, NY, USA, pp. 7–8. https://doi.org/10.1145/2001858.2001863
- Sentiment classification on Large Movie Review [WWW Document], 2018. URL https://www.kaggle.com/c/sentiment-classification-on-large-movie-review/data
- Rosenthal, S., Farra, N., Nakov, P., 2017. SemEval-2017 Task 4: Sentiment Analysis in Twitter, in: Proceedings of the 11th International Workshop on Semantic Evaluation (SemEval-2017). Association for Computational Linguistics, Vancouver, Canada, pp. 502–518.
- Salton, G., Buckley, C., 1988. Term-weighting approaches in automatic text retrieval. Inf. Process. Manag. 24, 513–523. https://doi.org/10.1016/0306-4573(88)90021-0
- Aizawa, A., 2003. An information-theoretic perspective of tf–idf measures. Inf. Process. Manag. 39, 45–65. https://doi.org/10.1016/S0306-4573(02)00021-3
- Mikolov, T., Chen, K., Corrado, G., Dean, J., 2013a. Efficient Estimation of Word Representations in Vector Space.
- Tillmann, C., 2004. A Unigram Orientation Model for Statistical Machine Translation, in: Proceedings of HLT-NAACL 2004: Short Papers, HLT-NAACL-Short ’04. Association for Computational Linguistics, Stroudsburg, PA, USA, pp. 101–104.
- Mikolov, T., Sutskever, I., Chen, K., Corrado, G.S., Dean, J., 2013b. Distributed Representations of Words and Phrases and their Compositionality, in: Burges, C.J.C., Bottou, L., Welling, M., Ghahramani, Z., Weinberger, K.Q. (Eds.), Advances in Neural Information Processing Systems 26. Curran Associates, Inc., pp. 3111–3119.
- Goodman, J., 2001. Classes for fast maximum entropy training, in: 2001 IEEE International Conference on Acoustics, Speech, and Signal Processing. Proceedings (Cat. No.01CH37221). Presented at the 2001 IEEE International Conference on Acoustics, Speech, and Signal Processing. Proceedings (Cat. No.01CH37221), pp. 561–564 vol.1. https://doi.org/10.1109/ICASSP.2001.940893
- Görmez, Y., 2017. Dimensionality reduction for protein secondary structure prediction. Abdullah Gül Üniversitesi, YÖK.
- Supervise Learning [WWW Document], 2018. URL http://scikit-learn.org/stable/supervised_learning.html#supervised-learning
- Stacking Classifier [WWW Document], 2018. URL https://rasbt.github.io/mlxtend/user_guide/classifier/StackingClassifier/
- Keras: The Python Deep Learning library [WWW Document], 2018. URL https://keras.io/
- Precision and recall [WWW Document], 2017. URL https://en.wikipedia.org/wiki/Precision_and_recall
- Z Score Calculator for 2 Population Proportions [WWW Document], 2018. URL https://www.socscistatistics.com/tests/ztest/Default2.aspx
