Feasibility Analysis and Simulation of the Solar Photovoltaic Rooftop System Using PVsyst Software

Author: Md. Samiul Islam, Faridul Islam, Md. Ahsan Habib
Journal: International Journal of Education and Management Engineering @ijeme
Article in issue: 6 vol.12, 2022.
Free access
The objective of the research is to design and evaluate the grid-connected solar photovoltaic roof-top system at Tetulia, Panchagrah, Bangladesh using PVsyst software. The main factors of this research are the move toward renewable energy like PV with environmental consequences. The overall performance of a photovoltaic cell is determined by the amount of solar irradiation, the type of PV module used, and the orientation of PV module. Now, the grid-connected PV system is the best choice for large-scale renewable energy. For the case study, PVsyst software is used to analyze a 3kW solar PV plant installed on a rooftop for residential load consumption of 8.1kWh/day. The available AC energy generated by the PV panels is 4172kWh/year, and 1871kWh/year of surplus energy is supplied to the grid after daytime power demand is met. The yearly global horizontal irradiation of Tetulia, Panchagrah is 1485.4kWh/m2 and during the night, the quantity of electricity imported from the grid is 1050kWh/year. This technology helps in the prediction of power outages and backup energy storage because it makes use of the energy stored in the batteries.
Solar PV technology, Renewable energy, Grid connected, PVsyst, Rooftop system
Short address: https://sciup.org/15018578
IDR: 15018578 | DOI: 10.5815/ijeme.2022.06.03
Text of the scientific article Feasibility Analysis and Simulation of the Solar Photovoltaic Rooftop System Using PVsyst Software
The electricity demand of Bangladesh is rapidly increasing day by day. To balance the increasing electricity demand, the majority of energy has been produced by burning finite fossil fuels. But the fossil fuels are rapidly depleting, which is a great problem for the future demand for electricity. Besides, fossil fuels have a bad influence on the environment, releasing massive amounts of carbon-dioxide [1]. So, green energy sources; solar, biomass, wind, and hydro energy must be utilized for an effective solution that is alternative to fossil fuels [2]. One of the most feasible green sources in this regard is solar energy. Because solar energy is renewable, inexhaustible, free, requires less maintenance and is safe for the environment [3]. This solar energy has gained quite acceptance in Bangladesh for its implementation and affordability. In contrast, the major drawback of solar PV for necessary power generation is that it requires huge land. Almost 3 acres of land are needed to generate 1 MW of electricity from PV panels [4]. In an over populated country like Bangladesh, the land for solar power generation is quite limited because of competing demands for land for agriculture or other purposes [5]. On the other hand, metropolitan, industrial, corporate, and government buildings all can provide substantial rooftop space for solar power generation. Rooftop solar is the greatest solution for meeting the energy demand targets and alleviating the country's existing energy problem [6].
Several types of research have been analyzed in various ways; simulation [7], decision making process [8,9] and so on, to measure [10], compare and develop [11] the study. M.A. Habib et al. [12] described an evolutionary game analysis in power generation to analyze the cost and benefits. This study based on PV system shows different optimization; Vikrant Sharma et al. [13] analyzed the 190kWp grid-collaborative photovoltaic system with overall performance at Khatkar-Kalan, India. M.M.U. Rashid et al. [14] proposed the hybrid energy system to provide continuous electricity at Rangpur, Bangladesh. Rekhasree et al. [15] studied the 2.5kWp standalone photovoltaic system fitted in Karnataka, India. Based on PVsyst, P. Karki et al. [16] compared grid-tied PV systems of the entire electrical energy in Kathmandu and Berlin in Nepal. Chadel Meriem et al. [17] described a simulation analysis of a 9.9kWp grid-connected solar system relied on PVsyst software at Tlemcen. M.M.U. Rashid et al. [18] presented a Simulink/Matlab-based simulation technique to boost up the input volt by boost converter. P. S. Kumar et al. [19] conducted a research in Ramagundam on a 10MW grid-connected solar power plant. R. Singh et al. [20] described the environment-friendly electricity generation method and illustrated the energy from waste heat energy as well. Waqas Ali et al. [21] evaluated a stand-alone PV system and calculated daily electricity consumption with regarding the sizing of a solar PV panels, charge controller, batteries and inverter for the design configuration in Pakistan.
This research is based on the design and analysis of an on-grid solar system using PVsyst software for commercial application in Chandra, Gazipur, Bangladesh [6]. But there is almost no research about rooftop solar cell at Tetulia, Panchagrah. The primary goal of this research is to develop a grid-connected PV system for electricity production and helps to meet the needs of the home. Coal, oil, and gas are some alternative energy sources. However, they are diminishing rapidly and therefore are severely affecting the environment. Solar energy, on the other hand, is environmentally safe, free, renewable, and inexhaustible.
This paper discusses grid-connected PV system. This will reduce the dependence on the grid for generating electricity.
The remaining of the paper proceeds on as: section 2 introduces materials and methods; section 3 establishes result and discussion; section 4 includes the conclusion.
2. Materials and Methods
The PVsyst software is used to construct a fixed PV system producing 11.4kWh to fulfill the average electrical power demands of household consumption. PVsyst is a simulation-based software which was initially designed for measuring and analyzing data from photovoltaic systems. PVsyst software facilitates system configuration design and allows the system to calculate the amount of energy generated. The results of PVsyst software show different simulation variables of calculated energy as monthly, daily, or hourly values. [22]. PVsyst software includes extensive meteo and PV systems components databases, as well as generalized solar energy tools for pumping, grid-connected, standalone and DC-grid (public transportation) PV systems [23]. The grid-connected system is schematically represented in Fig.1, having several primary components; the PV array, inverters, and the end-user loads. The PV system absorbs the solar radiation and converts the solar energy into DC current that flows as electricity. The inverter is required to convert DC current into AC current for the home's appliances. The surplus energy produced by the PV system is sent to the grid [24]. The battery is connected when there is no electricity in the grid or when the weather is cloudy.
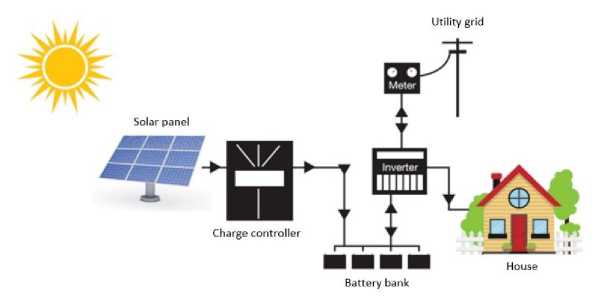
Fig. 1. PV grid connected system with Solar.
-
2.1 Database collection
-
2.1.1 Geographical of site location
Presuming the situation, the test site is Tetulia (latitude 26.491°N, longitude 88.342°E and altitude 87m), Panchagarh, Bangladesh [26]. According to the latitude of the testing site, the tilt angle is 270 . In addition, for fixed axis and one-axis tracking, the sun azimuth angle is zero, and for two-axis tracking, the sun azimuth angle is 00 to 1800 .
-
2.1.2 Energy demand consumption
In a grid-connected system, total energy consumption must be calculated in order to avoid higher costs and oversizing the power system. The electricity consumption is calculated based on the daily power usage and the duration of operation. The design of a solar PV rooftop system for residential load consumption is considered as 8.1kWh/day. In Table 1, the total energy is used on a daily basis =8094Wh/day =8.1kWh/day, hourly load=1556W/h=1.6kW/h~2kW/h
-
2.2 PV module, inverter and battery
Database collection is necessary to assess the critical data that has influenced the performance of system in order to develop a long-term grid-connected system. The data for this research was categorized into two sections (i) site installation area, and (ii) overall energy consumption by required loads. Each value of data has a significant influence on the establishment of an economic system [25].
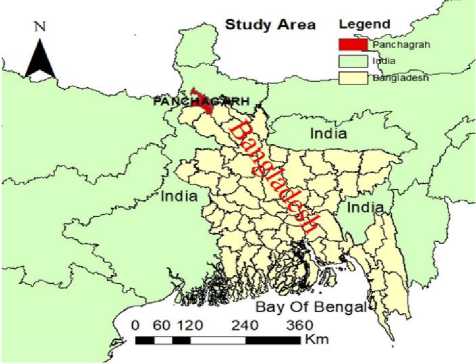
Fig. 2. Map of Tetulia, Panchagarh, Bangladesh
In Fig.2, the combination of yellow and red colors, represent the boundary of Bangladesh. The red color represents the proposed projected area. The green color represents the border of India.
Table 1. Load consumption for home electronic devices.
|
Item |
Power (Watt) |
Number of elements |
Number of hours operation |
Wh per day (Wh/day) |
Hours of operation (W/h) |
Citation |
|
Lamps |
10 |
5 |
6 |
300 |
50 |
|
|
Tv |
50 |
1 |
3 |
150 |
50 |
|
|
Refrigerator |
150 |
1 |
24 |
3600 |
150 |
[27], [28] |
|
Fan |
75 |
4 |
8 |
2400 |
300 |
|
|
Domestic appliances |
500 |
2 |
1.5 |
1500 |
1000 |
|
|
other |
6 |
1 |
24 |
144 |
6 |
|
|
Total |
846W |
8094 |
1556 |
PV module converts the solar radiation into electrical energy. Many PV modules are mapped together to improve the power generation of a solar array. The PV module must be precisely measured in order to serve the load throughout the year. For this project, the 250Wp Generic, 13 mono-crystalline modules are chosen, and the parameters of the selected module are shown in Table 2. The PV array must be aligned at a precise, specific angle to absorb the maximum amount of solar radiation. The panel should be faced to the south for absorbing maximum solar radiation, and should be angled to match the height of the site location for maximum sun exposure. Table 2 shows the specification of the PV module, inverter, and battery. The open circuit voltage of the PV module is 37.4V, maximum output voltage is 30.7V, short circuit current is 8.63A and maximum output current is 8.14A. The Generic 3kW AC inverter model is used. The minimum MPP voltage is 125V and maximum MPP voltage is 440V, absolute maximum PV voltage is 550V of the inverter. The capacity of the lithium-ion battery is 13V 100Ah.
Table 2. PV module, inverter, battery
|
Component |
Specification |
Parameters |
|
PV module |
PV module capacity |
250Wp |
|
Voc |
37.4V |
|
|
V max |
30.7V |
|
|
Isc |
8.63A |
|
|
I max |
8.14A |
|
|
Inverter |
Model |
Generic 3kWac inverter |
|
Minimum MPP voltage |
125V |
|
|
Maximum MPP voltage |
440V |
|
|
Absolute max PV voltage |
550V |
|
|
Battery |
Battery type |
Lithium-ion |
|
Capacity |
13V 100Ah |
-
2.3 System specifications
-
2.3.1 System components
-
2.3.2 Design parameters
System specification describes the functionality and operational parameter of a system. System operating and performance requirements are described in system specifications [29]. The system specification of the proposed project indicates the system components, design parameters, cost estimation, and load consumption.
The components required to build the grid-connected solar system for the case analysis is demonstrated in Fig.3 with some specification. The selection of PV modules and inverter is shown in Fig. 3. The PV power plant capacity is 3kW/h and can generate 11.4 kW/d of electricity when the sun shines 5-6 hours each day. With respect to Fig.3, the total number of 13 PV modules, as well as a 3kW inverter, are required.
The specification of parameter for rooftop PV system are represented in Table 3. The total capacity of the PV plant is 3 kW, required surface is 21 sq. meter which is equivalent to 226.042 sq. feet. The PV panel of 1 kW can generate 5kW of electricity per day on average. Table 3 shows some parameters of the PV panel in the projected area. The total energy consumption is 8.1kW/day where the hourly load is 1.6kW/h. Total power generated by 13 modules is 11.4kW/day and surplus energy is fed to the grid.
Table 3. Calculation steps for rooftop PV system.
|
Parameter |
Specification |
|
Energy consumption |
8.1kWh/day |
|
Hourly load |
1.6kW/h |
|
Selected PV module capacity |
250Wp |
|
Quantity of PV module |
13modules |
|
Total power generated by 13 |
11.4kW/day |
|
modules |
|
|
Excess power feed to grid is |
3.3kW/day |
|
For off-grid, battery requires |
13V, 100Ah |
|
Single battery energy |
1.3kW |
|
Total Battery required |
2 battery |
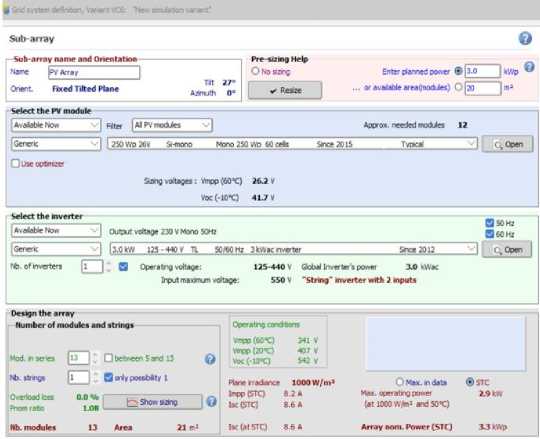
Fig. 3. PV module and inverter selection
2.3.3 Cost estimation
Cost estimation refers to the procedure of estimating costs and other resources needed to complete a project within a certain scope. Cost estimation generates the cost of a project by considering each component needed for the project. Fig.4 shows the cost estimation of the proposed system where the cost of the power plant is $1500, the cost of the inverter is $800, the cost of batteries is $200, the net metering and installation cost is $300. [30].
2.3.4 Load consumption
The energy demand consumption is determined based on the daily power use and operating time which is shown in Fig. 5. For this study, the lighting system contains 5 LED bulbs with a rating power of 50W/day, 1 TV with a rating power of 150W/day, 2 home appliances with a power consumption of 1500W/day, 1 fridge with a power consumption of 3600Wh/day, and 4 fans with a power consumption of 2400Wh/day.
3. Result and Discussion3.1 PV module characteristics
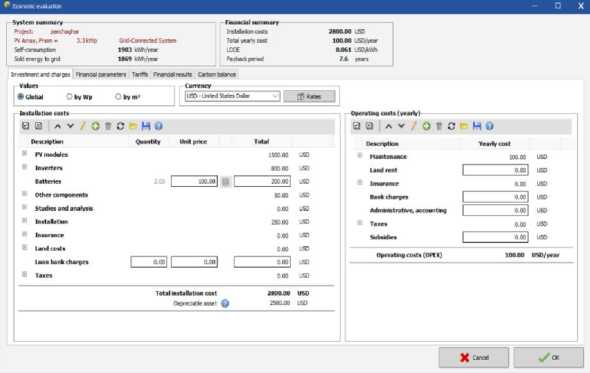
Fig. 4. Cost estimation
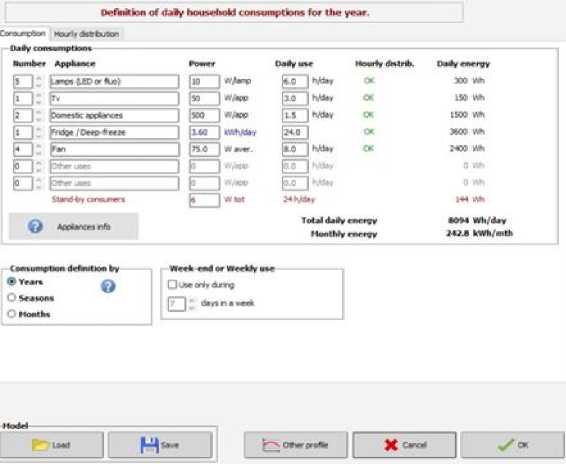
Fig. 5. Household load consumption
Fig.5 demonstrates the daily household load consumption. The daily consumption is 8.1kWh and the monthly consumption is 243kWh, while the hourly load is 2kW. The consumed power supply of every electronic device is on an hourly and daily basis. Hence, the inverter is chosen based on the hourly load whereas the battery is chosen on the daily load.
The analysis and design of an on-grid solar PV system are simulated using PVsyst software. After several calibrations and simulation runs, the most pleasing results are obtained. The manufacturer's data sheet attests to the effectiveness of the PV module's simulation results. Metrological data (temperature, irradiance) determines how well a PV module will perform in practice. The PVsyst software analyzes various weather data from Meteonorm, NASA-SSE and other sites. The different outcomes are depicted in this study; the daily energy output plot including incident variations, performance ratio data plot, array power distribution plot, normalized production including loss diagram [31]. When compared conventional power plants which use oil, coal, and gas to the solar PV offers far lower operating and maintenance costs and no fuel charges Therefore, as long as the sun shines, PV will continue to generate energy. An entirely environmentally friendly and sustainable approach to generate power is with PV panels.
The basic properties of a solar cell are short circuit current (ISC), open-circuit voltage (VOC), fill factor (FF), and solar energy conversion efficiency(η). Several PV module characteristics are discussed for this proposed system.
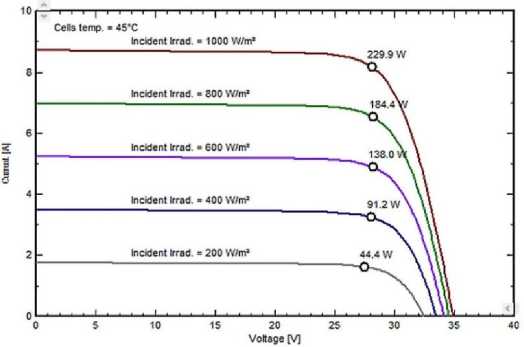
Fig. 6. Voltage vs. current characteristic curve
Fig.6 shows a voltage vs. current curve with a module temperature of 45°C. Power fluctuates with incidental irradiance, with the maximum energy being 229.9W for 1000 W/m2 irradiance and the minimum energy being 44.4W for 200W/m2 irradiance.
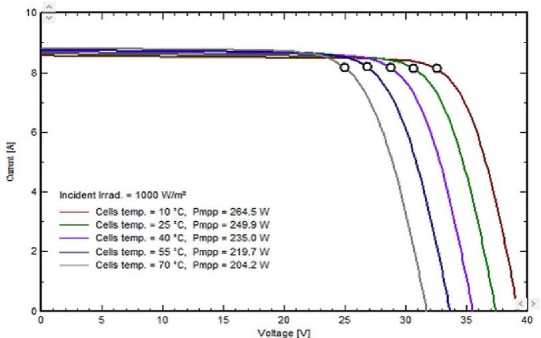
Fig. 7. Voltage verses current with different temperature.
Fig.7 depicts a voltage vs current curve with temperature variations. When the temperature goes up, the voltage drops, and at 10°C, the utmost power is 264.5Wp. The power is inversely correlated to temperature due to the negative thermal coefficient of the material.
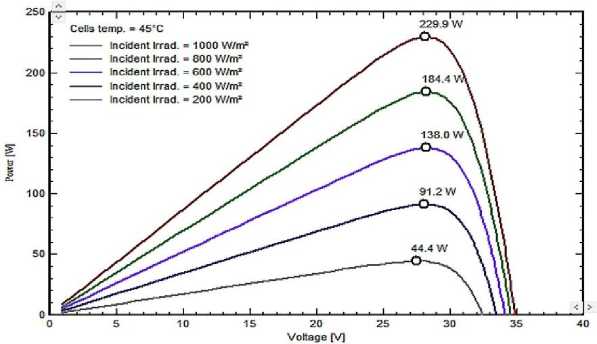
Fig. 8. P-V characteristic curve
Fig.8 shows the P-V characteristic curve. The cell temperature is 45°C and the power fluctuates with incident irradiance. Different colors represent the different incident irradiance. The highest output is 229.9W for the irradiation of 1000W/m2, and the lowest output is 44.4W for the irradiation of 200W/m2.
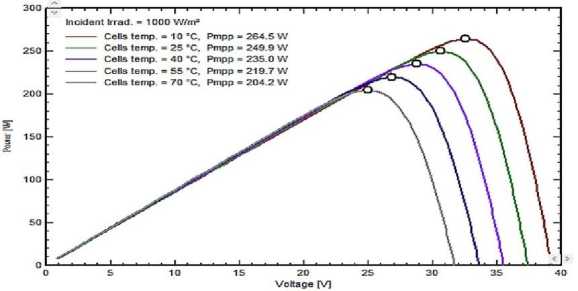
Fig. 9. P-V characteristic curve with varying temperature curve
Fig.9 shows the P-V characteristic curve with varying temperature curve. The maximum power point is 264.5W at 10°C, and the minimum power point is 204.2W at 70°C. According to Fig.9, the power decreases when the temperature increases.
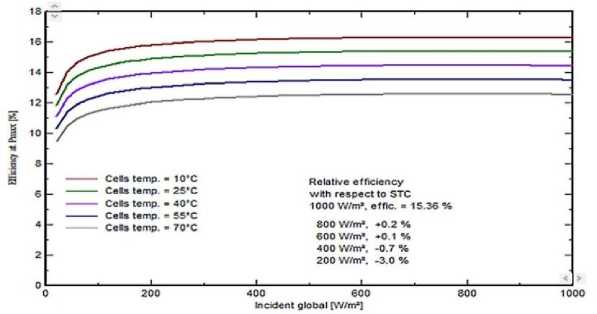
Fig. 10. ɳ vs i curve
Fig.10 shows the efficiency vs incident global curve. As per the graph, the maximum relative performance with regard to STC (standard test condition) is 15.36% for the irradiation of 1000W/m2. The minimum relative performance with regard to STC (standard test condition) is -3.0% for the irradiation of 200W/m2. Different colors represent different cell temperatures.
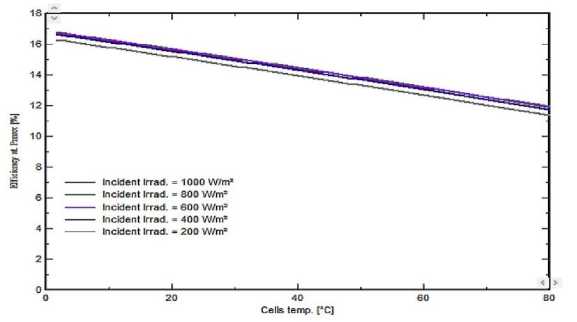
Fig. 11. Efficiency vs. temperature in varying irradiance curve
Fig.11 shows the efficiency vs temperature in varying irradiance curve. The effectiveness at maximum power (Pmax) vs. module temperature by changing the incoming irradiation is shown in Fig.11. The highest irradiation is 1000W/m2 and the lowest irradiation is 200W/m2.
-
3.2 Daily input/outputs of PV plant
-
3.3 Normalized production
The normalized production includes system losses, collection losses, and performance useable energy per installed kWp/day, as shown in Fig.13 which shows the yearly output of normalized power production and loss factor. The normalized power production is 3250Wp. The system has suffered a 7.7% loss, and the loss in the collection (PV-array losses) is 19.2 %. The produced useful energy is 73%
-
3.4 Performance ratio
The amount of energy produced by a PV power plant directly relates to the global incidence on the collector plane [32]. The daily input-output schematic diagram of the solar system as illustrated in Fig.12. The daily input-output schematic diagram demonstrates the fluctuation of energy of the solar system which is delivered to the grid with the variation in global incidence [33].
Fig. 12. Daily input-output variation
Fig.12 illustrates the simulation parameter, which results in a system production of 4172kWh every year. The PV module selection necessarily requires an MPP voltage of 26.2V and an MPP current of 8.14A. The input energy will differ when compared to the output energy value. The highest energy delivered to the grid of 149.4kWh in March, and the lowest energy delivered to the grid of 56.6kWh in July.
The annual average performance value (PR) value of the simulated 250Wp monocrystalline photovoltaic system is 73 %, as shown in Fig.14. The PR value fluctuates modestly on a monthly basis. A quality factors indicates the quality of a PV plant performance ratio. The performance ratio expresses the link between the theoretical and empirical energy outputs of the solar plant. The PR exhibits energy after reducing the losses. The performance ratio is typically about 80% due to inherent losses during operating [34]. The system will be much more effective and productive when the PR value is closer to 80%. The performance ratio (PR) of the PV plant of 3kW with the use of a mono-crystalline photovoltaic system is shown in Fig.14. Overall, the performance ratio of the PV plant is approximately 73%, which is a significant amount [31].
Normalized Production and Loss Factors: Nominal power 3250 Wp
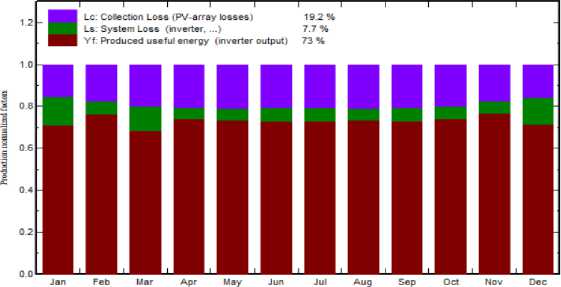
Fig. 13. Normalized production and loss factors.
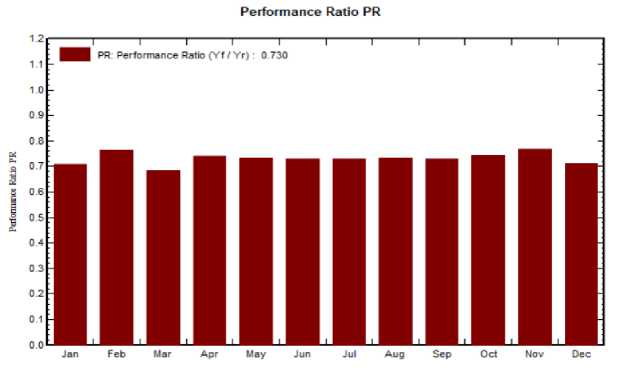
Fig. 14. Performance ratio
-
3.5 Balance and main result
Table 4 shows the balance and main result of the system. Some parameters are assessed for the main simulation result [35]. From the Table 4, the effective energy at the output of the array is 4171.7kWh/year, energy fed to the grid is 1870.9kWh/year, yearly global horizontal irradiation is 1485.4kWh/m2, horizontal diffuse irradiation is 883.23kWh/m2, the ambient temperature is 24.78 °C, and energy from the grid is 1049.8kWh/year.
Legends
Globhor Global horizontal irradiation
Diffhor Horizontal diffuse irradiation
T_Amb Ambient Temperature
Globinc Global incident in coll. Plane
GlobEff Effective Global, corr. For IAM and shadings
Earray Effective energy at the output of the array
E_user Energy supplied to the user
E_Solar Energy from the sun
E_Grid Energy injected into grid
EFrGrid Energy from the grid
Table 4. Balance and main result
Balances and main results
|
January February March April May June July August September October November December |
Globhor Kwh/m2 |
Diffhor Kwh/m2 |
T_Amb oC |
Globinc Kwh/m2 |
GlobEff Kwh/m2 |
Earray Kwh |
E_user Kwh |
E_Solar Kwh |
E_Grid Kwh |
EFrGrid Kwh |
|
96.5 |
55.80 |
16.86 |
122.5 |
116.0 |
337.4 |
250.9 |
148.7 |
134.6 |
102.2 |
|
|
103.7 |
59.94 |
19.88 |
121.6 |
115.1 |
325.4 |
226.6 |
145.7 |
156.3 |
80.9 |
|
|
152.6 |
76.76 |
23.84 |
168.7 |
159.7 |
438.3 |
250.9 |
159.4 |
214.9 |
91.5 |
|
|
151.4 |
85.78 |
25.51 |
152.1 |
143.3 |
392.9 |
242.8 |
169.3 |
19.6 |
73.5 |
|
|
156.1 |
97.04 |
27.65 |
145.4 |
136.3 |
374.2 |
250.9 |
177.0 |
170.1 |
73.9 |
|
|
134.7 |
91.94 |
28.61 |
122.9 |
114.9 |
316.7 |
242.8 |
166.7 |
125.1 |
76.1 |
|
|
114.0 |
82.03 |
29.35 |
104.7 |
97.8 |
270.0 |
250.9 |
148.7 |
99.3 |
102.2 |
|
|
145.3 |
92.11 |
29.48 |
140.2 |
131.5 |
360.5 |
250.9 |
172.2 |
162.5 |
78.7 |
|
|
113.9 |
70.98 |
28.22 |
117.2 |
110.2 |
302.1 |
242.8 |
157.9 |
120.0 |
84.9 |
|
|
115.3 |
64.19 |
26.75 |
131.5 |
124.6 |
341.8 |
250.9 |
153.7 |
163.5 |
97.2 |
|
|
105.4 |
55.87 |
22.31 |
133.7 |
126.8 |
358.3 |
242.8 |
159.6 |
173.7 |
83.2 |
|
|
96.5 |
50.79 |
18.63 |
129.2 |
122.6 |
354.1 |
250.9 |
145.5 |
154.3 |
105.4 |
|
|
Year |
1485.4 |
883.23 |
24.78 |
1589.5 |
1498.8 |
4171.7 |
2954.3 |
1904.5 |
1870.9 |
1049.8 |
-
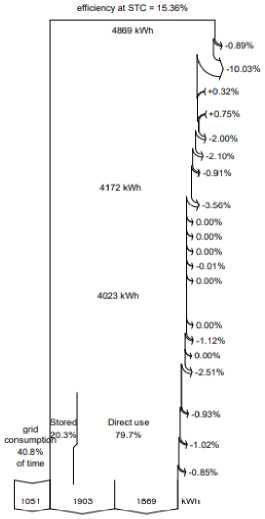
3.6 Loss diagram
Power loss comes from several levels of the PV system due to a variety of factors. In PV arrays, several losses occur and are caused by module mismatch, module quality, ohmic wiring, converter loss during operation, converter loss due to threshold power, battery efficiency loss, charge/discharge current efficiency loss, inverter threshold power loss, etc. [36]. Fig.15 clearly shows the loss diagram throughout the power generation on a yearly basis. The PV loss due to irradiance level is 0.89%, PV loss due to temperature is 10.03%, mismatch loss is 2.1%, ohmic loss is 0.9%, IAM loss is 2.79%, LID loss is 2%, system unavailability is 2%.
Loss diagram
to user to user to gnd from gnd from solar
Global horizontal Irradiation
Global Incident In coll, plane
1AM factor on global
Soiling loss factor
Effective irradiation on collectors
PV conversion
Array nominal energy (at STC efflc.)
PV loss due to irradiance level
PV loss due to temperature
Spectral correction
Module quality loss
UD - Light induced degradation
Mismatch loss, modules and strings
Ohmic wiring loss
Array virtual energy at MPP inverter Lose during operation (efficiency)
Inverter Loss over nomnal inv power
Inverter Loss due to max input current
Inverter Loss over nomnal inv voflaqe
Inverter Loss due to power threshold inverter Lose due to voltage threshold
Available Energy at Inverter Output
AC ohmic loss
Medium voltage transto loss
MV line ohmic loss
System unavadabMy
Battery IN, charger loss
Battery Storage
Battery global loss
(5 22% at the battery contrtbukon)
Battery OUT. ewerter loss
Dispatch. user and grid relrijec-Uuri
Fig. 15. Solar PV loss diagram
4. Conclusion
Design and performance evaluation of a solar PV rooftop system at Tetulia, Panchagrah, is installed with a capacity of 250Wp. PVsyst software is used to analyze and design PV system. The PV rooftop design and total performance evaluation reveals a grid-connected system with a potential of 3kW. The PV module, inverter, and storage selection are determined by the daily load demand of 8.1kW and hourly load demand of 1.6kW in a particular scenario. The overall annual energy supply into the grid is 1871kWh. The highest energy (214.9kWh) of PV roof-top system is sent to the grid in March while the lowest energy (99.3kWh) is delivered in July. For the corresponding residence, the average yearly performance ratio of this particular solar plant is 73%. The tilt angle is 270 and one-axis tracking, the sun azimuth angle is zero. This research enables the user to implement their own PV system that fulfills their criteria, with the opportunity to select the appropriate components such as photovoltaic cells and inverters.This reduces power mismatching losses and increases the PV system's lifespan.
References Feasibility Analysis and Simulation of the Solar Photovoltaic Rooftop System Using PVsyst Software
- T. Jamal, W. Ongsakul, J. G. Singh, S. Salehin, and S. M. Ferdous, “Potential rooftop distribution mapping using Geographic Information Systems (GIS) for Solar PV Installation: A case study for Dhaka, Bangladesh,” International Conference on the Developments in Renewable Energy Technology (ICDRET), Dhaka, Bangladesh, pp. 1–6, May 2014. Doi: 10.1109/ICDRET.2014.6861648.
- P. Yadav, N. Kumar, and S. S. Chandel, “Simulation and Performance Analysis of a lkWp Photovoltaic System Using PVsyst,” International Conference On Computation Of Power,Energy,Information And Communication, pp. 6, 2015.
- T. Gurupira and A. J. Rix, “PV Simulation Software Comparisons: Pvsyst, Nrel Sam And Pvlib,” Conf. Pap. ·, pp. 7, 2017.
- T. F. Express, “Rooftop solar power and regulatory issues,” The Financial Express. https://www.thefinancialexpress.com.bd/views/reviews/rooftop-solar-power-and-regulatory-issues-1640965205 (accessed Jun. 22, 2022).
- T. F. Express, “Introducing floating solar PV technology in Bangladesh,” The Financial Express. https://www.thefinancialexpress.com.bd/national/introducing-floating-solar-pv-technology-in-bangladesh-1589818193 (accessed Jun. 22, 2022).
- K. A. Kader, F. Rahman, N. I. Nahid, Z. Abedin, and D. M. A. Mannan, “Design and Analysis of an On-Grid Solar System Using PVsyst Software for Commercial Application,” Int. J. Sci. Eng. Res., vol. 12, no. 9, pp. 8, 2021.
- M. A. Habib, M. Tanaka, and J. Tanimoto, “How does conformity promote the enhancement of cooperation in the network reciprocity in spatial prisoner’s dilemma games?,” Chaos Solitons Fractals, vol. 138, pp. 109997, Sep. 2020. Doi: 10.1016/j.chaos.2020.109997.
- M. A. Habib, K. A. Kabir, and J. Tanimoto, “‘Do humans play according to the game theory when facing the social dilemma situation?’ A survey study.,” Evergreen Joint Journal of Novel Carbon Resource Sciences & Green Asia Strategy, Vol. 07, Issue 01, pp 07-14, March, 2020.
- M. A. Habib, “The application of asymmetric game in the electrical power market,” Journal of Electrical Engineering, Electronics, Control and Computer Science –JEEECCS (Accepted), 2022.
- M. A. Habib, “‘Can People Detect Dilemma Strength in A 2 Player 2 Strategy Game?’: A Survey Game,” Proceeding of International Exchange and Innovation Conference on Engineering & Sciences (IEICES) pp.5, 2019.
- M. A. Habib, “Wind Speed Data And Statistical Analysis For Rangpur District In Bangladesh,” Journal of Electrical Engineering, Electronics, Control and Computer Science JEEECCS, Vol 8, Issue 30, pp. 1-10, 2022.
- M. A. Habib, K. M. A. Kabir, and J. Tanimoto, “Evolutionary Game Analysis For Sustainable Environment Under Two Power Generation Systems,” Evergreen Joint Journal of Novel Carbon Resource Sciences & Green Asia Strategy, Vol. 09, Issue 02, pp323-341, June 2022.
- V. Sharma and S. S. Chandel, “Performance analysis of a 190 kWp grid interactive solar photovoltaic power plant in India,” Elsevier, Energy, vol. 55, pp. 476–485, Jun. 2013. Doi: 10.1016/j.energy.2013.03.075.
- M. U. Rashid, M. Rahman, M. A. Habib, and M. M. Hasan, “Study and Analysis of Hybrid Energy Options for Electricity Production in Rangpur, Bangladesh,” Asian Journal of Current Research 3(1): pp. 9-14, 2018. ISSN: 2456-804X.
- D. J. Rekhashree and H. Naganagouda, “Study on design and performance analysis of solar PV rooftop standalone and on grid system using PVsyst,” Int Res J Eng TechnolIRJET, vol. 5, no. 07, pp. 41–48, 2018.
- P. Karki, B. Adhikary, and K. Sherpa, “Comparative study of grid-tied photovoltaic (PV) system in Kathmandu and Berlin using PVsyst,” in 2012 IEEE Third International Conference on Sustainable Energy Technologies (ICSET), pp. 196–199, Sep. 2012. Doi: 10.1109/ICSET.2012.6357397.
- C. Meriem, B. Boumdiene, C. Asma, B. M. Mohamed, and S. Aicha, “Study of a photovoltaic system connected to the network and simulated by the code PVSYST,” North African Workshop on Dielectic Materials for Photovoltaic Systems (NAWDMPV), Tlemcen, Algeria, pp. 1–5, Oct. 2014. Doi: 10.1109/NAWDMPV.2014.6997605.
- M. U. Rashid, M.A. Habib, and M. M. Hasan, “Design and Construction of the Solar Photovoltaic Simulation System With The Implementation Of Mppt And Boost Converter Using Matlab/Simulink,” Asian Journal of Current Research 3(1): pp 27-36, 2018. ISSN: 2456-804X
- B. Shiva Kumar and K. Sudhakar, “Performance evaluation of 10 MW grid connected solar photovoltaic power plant in India,” Energy Rep., vol. 1, pp. 184–192, Nov. 2015. Doi: 10.1016/j.egyr.2015.10.001.
- T. J. Coutts, “Thermophotovoltaic principles, potential, and problems,” in AIP Conference Proceedings, Denver, Colorado (USA), pp. 217–234, 1997. Doi: 10.1063/1.53449.
- W. Ali, H. Farooq, A. U. Rehman, Q. Awais, M. Jamil, and A. Noman, “Design Considerations of Stand-Alone Solar Photovoltaic Systems,” International Conference on Computing, Electronic and Electrical Engineering (ICE Cube), Quetta, pp. 1–6, Nov. 2018. Doi: 10.1109/ICECUBE.2018.8610970.
- R. Kumar, C. S. Rajoria, A. Sharma, and S. Suhag, “Design and simulation of standalone solar PV system using PVsyst Software: A case study,” Mater. Today Proc., vol. 46, pp. 5322–5328, Jan. 2021. Doi: 10.1016/j.matpr.2020.08.785.
- “Home,” PVsyst. https://www.pvsyst.com/ (accessed Apr. 19, 2022).
- M. H. S. Alrashdan, E. N. AlFlahat, M. O. Saeed, and S. M. Kreishan, “Modelling and Simulation of PV ON Grid System Producing 10kwh in Ma’an Development AreaUsing PVSYSTSoftware.,” IOSR Journal of Electrical and Electronics Engineering (IOSR-JEEE), Volume 14, Issue 3 Ser. III, PP 31-37, (May. – June. 2019). e-ISSN: 2278-1676, p-ISSN: 2320-3331.
- Y. M. Irwan et al., “Stand-Alone Photovoltaic (SAPV) System Assessment using PVSYST Software,” Energy Procedia, vol. 79, pp. 596–603, Nov. 2015. Doi: 10.1016/j.egypro.2015.11.539.
- “Bangladesh Map,” GIS Geography, Nov. 15, 2017. https://gisgeography.com/bangladesh-map/ (accessed Jun. 24, 2022).
- “Power Consumption of Typical Household Appliances.” https://www.daftlogic.com/information-appliance-power-consumption.htm (accessed Apr. 08, 2022).
- “Home Appliances Power Consumption Table,” Unbound Solar. https://unboundsolar.com/solar-information/power-table (accessed Apr. 08, 2022).
- S. W. U. March 25 and 2020, “What Is a System Specification?” Reference.com, Aug. 04, 2015. https://www.reference.com/world-view/system-specification-395eba13f70c8e06 (accessed Jun. 25, 2022).
- “SREDA | E-Service Desk for Solar.” https://solar.sreda.gov.bd/ (accessed Jul. 14, 2022).
- A. Alnoosani, M. Oreijah, M. Alhazmi, Y. Samkari, and H. Faqeha, “Design of 100MW Solar PV on-Grid Connected Power Plant Using (PVsyst) in Umm Al-Qura University,” International Journal of Science and Research (IJSR) vol. 8, no. 11, pp. 8, 2018. ISSN: 2319-7064.
- A. Soualmia and R. Chenni, “Modeling and simulation of 15MW grid-connected photovoltaic system using PVsyst software,” in 2016 International Renewable and Sustainable Energy Conference (IRSEC), Marrakech, pp. 702–705, Nov. 2016. Doi: 10.1109/IRSEC.2016.7984069.
- T. Hasarmani, R. Holmukhe, and S. Tamke, “Performance Analysis of Grid Interfaced Photovoltaic Systems for Reliable Agri-Microgrids using PVsyst,” in 2019 International Conference on Information and Communications Technology (ICOIACT), Yogyakarta, Indonesia, pp. 894–898, Jul. 2019. Doi: 10.1109/ICOIACT46704.2019.8938561.
- K. D. Syahindra, S. Ma’arif, A. A. Widayat, A. F. Fauzi, and E. A. Setiawan, “Solar PV System Performance Ratio Evaluation for Electric Vehicles Charging Stations in Transit Oriented Development (TOD) Areas,” E3S Web Conf., vol. 231, pp. 02002, 2021. Doi: 10.1051/e3sconf/202123102002.
- N. M. Kumar, M. R. Kumar, P. R. Rejoice, and M. Mathew, “Performance analysis of 100 kWp grid connected Si-poly photovoltaic system using PVsyst simulation tool,” Energy Procedia, vol. 117, pp. 180–189, Jun. 2017. Doi: 10.1016/j.egypro.2017.05.121.
- K. C. Rout and P. Kulkarni, “Design and Performance evaluation of Proposed 2 kW Solar PV Rooftop on Grid System in Odisha using PVsyst,” IEEE International Students’ Conference on Electrical,Electronics and Computer Science (SCEECS), Bhopal, India, pp. 1–6, Feb. 2020. Doi: 10.1109/SCEECS48394.2020.124.
