Feasibility of simultaneous integrated boost for high-dose treatment of high-risk prostate cancer

Author: Sukhikh E.S., Sukhikh L.G., Taletsky A.V., Startseva Zh.A., Verkhoturova V.V., Rozanov V.V., Selikhova E.A.
Journal: Сибирский онкологический журнал @siboncoj
Section: Клинические исследования
Article in issue: 3 т.22, 2023.
Free access
Background. Radiation therapy for high-risk prostate cancer presents a challenge for cancer radiotherapists. The improvement of treatment outcomes is associated with radiation dose escalation and prophylactic irradiation of lymph nodes, therefore, the development of the new treatment schemes is needed. Simultaneous integrated boost technique based on the volumetric modulated arc therapy is the most efficient treatment option. Material and Methods. The anatomical data of 10 patients with high-risk prostate cancer was used for dosimetry-based treatment planning. Both simultaneous integrated boost and sequential boost technique were considered. The treatment planning goal was to deliver the equivalent dose of 96 Gy at 2 Gy per fraction (EQD2=96 Gy) (α/β=1.5 Gy) to the prostate, EQD2=62.5 Gy to the seminal vesicles and EQD2=50 Gy to lymph nodes avoiding damaging the organs at risk, mainly the bladder and rectum. The irradiation was based on volumetric modulated arc therapy with two partially coplanar arcs and two rotations at each arc. The obtained dose distributions were compared with respect to dose-volume histograms and equivalent uniform doses (EUD). Results. In the case of sequential boost, the minimal dose delivered to the prostate was equal to2cc95.9 ± 2.1 Gy, EUD=104.9 ± 1.7 Gy. The dose delivered to 2 cm3 ( D ) bladder was 97.4 ± 2.0 Gy. Normal tissue2cccomplication probability (NTCP) was 1.64 %. The dose delivered to 2 cm3 ( D ) rectum was 103.4 ± 9.2 Gyand NTCP was 27.4 %. In the case of simultaneous integrated boost, the minimal dose delivered to the prostate was equal to 90 . 4 ± 2 . 3 Gy, EUD= 103 . 9 ± 1 . 3 Gy. The bladder dose was as high as D 2cc = 96 . 1 ± 5 . 2 Gy, NTCP= 0 . 176 ± 0 . 132 %, the rectum dose - D 2cc = 81 . 1 ± 6 . 0 Gy, NTCP= 2 . 34 ± 1 . 92 %. Conclusion. Volumetric modulated arc therapy along with simultaneous integrated boost have shown the feasibility of simultaneous irradiation of the prostate, seminal vesicles and lymph nodes up to the prescribed dose values without significant over irradiation of the organs at risk (OARs). Dose values in the tumor as high as EUD= 103 . 9 ± 1 . 3 Gy along with prophylactic irradiation of lymph nodes may result in higher tumor control probability value and should be considered for clinical trials.
Prostate cancer, volumetric modulated arc therapy, hypofractionated radiotherapy, simultaneous integrated boost, high risk
Short address: https://sciup.org/140300181
IDR: 140300181 | UDC: 616.65-006.6-08:615.849.1 | DOI: 10.21294/1814-4861-2023-22-3-57-65
Осуществимость одновременного интегрированного буста для высокодозного лечения рака предстательной железы высокого риска
Введение. Лучевая терапия рака предстательной железы высокого риска является важной проблемой клинической онкологии. Повышение эффективности лечения связано с увеличением подводимой дозы и профилактическим облучением лимфатических узлов, поэтому необходима разработка новых схем лечения. Одновременная интегрированная буст-методика на основе ротационной лучевой терапии с модуляцией интенсивности излучения является способом выполнения обоих условий. материал и методы. Анатомические данные 10 пациентов с раком предстательной железы высокого риска были использованы для дозиметрического планирования лечения. Рассматривались как метод одновременного интегрированного буста, так и метод последовательного буста. Целью планирования было облучение предстательной железы до эквивалентной дозы EQD =96 Гр (α/β=1,5 Гр), семенных пузырьков - до EQD2 =62,5 Гр и лимфатических узлов - до EQD =50 Гр без негативного влияния на органы риска, в основном на мочевой пузырь и прямую кишку. Облучение проводилось на основе ротационной лучевой терапии с модуляцией интенсивности излучения с двумя частично компланарными арками и двумя поворотами на арку. Полученные распределения дозы сравнивались с гистограммами «доза-объем» и эквивалентной равномерной дозы (EUD). Результаты. В случае последовательного буста минимальная доза в предстательной железе была равна 95,9 ± 2,1 Гр, EUD =104,9 ± 1,7 Гр. Доза в2ccмочевом пузыре в 2 cm3 ( D ) составила 97,4 ± 2,0 Гр, вероятность осложнений со стороны нормальнойткани - NTCP =1,64 %. Доза в прямой кишке составила D 2cc=103,4 ± 9,2 Гр, NTCP =27.4 %. В случаеодновременного интегрированного усиления минимальная доза в простате была равна 90 , 4 ± 2 , 3 Гр, EUD= 103 , 9 ± 1,3 Гр. Доза в мочевом пузыре составила D 2cc = 96 , 1 ± 5 , 2 Гр, NTCP= 0 , 176 ± 0 , 132 %, в прямой кишке - D 2cc = 81 , 1 ± 6 , 0 Гр, NTCP= 2 , 34 ± 1 , 92 %. Заключение. Ротационная лучевая терапия смодуляцией интенсивности излучения с одновременным интегрированным бустом показала возможность одновременного облучения предстательной железы, семенных пузырьков и лимфатических узлов до предписанных значений дозы без значительного переоблучения органов риска. Значения дозы в опухоли, такие как EUD= 103 , 9 ± 1 , 3 Гр, наряду с профилактическим облучением лимфатических узлов, могут привести к более высокому значению вероятности контроля опухоли и должны быть рассмотрены для клинических испытаний.
Text of the scientific article Feasibility of simultaneous integrated boost for high-dose treatment of high-risk prostate cancer
The new millennium is notable for significant achievements in the care of cancer patients. The active introduction of modern diagnostic methods into clinical practice, mainly in screening programs, makes it feasible to identify diseases at an early stage. It fully applies to prostate carcinoma [1].
According to P.A. Herzen Moscow Research Institute Institute’s cancer registry data, 45,763 new cases of prostate cancer were diagnosed, and 13,205
Table 1/Òàблицà 1
Average volumes, standard deviations (S.D.) and confidence intervals (CI) at p=0 . 95 of the delineated structures (contours)
Ñðåдниå îбúåмы, ñтàндàðтныå îтêлîнåния (S.D.) и дîвåðитåльныå интåðвàлы (CI) пðи p=0,95 îчåðчåнныõ ñтðóêтóð (êîнтóðы)
External beam radiotherapy (EBRT) is widely used for the prostate cancer treatment. According to the Russian standards, a common treatment scheme prescribes the delivery of total doses in the range of 70–80 Gy with doses per fraction equal to 1 . 8–2 Gy. Different clinical trials demonstrated that dose increase is the key point to effective treatment. Prostate cancer is characterized by the low α/β ratio equal to 1.5 Gy as stated in Refs. [3, 4]. Further, the α/β ratios of the nearest organs at risk (OARs) are equal to α/ β blad = 3 Gy for the bladder and α/β rec = 3 . 9 Gy for the rectum. This fact has become the key point to start the worldwide development and implementation of hypofractionated treatment schemes. For the last 15 years, the stereotactic body radiation therapy (SBRT) of prostate cancer has been thoroughly investigated because of the possibility to deliver a full treatment course in 4–6 fractions [4]. Several clinical trials were conducted using SBRT for high-risk prostate cancer patients who received 32-37 Gy in 4 or 5 fractions ( EQD 2 =85–108 Gy), with the 5-year biochemical recurrence-free survival rates of 69–91 % [5].
SBRT for high-risk prostate cancer does not allow prophylactic whole-pelvis irradiation that is associated with increase in biochemical recurrence-free survival rates [6]. Sequential boost (SEQ) and simultaneous integrated boost (SIB) are two possible ways to increase dose delivered to the prostate and pelvic lymph nodes. The goal of this study was to compare SEQ and SIB schemes for high-risk prostate cancer treatment in order to increase total dose up to EQD 2 =96 Gy.
Material and Methods
The anatomical data of 10 patients with high-risk prostate cancer (T2cN0M0–T4N0M0 stage) were selected for this study (PSA nadir of 14.4–30.0 ng/ml and Gleason score in the range from 8 to 10). The patients’ tomographic data were obtained using a Toshiba Aq-uilion LB computer tomograph (CT) with 3 mm slice thickness. Before the CT scanning of an abdominal-pelvic region, the patients were immobilized in the treatment supine position using the Combifix frame [7]. The internal organs were fixed following the recommendations in Ref. [8]. The bladder was filled by drinking a fixed amount of water.
The same clinician delineated three clinical target volumes (CTV) for each patient, namely, the prostate ( CTVpr ), seminal vesicles ( CTVsv ) and lymph nodes ( CTVln ). The planning target volumes (PTVs) included CTVs and small margin (7 mm for CTVpr and CTVsv , and 10 mm for CTVln ). The following radiobiological ratios were assumed: ( α/β ) pr= 1 . 5 Gy, ( α/β ) sv= 10 Gy, ( α/β ) ln= 10 Gy for the prostate, seminal vesicles and lymph nodes, respectively.
The OARs included the rectum, bladder and femoral heads. Table 1 presents the average volumes, standard deviations and confidence intervals ( p= 0 . 95) of the delineated structures (contours) (Table 1).
The following irradiation schemes were prescribed in order to deliver equivalent dose EQD 2 =96 Gy to the prostate. In the case of SIB, the simultaneous delivery of 75 Gy to the prostate ( PTVpr ), 62.5 Gy to seminal vesicles ( PTVsv ) and 50 Gy to lymph nodes ( PTVln ) at 25 fractions was prescribed. In the case of SEQ, the three-stage delivery was planned: irradiation of all PTVs up to 50 Gy at 25 fractions, 12.5 Gy boost to PTVpr and PTVsv at 5 fractions and final 18.4 Gy boost to PTVpr at 4 fractions. The prescription for CTVpr was to deliver no less than 98 % of the prescribed physical dose to 98 % of the contour volume. For other CTVs and PTVs the limitation was equal to 95 % of physical dose to 95 % of volume.
All treatment plans were simulated using the Monaco treatment planning system (TPS) v5.51 (Elekta Instrument AB, Stockholm) on the Elekta Synergy linac [9] with photon beam energy equal to 10 MV. A VMAT with two partially coplanar arcs and two rotations at each arc was used. The first arc rotated from 190 to 170 degrees clockwise with a collimator angle equal to +45 degrees. The second arc rotated from 170 to 190 degrees counterclockwise with the collimator angle equal to -45 degrees. The plan isocenter was situated in the center of PTVln structure. The grid spacing was equal to 3 mm. The beamlet width was equal to 3 mm. The statistical uncertainty per calculation based on the ‘Monte Carlo Photon’ algorithm was equal to 0.8 %. The minimal segment width was equal to 0.9 cm. The maximal number of control points per arc was equal to 150.
During the treatment planning in TPS, the combinations of dose-volume and biological cost functions were used for better target irradiation and OARs sparing. For all CTVs, PTVpr and PTVsv the ‘Target EUD’ function was combined with ‘Quadratic Overdose’ in order to keep maximal value of physical doses within 110 % of the prescribed dose values. The function ‘Target Penalty’ was added for the PTVln to spare OARs. The biological functions ‘Serial’ and ‘Parallel’ as well as their combination were used for the OARs allowing simultaneous limitation of the maximal dose in the OAR and minimisation of normal tissue complication probability (NTCP).
The obtained treatment plans were compared with respect to EQD 2 dose-volume histograms (DVH), equivalent uniform dose ( EUD ) and NTCP. EUD and NTCP were calculated using the Niemierko approach [10, 11]:
EUD= |5^U ^ "Ч ) .
Here, Vi is the part of the target volume irradiated by a dose DtCLiVi = V), a is the specific parameter equal to a = –10 for prostate cancer, n f is the number of fractions. Differential DVHs for the CTVs and PTVs obtained during the Monaco treatment planning were used for the EUD calculation.
The NTCP can be calculated based on the EUD value as follows [10, 11]:
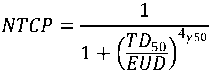
where TD 50 is the 50 % damage dose, i.e. NTCP = EUD = TDS0 = 50% , γ 50 is a parameter that depends on the steepness of the NTCP curve. During the whole-pelvic irradiation of prostate cancer, the rectum and bladder are irradiated to the highest doses if one does not take into account urethra that is naturally included in PTV pr . The following parameter values were used for it: α/β rec =3.9 Gy, TD 50 rec =80 Gy, γ 50 rec =4 and α rec =8.33 [11 – 13]; α/β blad =3 Gy, TD 50 blad =80 Gy, γ 50 blad =4 and α blad =2 [12].
Results
During the dosimetric simulation in TPS both SIB and SEQ treatment plans and dose distributions were developed for anatomic data of each patient. Fig. 1
shows DVHs averaged over all ten patients for contours of CTVpr (red curve), PTVpr (blue curve), bladder (green curve) and rectum (brown curve). The dashed lines show the standard deviations. In Fig. 1 one can see that developed plans are close to each other with respect to irradiation of the tumour. The DVHs for the bladder and rectum have a larger standard deviation due to anatomical peculiarities of the patients.
Table 2 shows the averaged over all patients minimal EQD 2 dose in the CTVs and PTVs ( D @ V =100 %) in the form of a mean value, standard deviation and confidence interval at confidence level of p= 95 %. For the CTVpr the maximum dose ( D @ V =2 %) and EUD values are also presented in Table 2. In the case of SEQ both minimal and maximum doses are the sums of minimal and maximum doses obtained during each irradiation stage, respectively.
The dosimetric treatment planning results presented in Fig. 1 and in Table 2 demonstrate that developed treatment plans delivered dose to the targets very effectively. In the case of SIB, minimal EQD 2 isodose in CTVpr contour amounted 94 %. In the case of SEQ, the result is even better and minimal isodose was as high as 100 %. Maximal EQD 2 dose in CTVpr contour was almost equivalent for SIB and SEQ techniques and was within 115 % of the prescribed EQD 2 dose. At the same time, physical dose was within 110 % limit for all patients that absolutely corresponded to the prescription. Despite the minimal dose difference, the EUDs for SIB and SEQ were very close ( EUDSIB= 103 . 9 ± 1 . 3 Gy and EUDSEQ= 104 . 9 ± 1 . 7 Gy) that allows to expect almost equivalent treatment efficiency according to Niemierko’s tumor control probability (TCP) model [10, 11]. In the case of PTVpr irradiation, minimal SIB EQD 2 dose delivered to 100 % of the contour volume amounted 80.3 % that coincides to physical dose 87.3 % assuming 25 fractions and α/β= 1 . 5 Gy. SEQ minimal dose was higher resulted in 89.3 %.
Table 3 presents the OARs irradiation limits according to RTOG recommendations and treatment planning results. Table 3 shows that the developed SIB plans were within RTOG limitations both for the bladder and the rectum. There were several patients with nominal over irradiation at dose levels EQD 2 =74 Gy for the rectum and EQD 2 =79 Gy for the bladder. In the case of SEQ, there was no way to calculate total dose-volume irradiation to compare with RTOG limitations. With respect to dose limitation in 2 cm3 of the contour volume, SIB technique demonstrated obtained dose value ≈ 6 Gy higher than the limit both for the rectum and the bladder. In the case of SEQ, dose in the bladder was approx. 7 Gy higher than D 2 cc limit, while dose in the rectum significantly exceeded the limit. Table 3 also shows that NTCP values for the bladder irradiation were within 5 % for both SIB and SEQ as well as for the rectum in the case of SIB. In the case of SEQ, the rectum NTCP value was as high as 27 . 4 ± 10 . 1 % that demonstrated significant probability of the OAR radiation damage.
Table 2/Òàблицà 2
|
Contour/Контур |
SIB, EQD 2 Gy |
SEQ, EQD 2 Gy |
|
CTVpr , min dose/ CTVpr , мин. доза |
90 . 4 ± 2 . 3 [88 . 8 , 92 . 0] |
95 . 9 ± 2 . 1 [94 . 4 , 97 . 4] |
|
CTVpr , max dose/ CTVpr , макс. доза |
110 . 6 ± 1 . 4 [109 . 6 , 111 . 6] |
110 . 5 ± 2 . 0 [109 . 0 , 111 . 9] |
|
CTVpr , EUD |
103 . 9 ± 1 . 3 [103 . 0 , 104 . 8] |
104 . 9 ± 1 . 7 [103 . 7 , 106 . 1] |
|
PTVpr , min dose/ PTVpr , мин. доза |
77 . 1 ± 2 . 5 [75 . 3 , 78 . 9] |
85 . 8 ± 3 . 7 [83 . 2 , 88 . 5] |
|
CTVsv , min dose/ CTVsv ,мин. доза |
64 . 9 ± 0 . 9 [64 . 3 , 65 . 6] |
74 . 2 ± 6 . 2 [69 . 7 , 78 . 6] |
|
PTVsv , min dose/ PTVsv , мин. доза |
60 . 5 ± 2 . 5 [58 . 7 , 62 . 2] |
60 . 9 ± 4 . 1 [58 . 0 , 63 . 9] |
|
CTVln , min dose/ CTVln , мин. доза |
47 . 8 ± 0 . 9 [47 . 1 , 48 . 4] |
48 . 9 ± 1 . 0 [48 . 2 , 49 . 6] |
|
PTVln , min dose/ PTVln , мин. доза |
44 . 7 ± 0 . 8 [44 . 1 , 45 . 3] |
45 . 0 ± 1 . 3 [44 . 1 , 46 . 0] |
Table 3/Òàблицà 3
|
Parameter/ Параметр |
Bladder/Мочевой пузырь |
Rectum/Прямая кишка |
||||
|
Limitation/ Ограничение |
SIB |
SEQ |
Limitation/ Ограничение |
SIB |
SEQ |
|
|
EQD 2=59 Gy |
– |
– |
– |
V< 50 % |
23 . 8 ± 10 . 2 % |
– |
|
EQD 2=64 Gy |
V< 50 % |
22 . 9 ± 4 . 8 % |
– |
V< 35 % |
19 . 4 ± 8 . 8 % |
– |
|
EQD 2=69 Gy |
V< 35 % |
19 . 9 ± 4 . 2 % |
– |
V<25 % |
14 . 9 ± 6 . 9 % |
– |
|
EQD 2=74 Gy |
V< 25 % |
16 . 8 ± 3 . 7 % |
– |
V< 15 % |
10 . 7 ± 5 . 4 % |
– |
|
EQD 2=79 Gy |
V <15 % |
14 . 1 ± 3 . 2 % |
– |
– |
– |
– |
|
D 2 cc Gy |
<90Gy |
96 . 1 ± 5 . 2 Gy |
97 . 4 ± 2 . 0 Gy |
< 75 Gy |
81 . 1 ± 6 . 0 Gy |
103 . 4 ± 9 . 2 Gy |
|
NTCP % |
<5 % |
0 . 2 ± 0 . 1 % |
1 . 6 ± 1 . 1 % |
< 5 % |
2 . 3 ± 1 . 9 % |
27 . 4 ± 10 . 1 % |
Note: D 2 cc – Dose in 2 cm3 of the contour volume.
Примечание: D2cc – доза в 2 см3 объема контура.
EQD2 dose coverage of the CTVs and PTVs averaged over all patients
Пîêðытиå дîзîé EQD2 CTVs и PTVs в ñðåднåм пî вñåм пàциåнтàм
OARs irradiation results
Ðåзóльтàты îблóчåния êðитичåñêиõ îðгàнîв
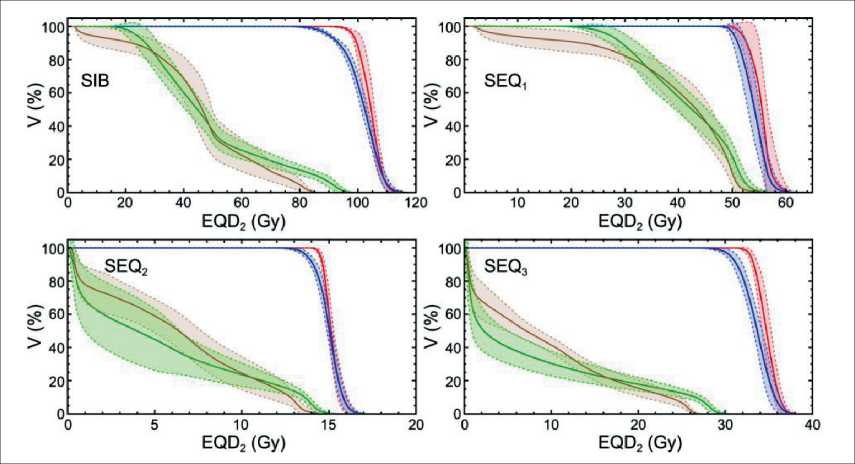
Fig. 1. DVHs for developed SIB and SEQ plans. Solid curves show average values, dashed curves show standard deviations. Red curve – CTVpr , blue curve – PTVpr , green curve – bladder, brown curve – rectum. The prescribed dose value was p p EQD 2=96 Gy
Рис. 1. DVHs для разработанных планов SIB и SEQ. Сплошные кривые показывают средние значения, пунктирные кривые – стандартные отклонения. Красная кривая – CTVpr; синяя кривая – PTVpr; зеленая кривая – мочевой пузырь; коричневая кривая – прямая кишка. Предписанное значение дозы составило EQD2=96 Гр
Discussion
Dosimetric comparison of SIB and SEQ treatment plans showed that both techniques allowed to deliver the high-value prescribed doses to all targets that included prostate, seminal vesicles and lymph nodes. In the case of SEQ, the minimal dose in the solid tumour CTVpr and the dose in the PTVpr were significantly higher than the doses delivered during SIB irradiation ( EQD2 SEQ =95.9 Gy vs EQD2 SIB =90.4 Gy). The payback was the increased level of the OARs irradiation in the case of SEQ. Rectum irradiation was unfavourable in the case of SEQ resulted in D 2 cc= 103 . 4 ± 9 . 2 Gy and average NTCP level as high as 27.4 %. SIB irradiation also resulted in nominal over irradiation of the OARs. However, the NTCP values were within 5 %. According to Sumida et al., NTCP values that are lower than 5 % are clinically acceptable following ‘the TD 5 / 5 concept, which is defined as the tolerated NTCP of 5 % within five years after radiation therapy’ [15]. Despite the difference in minimal doses in CTVpr contour, the EUD values for SIB and SEQ were almost equal ( EUD 104 Gy).
Increase in the treatment efficiency of localized high-risk prostate cancer is associated with increase in equivalent dose EDQ 2 delivered to the solid tumor. The prostate cancer radiobiological ratio is equal to α/β= 1 . 5 Gy [2, 3]. Such value allows EDQ 2 dose increase due to hypofractionated radiation that could be delivered in different ways. The first option is to use moderate hypofractionation with doses up to 3 Gy per fraction delivered by EBRT (IMRT or VMAT). Both SIB and SEQ techniques may be used. The second option is the high-dose-rate brachytherapy boost after EBRT. Both first and second options allow irradiation of solid tumor and prophylactic irradiation of lymph nodes. The third option is based on SBRT with high fraction dose that could be used for solid tumor irradiation, only, excluding seminal vesicles and lymph nodes.
Arcangeli et al. presented results of comparison of conventionally-fractionated and hypofractinated EBRT treatment of high-risk prostate cancer [16]. In 2002– 2007, 168 patients were treated in randomized trial either conventionally (80 Gy, 40 fraction) or in the hypofractionated mode (62 Gy, 20 fractions – EQD 2 =81 . 5 Gy at α/β= 1 . 5 Gy). The 10-year biochemical recurrence-free survival rates were 72 and 65 % in hypofractionated and conventional groups, respectively. The overall survival was also higher in the hypofractionated group, being 75 vs 64 %. Thus, a long follow-up period showed that moderate hypofractionation resulted in better prognoses both due to shorter overall treatment time and slightly higher EQD 2 dose value. Moderately-hypofractionated therapy also showed no significant increase of toxicity. The difference was observed only for Grade 1 long-term GU toxicity [16].
Tamihardja et al. reported long-term outcome of moderately hypofractionated radiotherapy of high- risk prostate cancer based on image-guided IMRT or VMAT [17]. The dose was delivered in the SEQ mode. The doses delivered to the high-dose PTV that included prostate and proximal 2 cm of the seminal vesicles amounted 76.2 Gy in 33 fractions (EQD2=83 Gy at α/β=1.5 Gy). Low-dose PTV that included base of seminal vesicles was irradiated up to 60 Gy (1.82 Gy per fraction). Pelvic lymph nodes of the patients were irradiated up to 45.5 Gy (1.82 Gy per fraction) [18]. The 5-year biochemical relapse-free survival was 79.4 % for high-risk disease. The 5- year prostate cancer-specific survival was 89.3 %. Cumulative 5-year late GU toxicity and late GI toxicity grade ≥2 was observed in 26.3 and 12.1 % of the patients, respectively. Cumulative 5-year late grade 3 GU/GI toxicity occurred in 4.0/1.2 % [17].
Yamazaki et al. investigated the dose increase efficiency in the case of very-high risk prostate cancer with the worst prognosis ‘including clinical stage T3b-T4, primary Gleason pattern 5, or more than four biopsy cores with Gleason score 8–10’ [19]. Yamazaki compared EBRT with prescribed dose values equal to EQD 2 =72 Gy (group A) with different boost schemes that included either EBRT boost up to EQD 2 =80 Gy or high-dose brachytherapy boost up to EQD 2 =129 Gy (group B). Group B showed superior 5-year biochemical disease-free survival rate (81.2 % vs. 66.5 % at group A. Accumulated late toxicities in gastrointestinal and genitourinary tracts with Grade ≥ 2 were similar among groups [19]. Yamazaki concluded that both high-dose EBRT and high-dose-rate brachytherapy boosts could be good options for improving the biochemical disease-free survival in T3-T4 stages of localized prostate cancer.
Due to low value of radiobiological ratio α/β= 1 . 5 Gy for prostate cancer, the possible way to increase dose values in the high-risk tumors is associated with increase of the fractional dose up to 10 Gy per fraction during SBRT treatment. There were several clinical trials that studied SBRT efficiency in the case of high-risk prostate cancer.
Katz and Kang in Ref. [20] presented the data on 65 % rate of disease-free survival for a 8-year followup period (7-year disease-free survival amounted 68.2 %) for 35 Gy or 36.25 Gy delivered in 5 fractions ( EQD 2 =85 – 90 . 6 Gy). Kang et al. in Ref. [21] showed results of image-guided SBRT of high-risk prostate cancer with the doses equal to 32 – 36 Gy delivered in 4 fractions ( EQD 2 =87 – 108 Gy). The reported 5-year freedom from biochemical relapse rate amounted 90.9 %. Bernetich et al. reported on 86.7 % of 5-year freedom from biochemical relapse rate for the patients treated with 35 – 37.5 Gy delivered in 5 fractions ( EQD 2 =85 – 96 . 4 Gy) [22].
Royce et al. analyzed the prostate cancer SBRT trials and modeled a dose-response tumor control probability for the endpoint of freedom from biochemical relapse [5]. In the case of high-risk cancer, authors analyzed five- year freedom from biochemical relapse
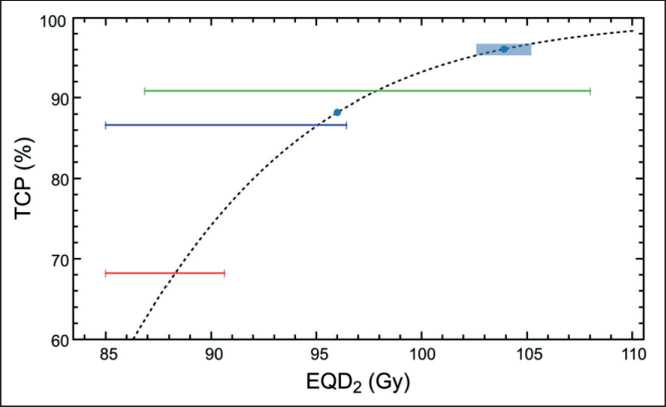
Fig. 2. Comparison of Royce TCP model (black dashed curve) with clinical trials by Katz and Kang (redline) [20], Kang (green line) [21] and Bernetich (blue curve) [22]. Blue point shows expected TCP for the prescribed dose value EQD 2=96 Gy. Blue point with rectangular shows the expected TCP value and uncertainty region for the simulated SIB irradiation taking into account EUD= 103 . 9 ± 1 . 3 Gy
Рис. 2. Сравнение модели TCP Ройса (черная пунктирная кривая) с клиническими исследованиями Каца и Канга (красная линия) [20], Канга (зеленая линия) [21] и Бернети-ча (синяя кривая) [22]. Синяя точка показывает ожидаемый TCP для предписанного значения дозы EQD2=96 Гр. Синяя точка с прямоугольником показывает ожидаемое значение PTV и область неопределенности для смоделированного облучения SIB с учетом EUD=103,9 ± 1,3 Гр of 85 patients reported in 3 previously mentioned studies [5]. Royce used Poisson TCP model:

where the following parameters were found by the approximation of trials data: γ= 4 . 50 (CI 2.82 – 6.53) and D 50 =84 . 2 (CI 81.4–86.8) [5]. Fig. 2 shows Poisson TCP model with Royce parameters that is compared with results of clinical trials. The expected efficiencies of the calculated SIB treatment plans are also shown both for the prescribed dose value and obtained EUD value.
Applying Eq. 3 to the prescribed SIB dose value ( EQD 2 =96 Gy), one can obtain TCP= 88 % that is rather high value. However, Royce in Ref. [5] pointed that ‘Prescription doses were used as model inputs because individual patient-level dose-volume histograms were unavailable; individual patient-level dose-volume histograms would strengthen future modeling efforts’ [5]. That is why we added calculated EUD value into
References Feasibility of simultaneous integrated boost for high-dose treatment of high-risk prostate cancer
- Heidenreich A., Bastian P.J., Bellmunt J., Bolla M., Joniau S., van der Kwast T., Mason M., Matveev V., Wiegel T., Zatton. F., Mottet N.; European Association of Urology. EAU guidelines on prostate cancer. Part 1: screening, diagnosis, and local treatment with curative intent-update 2013. Eur Urol. 2014; 65(1): 124-37. https://doi.org/10.1016/j.eururo.2013.09.046.
- Kaprin A.D., Starinskii V.V., Petrova G.V. Zlokachestvennye novoobrazovaniya v Rossii v 2019 godu (zabolevaemost' i smertnost'). M., 2020. 252 s.
- Brenner D.J., Hall E.J. Fractionation and protraction for radiotherapy of prostate carcinoma. Int J Radiat Oncol Biol Phys. 1999; 43(5): 1095-101. https://doi.org/10.1016/s0360-3016(98)00438-6.
- Fowler J., Chappell R., Ritter M. Is alpha/beta for prostate tumors really low? Int J Radiat Oncol Biol Phys. 2001; 50(4): 1021-31. https://doi.org/10.1016/s0360-3016(01)01607-8.
- Syed Y.A., Patel-Yadav A.K., Rivers C., Singh A.K. Stereotactic radiotherapy for prostate cancer: A review and future directions. World J Clin Oncol. 2017; 8(5): 389-97. https://doi.org/10.5306/wjco.v8.i5.389.
- Royce T., Mavro.d.s P., Wang K., Falchook A., Sheets N., Fuller D., Collins S., El Naqa I., Song D., Ding G., Nahum A., Jackson A., Grimm J., Yorke E., Chen R. Tumor control probability modeling and systematic review of the literature of stereotactic body radiation therapy for prostate cancer. Int J Radiat Oncol Biol Phys. 2021; 110(1): 227-36. https://doi.org/10.1016/j.ijrobp.2020.08.014.
- Sandler K.A., Cook R.R., Ciezki J.P., Ross A.E., Pomerantz M.M., Nguyen P.L., Shaikh T., Tran P.T., Stock R.G., Merrick G.S., Demanes D.J., Spratt D.E., Abu-Isa E.I., Wedde T.B., Lilleby W., Krauss D.J., Shaw G.K., Alam R., Reddy C.A., Song D.Y., Klein E.A., Stephenson A.J., Tosoian J.J., Hegde J.V., Yoo S.M., Fiano R., D'Amico A.V., Nickols N.G., Aronson W.J., Sadeghi A., Greco S.C., Deville C. Jr, McNutt T., DeWeese T.L., Reiter R.E., Said J.W., Steinberg M.L., Horwitz E.M., Kupelian P.A., King C.R., Kishan A.U. Prostate-only Versus Whole-pelvis Radiation with or Without a Brachytherapy Boost for Gleason Grade Group 5 Prostate Cancer: A Retrospective Analysis. Eur Urol. 2020; 77(1): 3-10. https://doi.org/10.1016/j.eururo.2019.03.022.
- Combifix [Internet]. [cited 2022 Sep 19]. URL: https://civcort.com/ro/hip-pelvic-positioning/bellyboards/combifix-HP2.htm.
- Geinitz H., Roach III M., Van As N. Radiotherapy in Prostate Cancer Innovative Techniques and Current Controversies. Springer-Verlag, Berlin Heidelberg. 2015. https://doi.org/10.1007/978-3-642-37099-1.
- Elekta Synergy [Internet]. [cited 2022 Sep 23]. URL: https://www.elekta.com/products/radiation-therapy/synergy.
- Niemierko A. Reporting and analyzing dose distributions: a concept of equivalent uniform dose. Med Phys. 1997; 24(1): 103-10. https://doi.org/10.1118/1.598063.
- Brenner D.J. Fractionation and late rectal toxicity. Int J Radiat Oncol Biol Phys. 2004; 60(4): 1013-5. https://doi.org/10.1016/j.ijrobp.2004.04.014.
- Oinam A.S., Singh L., Shukla A., Ghoshal S., Kapoor R., Sharma S.C. Dose volume histogram analysis and comparison of different radiobiological models using in-house developed software. J Med Phys. 2011; 36(4): 220-9. https://doi.org/10.4103/0971-6203.89971.
- Rana S., Cheng C., Zhao L., Park S., Larson G., Vargas C., Dunn M., Zheng Y. Dosimetric and radiobiological impact of intensity modulated proton therapy and RapidArc planning for high-risk prostate cancer with seminal vesicles. J Med Radiat Sci. 2017; 64(1): 18-24. https://doi.org/10.1002/jmrs.175.
- Sumida I., Yamaguchi H., Kizaki H., Aboshi K., Tsujii M., Yoshikawa N., Yamada Y., Suzuki O., Seo Y., Isohashi F., Yoshioka Y., Ogawa K. Novel Radiobiological Gamma Index for Evaluation of 3-Dimensional Predicted Dose Distribution. Int J Radiat Oncol Biol Phys. 2015; 92(4): 779-86. https://doi.org/10.1016/j.ijrobp.2015.02.041.
- Arcangeli G., Saracino B., Arcangeli S., Gomellini S., Petrongari M.G., Sanguineti G., Strigari L. Moderate Hypofractionation in High-Risk, Organ-Confined Prostate Cancer: Final Results of a Phase III Randomized Trial. J Clin Oncol. 2017; 35(17): 1891-7. https://doi.org/10.1200/JCO.2016.70.4189.
- Tamihardja J., Schortmann M., Lawrenz I., Weick S., Bratengeier K., Flentje M., Guckenberger M., Polat B. Moderately hypofractionated radiotherapy for localized prostate cancer: updated long-term outcome and toxicity analysis. Strahlenther Onkol. 2021; 197(2): 124-32. https://doi.org/10.1007/s00066-020-01678-w.
- Guckenberger M., Lawrenz I., Flentje M. Moderately hypofraction-ated radiotherapy for localized prostate cancer: long-term outcome using IMRT and volumetric IGRT. Strahlenther Onkol. 2014; 190(1): 48-53. https://doi.org/10.1007/s00066-013-0443-x.
- Yamazaki H., Suzuki G., Masui K., Aibe N., Shimizu D., Kimoto T., Yoshida K., Nakamura S., Okabe H. Radiotherapy for Clinically Localized T3b or T4 Very-High-Risk Prostate Cancer-Role of Dose Escalation Using High-Dose-Rate Brachytherapy Boost or High Dose Intensity Modulated Radiotherapy. Cancers (Basel). 2021; 13(8): 1856. https://doi.org/10.3390/cancers13081856.
- Katz A., Formenti S., Kang J. Predicting biochemical disease-free survival after prostate stereotactic body radiotherapy: Risk-stratification and patterns of failure. Frontiers in Oncology. 2016; 6: 168. https://doi.org/10.3389/fonc.2016.00168.
- Kang J.K., Cho C.K., Choi C.W., Yoo S., Kim M.S., Yang K., Yoo H., Kim J.H., Seo Y.S., Lee D.H., Jo M. Image-guided stereotactic body radiation therapy for localized prostate cancer. Tumori. 2011; 97(1): 43-8. https://doi.org/10.1177/030089161109700109.
- Bernetich M., Oliai C., Lanciano R., Hanlon A., Lamond J., Arrigo S., Yang J., Good M., Feng J., Brown R., Garber B., Mooreville M., Brady L.W. SBRT for the Primary Treatment of Localized Prostate Cancer: The Effect of Gleason Score, Dose and Heterogeneity of Intermediate Risk on Outcome Utilizing 2.2014 NCCN Risk Stratification Guidelines. Front Oncol. 2014; 4: 312. https://doi.org/10.3389/fonc.2014.00312.
