Feature Diminution by Using Particle Swarm Optimization for Envisaging the Heart Syndrome

Author: Durairaj. M, Sivagowry. S
Journal: International Journal of Information Technology and Computer Science(IJITCS) @ijitcs
Article in issue: 2 Vol. 7, 2015.
Free access
Health Ecosystem is derisory in techniques to haul out the information from the database because of the lack of effective scrutiny tool to discern concealed relationships and trends in them. By applying the data mining techniques, precious knowledge can be excerpted from the health care system. Extracted knowledge can be applied for the accurate diagnosis of disease and proper treatment. Heart disease is a group of condition affecting the structure and functions of the heart and has many root causes. Heart disease is the leading cause of death in all over the world in recent years. Researchers have developed many data mining techniques for diagnosing heart disease. This paper proposes a technique of preprocessing the data set and using Particle Swarm Optimization (PCO) algorithm for Feature Reduction. After applying the PCO, the accuracy for prediction is tested. It is observed from the experiments, a potential result of 83% accuracy in the prediction. The performance of PCO algorithm is then compared with Ant Colony Optimization (ACO) algorithm. The experimental results show that the accuracy obtained from PCO is better than ACO. The performance measures are based on Accuracy, Sensitivity and Specificity. The other measures such as Kappa statistic, Mean Absolute Error, Root Mean Squared Error, True Positive Rate are also taken for evaluation. As future direction of this paper, a hybrid technique which combines PCO with Rough Set theory is suggested.
Medical Data Mining, Sensitivity, Specificity, Accuracy, Particle Swarm Optimization, Ant Search Algorithm
Short address: https://sciup.org/15012231
IDR: 15012231
Text of the scientific article Feature Diminution by Using Particle Swarm Optimization for Envisaging the Heart Syndrome
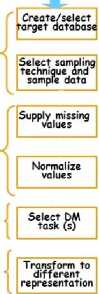
Data Mining is a computational progression to ascertain patterns in hefty data sets. It is the investigation of hefty datasets to extract concealed and previously mysterious patterns, relationships and knowledge that are difficult to perceive with traditional statistics [1]. Data mining techniques are the result of a long process of research and product development [2]. The overall goal of the Data Mining process is to extort information from the data set and transform it into a comprehensible format for further use. Knowledge discovery in database process is defined by the following stages namely Selection, Preprocessing, Transformation, Data Mining and Interpretational Evaluation. Knowledge Discovery is a process of getting high level knowledge from low level
data [3]. The Fig 1 shows the various steps involved in knowledge extraction from the data. The Data Mining is the crux process in the extraction of knowledge. The Fig 2 explains the mere 5 steps involved in KDD.

a step in the KDD proces consisting of methods that produce useful patterns or models from the data, under some acceptable computational efficiency limitations

Putting the results in practical use
Interpret and Evaluate discovered knowledge


О
Data Mining
Extract Patterns/Models
Understand the domain and Define problems
Collect and
Preprocess Data

Fig. 1. Data Mining- the core of Knowledge discovery process
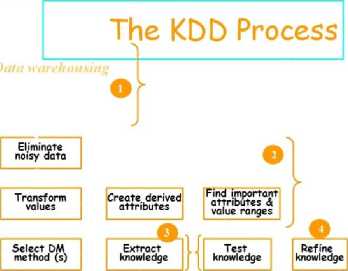

Fig. 2. The explanation of the KDD Steps
Medical Data Mining is a purview of challenge which involves a lot of imprecision and uncertainty. Stipulation of eminence services at affordable cost is the major confront faced in the health care organization. The poor clinical decision may lead to disastrous consequences. Clinical decisions are often made based on the doctor’s experience rather than on the knowledge rich data hidden
in the database. This in some cases results in errors and excessive medical cost which affects the quality of service to the patients [4]. Medical history data comprise of a number of tests essentials to diagnose a particular disease. It is possible to gain the advantage of Data mining [5], [6], [7] in health care by employing it as an intelligent indicative tool [8]. Accuracy of the prediction can also be improved by using Data Clustering Algorithms [9]. The researchers in the medical field have succeeded in identifying and predicting the disease with the aid of Data mining techniques [10]. Association rules of Data Mining have been significantly used in health data prediction [11], [12], [13]. The eventual goal of knowledge discovery is to identify factors which tend to improve the quality and effectiveness of health care.
The rise of health care cost is one of the world’s most important problems [5]. The medical term for Heart Disease/Heart Attack is Myocardial Infarction (MI) or Acute Myocardial Infarction (AMI). Heart attack transpires when there is indiscretion in the flow of blood and heart muscle is injured because of inadequate oxygen supply [14]. Risk factors for Myocardial Infarction include smoking, high blood pressure, cholesterol, Diabetes, Family history, etc.,. The most common symptom is severe chest pain and so called as Angina. Cardio Vascular Disease (CVD) clinical guidelines spotlight on the management of single risk factors [15]. In majority of cases, it doesn’t work since risk factors crop up in clusters, that is, the presence of single risk factor which indicates the presence of other risk factors too. It is apparent that the presence of multiple risk factors increases the sternness of CVD.
World Health Organization in the year 2008 reported that 30% of total global deaths are due to Cardio Vascular Disease (CVD). It is analyzed that CVD patients will increase from 300 million to 600 million by 2020 [16]. By 2030, almost 25 million people will die from CVDs, mainly from heart disease and stroke [17], [18]. These are projected to remain the CVD is the single leading cause of death. The CVD is also expected to be the leading cause of deaths in developing countries due to changes in lifestyle, work culture and food habits. Hence, more careful and efficient methods of diagnosing cardiac diseases and periodic examination are of high importance [19], [20].
The paper is organized as follows: Section II gives the magnitude about Feature Selection. Section III gives detail information about the Particle Swarm Optimization. Section IV describes about the data set collected for experimentation. Section V evaluates the set up used for Feature Reduction and Section VI discusses the results. Section VII concludes the paper.
-
II. Feature Selection
The Classification accuracy rate is influenced by the factor called Feature Selection. It is a process of eliminating features with little or no information. If there is a large number of feature, the dimension of the space will be large and non-clean, which will degrade the classification accuracy rate [21]. In machine learning and statistic, the feature selection is considered as a problem of global combinatorial optimization [22]. Feature Selection techniques has three main advantages when constructing predictive models. The main benefits of the feature selection are that it improves the model interoperability, abridge the training time and over fitting which is for enhancing the generalization.
A good feature selection mechanism is needed to increase the processing rate with predictive exactitude and avoid incomprehensibility [23]. Feature selection is needed to reduce the problem size and resultant search space for learning algorithm. In general, two important goals of Feature Selection are to minimize the classification error and number of attributes [24]. There are number of Feature Selection algorithms available for Data Mining. The complicated task is to find the opposite algorithm which would select the feature relevant to the task without affecting the quality of the result. The Swarm Intelligent techniques are mostly used for Feature reduction. But PSO is found to be effectual since it computes the individual best of each particle and finally compares all the individual particles to get the global best. It is also palpable that the Redunt feature obtained by PSO would not affect the accuracy.
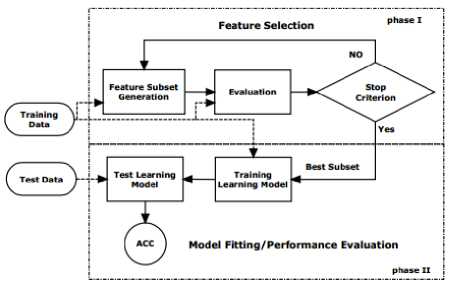
Fig. 3. Unified view of Feature Selection
The Fig 3 explains the unified view of Feature Selection process. Feature selection and Model Fitting/Performance Evaluation are the two phases of feature selection process. Feature selection process involves three steps. The first step is using research strategies to generate a candidate set which contains a subset of original features. The next step is evaluation of the candidate set and estimating the utility of features in the candidate set. Some features in the candidate set may be discarded or added to the selected feature set according to their relevance [25]. And the final step is determining whether the current sets of selected features are good enough. The feature set selected can be used to filter the training and test the data for model fitting and prediction.
-
III. Particle Swarm Optimization
Particle Swarm Optimization (PSO) is an accepted and semi-robotic algorithm. It is based on the social behavior associated with bird’s flocking for optimization problem.
A social behavior pattern of organisms that live and interact within large groups is the inspiration for PSO. The PSO is easier to put into operation than Genetic Algorithm. It is for the reason that PSO doesn’t have mutation or crossover operators and movement of particles is effected by using velocity function [26]. In PSO, each particle adjusts its own flying memory and its companion’s flying experience in order to flying in the search space with velocity. The precise functioning of PSO is as depicted in Fig 4.
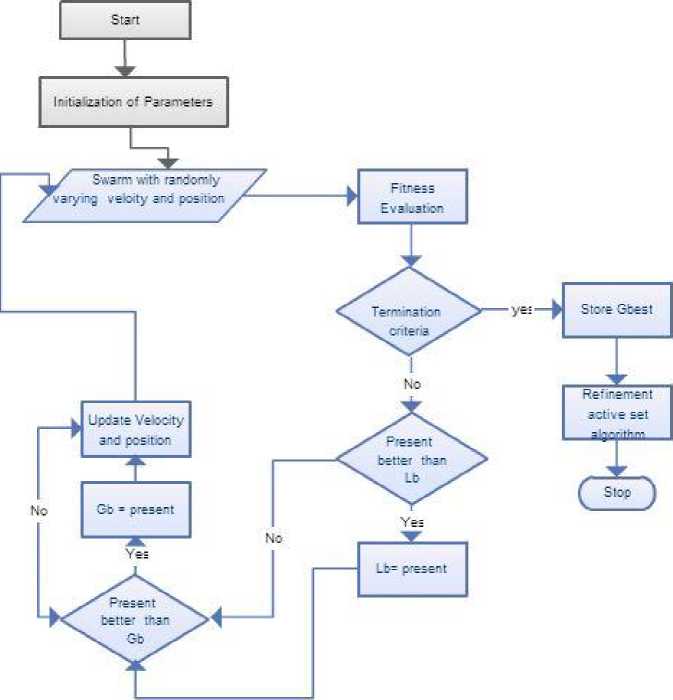
Fig. 4. Functioning of PSO
In the basic PSO, Particle Swarm consists of ‘n’ particles. The position of each particle stands for potential solution in D-dimensional space. Individuals, potential solutions, flow through hyper dimensional search space. The experience or acquired knowledge about its neighbors influences the changes in a particle within the swarm. The PSO algorithm involves of just three steps, which are being replicated until stopping condition, they are as follows.
-
(i) Evaluate the fitness of each particle.
-
(ii) Update individual and global best functions. (iii)Update velocity and position of each particle.
The position of each particle is influenced by the best-fit particle of the entire swarm [27]. Each individual particle i € [1… n] where n > 1, has current position in search space x i , a current velocity v i and a personal best position P best,i where i is the smallest value determined by objective function f. By using the P best,i , the global best position G best is calculated, which is the buck value obtained by comparing all the P best, i .
The Pbest,i is calculated by using the formula pbest,i
P best,i fff ( Хд > P best,i { X i iff ( Х ) < P best,i
The formula used to calculate Global Best Position G best is
G best = {min^ }, where i g [1, ......., n]
where n > 1
Velocity can be updated by using the formula
V t + 1 = wv i ( t ) + cxr 1 [ x . ( t ) - x . ( t )] + c 2 r 2 [ g ( t ) - X ( t )]
where vi(t) is the velocity, w, c1 and c2 are user supplied co-efficient. The r1 and r2 are random values xi(t) is the individual best solution, g(t) is the swarm’s global best candidate solution. ) is known as inertia component. The inertia component is responsible for keeping the particle moving in same direction, it was originally heading. Inertia component value lies between 0.8 to 1.2. Lower the values of inertia component, it speeds up the convergence of swarm to optima. But higher value encourages the exploration of entire search space. c1r1 [(xi(t)-xi(t)] is known as cognitive component. It pretense as a particle’s memory and it verge to return to the region of search space, where it experiences high individual factors. c2r2 [(g(t)-xi(t)] is known as social component, which causes the particle to move to the best region the swarm has found so far.
The pseudo code of the Particle Swarm Optimization Algorithm is as given below.
Algorithm PSO
Input:
-
m : the swarm size; c 1 , c 2 : positive acceleration constants; w: inertia weight
MaxV: maximum velocity of particles MaxGen: maximum generation MaxFit: maximum fitness value
Output:
P gbest : Global best position
Begin
Swarms { x id, v id } =Generate (m); /*Initialize a population of particles with random positions and velocities on S dimensions */
Pbest(i)=0; i = 1,….,m,d=1,…..,S
Gbest = 0; Iter = 0;
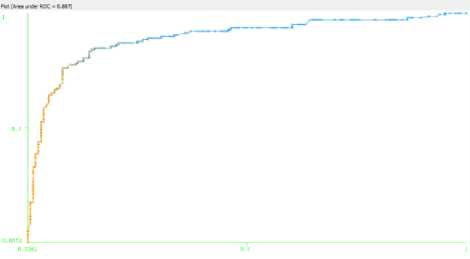
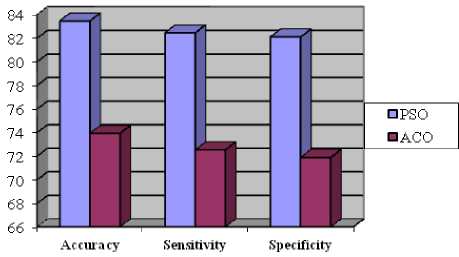
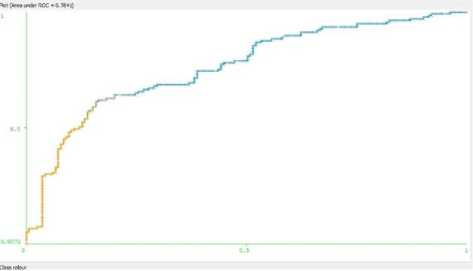
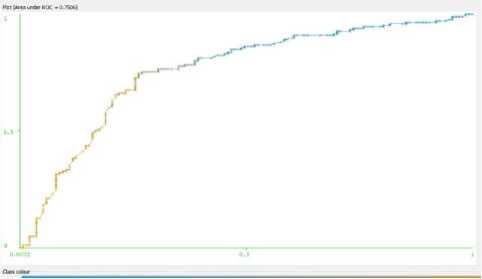
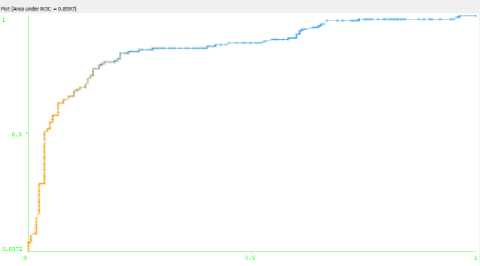
While (Iter {For (every particle i) {Fitness(i)=Evaluate(i); IF(Fitness(i)>Pbest(i)) {Pbest(i)=Fitness(i);pid=xid; d=1,…..,S} IF(Fitness(i)>Gbest(i)) {Gbest(i)=Fitness(i);gbest=i; } For (every particle i) {For(every d){ vid = w*vid + c1*rand()*(pid-xid)+c2*Rand()*(pgd-xid) IF (vid > MaxV) { vid = MaxV;} IF (vid <- MaxV) { vid =- MaxV;} xid = xid+ vid } } Iter=Iter+1; }/* rand() and Rand() are two random functions in the range [0,1]*/ Return P_{gbest} End III. Related Work Genetic Algorithm [28], [29] was used to determine the attributes for the diagnosis of heart disease. Feature extraction was done with the aid of Genetic Algorithm (GA). The number of attributes used to predict was reduced to 6 by using GA. Subhagata Chattopadhyay [30] has mined some important pre-disposing factors of heart attack. 300 real world cases were taken for study. 12 factors were taken. Divisive Hierarchical Clustering (DHC) techniques was used to cluster the sample as ‘single’ , ‘average’ and ‘complete’ linkage. It was observed from their results that male with age group of 23-60 are prone to suffer severe and moderate heart attack, where women over 50 years are affected mostly with mild attacks. A modified Multi Swarm PSO [31] was studied to crack discrete problems with number of sub swarm and a multi swarm scheduler that can scrutinize and control each sub swarm using the rule. For Feature Selection, Improved Feature Selection (IFS) was incorporated with Multi Swarm PSO and Support Vector Machine was integrated with F-Score. Recital of the anticipated method was compared with Standard PSO, Genetic Algorithm and Grid search. The proposed method performs drastically in terms of classification accuracy rate. Xiangyang Wang [31] proposed a feature selection strategy based on rough sets and PSO. PSORSFS algorithm and other feature selection algorithm were implemented using Matlab. PSO was found to obtain optimal solution so quickly. It was observed that inertia weight and maximum velocity have an imperative brunt in the performance of PSO. PSO was combined with K-Nearest Neighbor (PSOK-NN) classifier [32] to determine Coronary artery disease by using exercise stress testing data. It was composed of two steps. At the first step, a particle was generated which demonstrates the whole sample optimally in training data for both health and unhealthy patients. Then the class of test sample was determined by using the distance of the test sample generated by utilizing K-Nearest Neighbor algorithm. The accuracy obtained while using PSOK-NN was 92.49%. Benxian Yue and et. al., [33] depict that PSO can be used as a solution to find the appropriate features by using Rough Set Theory. The proposed method observed the change of positive region as the particles proceed through the search space. The performance of the algorithm is evaluated with Genetic Algorithm. The fitness of each individual is evaluated during search procedure. When compared with Genetic Algorithm, it is perceived that PSO requires shorter time to obtain better results. In [34], a hybrid filter-wrapper feature subset selection algorithm is presented which is based on PSO. Maximum relevance minimum redundancy PSO (mr2PSO) uses the mutual information available from the filter model to weigh the bit selection probabilities in discrete PSO. This method integrated mutual information filter model within the PSO based wrapper model. Mutual dependence of two variables is measured by the quantity called mutual information. The mutual information is expressed as a composite measure of feature relevance and redundancy. The probability of the features is weighed by using feature relevance and redundancy, which enhances the convergence rate and solution quality of feature subset selection. A stratified 10-fold cross validation is recommended. In [35], it is recommended that hill climbing rough set approach is inadequate to find optimum solution. It is not feasible for complete search even in medium-sized data set. The PSO interacts with individuals in the population to find the optimal region in complex search space. The main pro of PSO over GA is that it doesn’t require cross over or mutation operation and also inexpensive in terms of both memory and run time. Experimental results show that PSO is efficient for rough set based feature selection. In [36], a computer aided diagnosis system has been introduced for the heart valve disease by using binary PSO and Support Vector Machine (SVM) algorithm in conjunction with K-nearest neighbor and leave-one-out cross validation. The most weighted feature is selected by using binary PSO algorithm. SVM is used to classify the outcome into two classes as healthy and having heart valve disease. The proposed method helps to optimize the feature selection process. It can also be used an ideal preprocessing tool since it increase the classification accuracy. A Neuro-Fuzzy System [37] was designed with eight input fields and one output field to predict the heart disease. It detects the risk level of the output classified into four classes. The system was designed in such a way that the patient can refer it for personal use too. IV. Datasets The Data set used for experimentation is taken from Data mining repository of the University of California, Irvine (UCI). Data set from Cleveland Data set, Hungary Data set, Switzerland Data set, Long beach and Statlog Data set are collected. Cleveland, Hungary, Switzerland and Va long beach data set contains 76 attributes. Among all the 76 attributes, 14 attributes are taken for experimentation, since all the published experiments refer to using only this subset of 14. Researchers in the medical domain most commonly use Cleveland data set and Statlog data set for testing purpose. This is because all the other data set has more number of missing values than Cleveland data set [5]. Table 1. Attributes Information No. Name Description 1 Age Age in Years 2 Sex 1=male, 0=female 3 Cp Chest pain type(1 = typical angina, 2 =atypical angina, 3 = non-anginal pain, 4 = asymptomatic) 4 Trestbps Resting blood sugar(in mm Hg on admission to hospital) 5 Chol Serum cholesterol in mg/dl 6 Fbs Fasting blood sugar>120 mg/dl(1= true, 0=false) 7 Restecg Resting electrocardiographic results(0 = normal, 1 = having ST-T wave abnormality, 2 = left ventricularhypertrophy) 8 Thalach Maximum heart rate 9 Exang Exercise induced angina 10 Oldpeak ST depression induced by exercise relative to rest 11 Slope Slope of the peak exercise ST segment (1=upsloping, 2=flat, 3= downsloping) 12 Ca Number of major vessels colored by fluoroscopy 13 Thal 3= normal, 6=fixed defect, 7= reversible defect 14 Num Class(0=healthy, 1=have heart disease) A. Attribute types: >Real: 1,4,5,8,10,12 >Ordered:11 > Binary: 2,6,9 > Nominal: 7,3 The data set gathered for mining will contain either numeric attributes or nominal attributes. The data set collected for Heart disease encompasses both the numeric and nominal attributes. From the 14 attributes, the listed features such as age, trestbps, Chol, thalach and oldpeak are numeric attributes and the remaining 9 comes under nominal. V. Evaluation Setup Data Preprocessing [38] plays a trivial role in Data Mining. The training phase in the Data Mining during Knowledge Discovery will be very complicated if the data contains irrelevant or redundant information or more noisy and unreliable data. The medical data contain many missing values. So preprocess is an obligatory step before training the medical data. The data set is preprocessed to remove the missing values and noisy data. After preprocessing, a total of 303 instances with 13 attributes are trained before applying Feature Reduction algorithm. The performance of all algorithms is calculated by computing its Sensitivity, Specificity and Accuracy. It can be calculated as follows Accuracy =----(TP + FN)*100 (TN+TP + FN + FP) TP Sensitivity = TP + FN TN Specificity =*100 TN + FN Sensitivity is used to correctly classify the individual as diseased and Specificity is to classify the individual as disease free. The True Positive Rate (TPR) and False Positive Rate are also calculated. If the Kappa Statistic value is 0.7 or greater than 0.7, then it is said to good statistic correlation. The correlation is found to be better in the case of high Kappa value. True Positive Rate = True Positive (True Positive + False Negative) Best subset found is 3 9 11 12 13 with merit: 0.28004022964034225 Attribute Subset Evaluator (supervised, Class (nominal): 14 num): CFS Subset Evaluator Including locally predictive attributes Selected attributes: 3,9,11,12,13 : 5 op exang slope thal Fig. 5. Reduced attributes after applying PSO algorithm False Positive Rate = False Positive (False Positive + True Negative) TruePositive Pr ecision =----------------------------- (TruePositive+FalsePosit ive) The data set is classified by using Radial Basis Function and Multilayer Perceptron Network. The table below summarizes the result obtained before applying the Feature Reduction techniques. The data set is subject to 10 fold cross validation. The cross validation technique is used to estimate the performance of a predictive model. In the 10 fold cross validation; the data sets are divided into 10 sets. Among the 10 data sets, 9 data sets are used for training and 1 is used for testing. The mean accuracy of the result obtained is as tabulated in Table 2. Table 3. Results obtained after reducing attributes by using PSO RBF MLP Correctly classified instance (%) 83.49 81.84 Kappa statistic 0.66 0.63 Mean Absolute Error 0.23 0.22 Relative Mean Squared Error 0.35 0.38 Relative Absolute Error (%) 47.06 44.76 Root Relative Squared Error (%) 70.68 77.60 True Positive Rate 0.83 0.81 False Positive Rate 0.17 0.18 Precision 0.83 0.81 Recall 0.83 0.81 F-Measure 0.83 0.81 ROC Area 0.83 0.81 Table 2. Mean accuracy of the results obtained RBF MLP Correctly classified instance (%) 93.39 97.03 Kappa statistic 0.89 0.94 Mean Absolute Error 0.09 0.15 Relative Mean Squared Error 0.22 0.28 Relative Absolute Error (%) 20.13 31.23 Root Relative Squared Error (%) 45.26 57.05 True Positive Rate 0.93 0.89 False Positive Rate 0.06 0.11 Precision 0.93 0.89 Recall 0.93 0.89 F-Measure 0.93 0.89 ROC Area 0.97 0.94 The attribute number is abridged when the Feature reduction techniques are applied. Particle Swarm Optimization, Genetic Search and Ant Search are the Feature reduction techniques taken for experiments. The below Fig 5 shows the condensed number of attributes when PSO is applied. It is apparent that the attribute number is reduced from 13 to 5. CfsSubsetEval is used along with PSO and ACO which evaluates the worth of a subset of attributes by considering the individual predictive ability of each feature along with the degree of redundancy between them. A total of 14 attributes is given for evaluation by using the PSO algorithm. The attribute number is reduced to five after applying the algorithm is cp, exang, slope, ca and thal with the merit of 0.280. The result obtained after reducing the number of attributes by using PSO is as tabulated in Table 3. Apart from PSO, Ant Search algorithm is also applied to the data set to ascertain the results of proposed work. When Ant Search Algorithm is applied, the attribute numbers are reduced to 3. It can be visualized in the Fig 6 given below. The reduced attributes are chol, exang and thal with merit of 0.232. Best subset found is 5 9 13 with merit: 0.23167836871429853 Attribute Subset Evaluator (supervised, Class (nominal): 14 num): CFS Subset Evaluator Including locally predictive attributes Selected attributes: 5,9,13 : 3 exang thal Fig. 6. The Reduced number of attributes after applying ACO algorithm The results of training obtained after applying the Ant Search algorithm on the reduced data set is as tabulated in Table 4. Table 4. Results obtained after reducing the attributes by using ACO. RBF MLP Correctly classified instance (%) 72.27 73.92 Kappa statistic 0.44 0.46 Mean Absolute Error 0.32 0.28 Relative Mean Squared Error 0.46 0.49 Relative Absolute Error (%) 66.08 56.71 Root Relative Squared Error (%) 92.48 100.13 True Positive Rate 0.72 0.73 False Positive Rate 0.28 0.28 Precision 0.72 0.73 F-Measure 0.72 0.73 ROC Area 0.72 0.73 VI. Results and Discussion It is observed that the application of Feature reduction algorithm on data set resulted in reduced number of attributes. The Fig 7 depicts the number of attributes reduced when applying the algorithms. It is scrutinized that the attribute number is reduced to a minimum number as 5 and 3 after the Particle Swarm Optimization and Ant Colony Optimization algorithm is utilized. The performance of the algorithm employed for building the model is recognized by calculating its sensitivity, specificity and accuracy. The increase in the sensitivity, accuracy and specificity proves that the algorithm has performed very well for the purpose which it is retained. From the Fig 8, it is observed that the PSO algorithm outperforms ACO in every case of Sensitivity, Specificity and Accuracy. ACO outstand PSO in reducing the number of attributes. But when calculating the accuracy it is observed that the data set reduced by using PSO gives more accuracy than ACO. The main intention of feature reduction is that the number of feature should be abridged without distressing the prediction accuracy. The PSO algorithm is more fit for the purpose of feature reduction since it doesn’t affect the accuracy. Fig. 10. The ROC Curve for RBF network by using PSO Algorithm Fig. 8. Performance Evaluation of Algorithms based on Sensitivity, Specificity and Accuracy Fig. 11. The ROC Curve for MLP network by using ACO Algorithm Fig. 12. The ROC Curve for RBF network by using ACO Algorithm Fig. 9. The ROC Curve for MLP network by using PSO Algorithm VII. Conclusion Predicting heart disease by applying Data Mining techniques is the most exigent chore. Before applying the PSO, it is found that the prediction accuracy is around 93 to 97%, depending on the type of Neural Network taken for classification. Tumbling the number of attributes will lessen the training time. Reducing the number of attributes without affecting the accuracy is the problem taken to study. Particle Swarm Optimization algorithm is taken to study. Removing and correcting all the boisterous data and extracting information from the medical data would help medical practitioners in many ways. The Swarm Intelligence algorithm like PSO and ACO are compared with each other. It is noticed that PSO gives an accuracy of 83% which is better than the ACO. To improve more accuracy in prediction, hybridizing PSO with Rough Set theory may yield better result, which is the future direction of this work.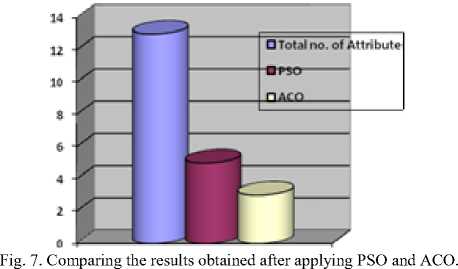
References Feature Diminution by Using Particle Swarm Optimization for Envisaging the Heart Syndrome
- Jabbar M.A., “Knowledge discovery from mining association rules for Heart disease Prediction”, JATIT, Vol 41(2), pp 166-174, 2012.
- Bhagyashree Ambulkar and Vaishali Borkar “Data Mining in Cloud Computing”, MPGINMC, Recent Trends in Computing, ISSN 0975-8887, pp 23-26,2012.
- Setiawan N.A, “ Rule Selection for Coronary Artery Disease Diagnosis Based on Rough Set” ,International Journal of Recent Trends in Engineering, Vol 2(5), pp 198-202, Dec 2009
- Raghu. D.Dr, “Probability Based Heart Disease Prediction using Data Mining Techniques”, IJCST, Vol 2(4), pp 66-68, Dec 2011
- K.Rajeswari, “Prediction of Risk Score for Heart Disease in India using Machine Intelligence”,IPCSIT, Vol 4, 2011
- Latha Parthiban and R.Subramanian, “Intelligent Heart Disease Prediction System using CANFIS and Genetic Algorithm”, International Journal of Biological and Life Sciences, Vol 3(3), pp157-160,2007.
- Liangxiao. J, Harry.Z, Zhihua.C and Jiang.S “One Dependency Augmented Naïve Bayes”, ADMA, pp 186-194, 2005.
- Huan Liu and Hiroshi Motoda, Rudy Setiono and Zheng Zhao. “Feature Selection: An Everlasting Frontier in Data Mining”, JMLR: The 4th Workshop on Feature Selection and Data Mining, 2010.
- Bala Sundar V, “Development of Data Clustering Algorithm for predicting Heart”, IJCA, Vol 48(7), pp 8-13, June 2012.
- Rafiah Awang and Palaniappan. S “Web based Heart Disease Decision Support System using Data Mining Classification Modeling techniques” , Proceedings of iiWAS, pp 177-187, 2007
- Carlos Ordonez, Edward Omincenski and Levien de Braal “Mining Constraint Association Rules to Predict Heart Disease”, Proceeding of 2001, IEEE International Conference of Data Mining, IEEE Computer Society, ISBN-0-7695-1119-8, 2001, pp: 433-440
- Deepika. N, “Association Rule for Classification of Heart Attack patients”, IJAEST, Vol 11(2), pp 253-257, 2011.
- Durairaj.M, and Meena.K” A Hybrid Prediction System using Rough Sets and Artificial Neural Network”, International Journal of Innovative Technology and Creative Engineering, Vol 1(7), July 2011.
- Srinivas, Kavitha Rani and Dr. Govarthan, “Application of Data Mining Techniques in Health Care and Prediction of Heart Attack”, IJCSE, Vol 2(2), pp 250-255, 2010.
- Volpe.M, LRW Erhardt and Williams.B, “Managing Cardiovascular risk: A need for change”, Journal of Human Hypertension, 2008, pp 1554-1557.
- World Health Organization. Strategic priorities of the WHO Cardiovascular Disease programme. Available online at URL: http://www.who.int/whr/200. Last accessed February 2006.
- Chen A.H., “HDPS: Heart Disease Prediction System”, Computing in Cardiology, ISSN 0276-6574, pp 557-560, 2011.
- en.wikipedia.org/wiki/myocardial_infarction
- Nidhi Bhatia and Kiran Jyothi, “A Novel Approach for heart disease diagnosis using Data Mining and Fuzzy logic”, IJCA, Vol 54(17), pp 16-21, September 2012.
- Rafiah Awang and Palaniappan. S “Intelligent Heart Disease Prediction System Using Data Mining techniques”, IJCSNS, Vol 8(8), pp 343-350, Aug 2008.
- Latha Parthiban and R.Subramanian, “Intelligent Heart Disease Prediction System using CANFIS and Genetic Algorithm”, International Journal of Biological and Life Sciences, Vol 3(3), pp157-160, 2007.
- Elbedwehy M.N, “Detection of Heart Disease using Binary Particle Swarm Optimization”, Proceeding of the Federated Conference in Computer Science and Information System, 2012, pp 177-182.
- Nidhi Bhatia and Kiran Jyothi, “A Novel Approach for heart disease diagnosis using Data Mining and Fuzzy logic”, IJCA, Vol 54(17), pp 16-21, September 2012.
- Bing Xue,” Multi Objective Particle Swarm Optimization for Feature Selection”, GECCO ’12, 2012.
- Huan Liu and Hiroshi Motoda, Rudy Setiono and Zheng Zhao. “Feature Selection: An Everlasting Frontier in Data Mining”, JMLR: The 4th Workshop on Feature Selection and Data Mining, 2010.
- Alper unler, Alper Murat and Ratna Babu Chinnam, “m2PSO: A maximum relevance minimum redundancy feature selection method based on Swarm Intellignce for SVM Classification”, Elsevier, 2011, pp 4625-4641.
- Xiangyang Wang, Jie Yang, Xialong Tens and Weijan Xia, Richard Jension, “ Feature selection basedon Rough Set and Particle Swarm Optimization”, Pattern Recognition Letters, 2007, pp: 459-471.
- Anbarasi.M, Anupriya and Iyengar “Enhanced Prediction of Heart Disease with Feature Subset Selection using Genetic Algorithm”, International Journal of Engineering and Technology, Vol 2(10), 2010, pp 5370-5376.
- Robert D., Matthias P., Williams S., Andras J. ,UCI repository of Machine Learning Databases,University of Califonia. Available online at: www.archive.ics.uci.edu/ml/datasets/Heart+disease. Last accessed in July 2014.
- Subhagata Chatropadhyay, “Mining the risk of heart attack : A comprehensive study”, International Journal of BioMedical Engineering and Technology, Vol 1(4), 2013.
- Yuanning Liu, Gang Wang, Huiling Chen, Hao Dong, Xiaodong Zhu andSujing Wang “ An improved Particle Swarm Optimization for Feature Selection”, Journal of Bionic Engineering, Vol 8(2), 2011.
- Ismail Babaoglu, Oguz Findik, Erkan Ulker and Nazef Aygul, “ A Novel Hybrid Classification Method with PSO and K-nn algorithm for diagnosis of Coronary artery disease using exercise stress test data”, International journal of Innovative Computing, Volume 8(5), May 2012.
- Benxian Yue, Weihong Yao, Ajith Abraham and Hongbo Liu, “ A New Rough Set Reduct Algorithm based on Particle Swarm Optimization”, IWINAC ’07, LNCS 4527, pp 397-409, © Springer Verlog, 2007.
- Alper unler, Alper Murat and Ratna Babu Chinnam, “ m2PSO: A maximum relevance minimum redundancy feature selection method based on Swarm Intellignce for SVM Classification”, Elsevier, 2011, pp 4625-4641.
- Xiangyang Wang, “Feature Selection based on Rough Sets and Particle Swarm Optimization”, Elsevier, Volume 4(1), March 2007.
- Mona Nagy Elbedwedhy, Hossam M.Zawbaa, Naveen Ghali and About Ella Hassanien, “ Detection of Heart Disease using Binary Particle Swarm Optimization “, Proceedings of Federated Conference on Computer Science and Information System, pp 177-182, © IEEE, 2012.
- Obanijesu Opeyemi,Emuoyibofarhe O. Justice,"Development of Neuro-fuzzy System for Early Prediction of Heart Attack", IJITCS, vol.4, no.9, pp.22-28, 2012.
- Sri Krishnan Wasan, Vasutha Bhatnagar and Harleen Kaur “The Impact of Data Mining techniques on medical diagnostics”, Data Science Journal, Vol 5(19), pp 119-126, October 2006.
