Feature Selection with Targeted Projection Pursuit

Author: Amir Enshaei, Joe Faith
Journal: International Journal of Information Technology and Computer Science(IJITCS) @ijitcs
Article in issue: 5 Vol. 7, 2015.
Free access
The selection of attributes becomes more important, but also more difficult, as the size and dimensionality of data sets grows, particularly in bioinformatics. Targeted Projection Pursuit is a dimension reduction technique previously applied to visualising high-dimensional data; here it is applied to the problem of feature selection. The technique avoids searching the powerset of possible feature combinations by using perceptron learning and attraction-repulsion algorithms to find projections that separate classes in the data. The technique is tested on a range of gene expression data sets. It is found that the classification generalisation performance of the features selected by TPP compares well with standard wrapper and filter approaches, the selection of features generalises more robustly than either, and its time efficiency scales to larger numbers of attributes better than standard searches.
Feature Selection, Projection Pursuit, Dimensionality Reduction, Biomarkers
Short address: https://sciup.org/15012282
IDR: 15012282
Text of the scientific article Feature Selection with Targeted Projection Pursuit
Published Online April 2015 in MECS
Feature selection (FS) is the problem of finding a subset of features or attributes in a data set for building robust data learning models by eliminating ‘noisy’ variables, simplifying data collection, or elucidating the significant features of the data[1][2]. Its importance has grown as the volume and complexity of data grows, and as the role of data mining in making use of that data has increased. In bioinformatics, for example, feature selection techniques are widely used to select genetic ‘markers’ for types of cancer, based on the differing expression levels of individual genes measured using DNA microarrays[3].
A wide range of FS techniques have been demonstrated, but tend to fall into three categories [1][4]:
Variable Ranking techniques are based on measuring how well each individual independent variable discriminates the classes in the data. Standard measures include the gain in information that the variable carries about the classification, the correlation of the variable with the classification variable or a chi-squared measure of the ratio between intra-class and inter-class variance for that variable. Although variable ranking techniques are simple and fast, one limitation is that they consider only the contribution of individual variables to classification, whereas in many real-world examples – such as the role of genes in cancer formation -- many variables act in combination.
In Wrapper techniques, combinations of features are tested for their ability to classify samples using a standard supervised classifier, and a search algorithm -such as hill climbing or genetic algorithm -- is used to find the combination of selected features that gives the best generalisation performance. Although wrapper techniques have the potential to find optimal subsets of features, this potential is rarely achieved in practice[5], partly due to the large size of the powersets of features to search: a typical microarray experiment, for example, will measure the expression level of tens of thousands of genes [6].
Filter techniques select subsets of variables independently of any predictor; for example the space of features may be reduced by removing those that are highly correlated with others, since this will reduce redundancy [7]. Filters are typically more efficient than wrappers, and so may be more suited than either wrappers or variable ranking techniques to problems in which there are a very large number of independent variables which interact to produce a classification. Many hybrid approaches have also been suggested, such as using filters to reduce the size of the space that a wrapper must search [8].
Here we propose a novel form of filter feature selection based on projection pursuit (PP). Friedman and Tukey introduced the term projection pursuit to describe the process of finding interesting linear projections of a data set by optimizing some function (the projection pursuit index) [9] – for example maximising the separation between classes in the data [10]. In the original context the projections were used to produce two dimensional views of a data set for visualisation purposes; but the intuition that we test here is that one effect of ‘squeezing’ high dimensional data into a lower dimensional space whilst maximising the separation between classes is to find how the variables in the original data can be combined to best classify samples.
The problem in PP in general is how find a projection that maximises the projection pursuit index; in this case the separation between classes. It seems that we are back with the problem faced by wrapper feature selection techniques of the size of the original data space being an obstacle to finding optimal solutions. Previous search algorithms employed in PP include simulated annealing [10], genetic algorithms [11][12], etc, but we have previously demonstrated a novel method, Targeted Projection Pursuit (TPP), for efficiently solving the projection pursuit problem using a perceptron learning algorithm[13], and demonstrated a visualisation tool that utilises it [14].
Here TPP is adapted to feature selection and tested against representative examples of wrapper, filter, and variable ranking techniques on a large collection of gene expression array data taken the bioinformatics literature. Its performance is found to be comparable to wrapper techniques and evidence is provided that its choice of selected features generalises more robustly, and that the algorithm scales to larger numbers of attributes more efficiently.
A. Previous Work
Projection Pursuit for feature selection has previously been applied to the problem of selecting spectral bands from remote sensing systems that collect image data in possibly hundreds of bands [15],[16]. However in this case the projection pursuit algorithm employed relied on the ordering of dimensions (ie spectral bands) to reduce the size of the search space, by dividing the dimensions into subsets of adjacent bands, such that a simple gradient descent search algorithm could be employed.
-
II. Targeted Projection Pursuit
Conventional projection pursuit searches the space of all possible projections to find that which maximises an index that measures the quality of each resulting view. In the case considered here, a suitable index would measure the degree of clustering within, and separation between, classes of points. Targeted projection pursuit, on the other hand, proceeds by hypothesising an ideal view of the data, and then finding a projection that best approximates that view.
Suppose
X
is a
n
x
p
matrix that describes
n
samples of
p
dimensions, and
T
is a
n
x
m
matrix that describes a
m
-dimensional target view of those samples where
m<
min‖т-X․р‖ (1)
In the degenerate case, where the view is onedimensional and the classification is binary, then this is a form of probit regression problem[17], since the points in each class would naturally be mapped to the points (0) and (1) respectively. But if there are many more classes then if the dimensionality of the output space is too low then there may not be a projection (and resulting view) that adequately separates classes. If the dimensionality is too high, approaching the number of input attributes, p , then the problem becomes an attribute ranking problem:
the coefficient of each features would reflect its ability to separate classes individually rather than in combination with others.
By forcing the points into a lower-dimensional space while trying to maintain separation between classes, TPP must find combinations of features that work in combination. If the dimensionality is too low there may not be a separated solution. If the dimensionality is too high then that separated solution may not survive when the number of features are reduced.
Thus, given the dimensionality of the output space, our algorithm must find both an optimal target view, T, and projection P , are unknown. Here we describe an iterative algorithm for finding both:
-
1. Start with an initial random projection and find the resulting initial view,
-
2. Find a new target view based on the current view, by using a attraction-repulsion algorithm to better separate points into classes,
-
3. Use a perceptron learning algorithm to find a new projection that minimises eqn 1
-
4. Repeat steps 2 to 4 until the projection (and resulting view) converges.
-
5. Select the features with the largest components in the resulting projection.
Suppose the data X is comprised of samples partitioned into к classes, such that , is the row of X made up of the jth sample of the Ith class. Given a initial projection, ро , and initial view, V0 = , a target, т1 , is then derived from the current view, V0 , by using a simple repulsion-attraction model: the centroid of each class of points within the view is moved away from every other with a velocity inversely proportional to their separation, and each point is moved towards the centroid of its class. If the centroid of each class within the view is
̅I , the mean of , = , ․ ро , the image of , under ро , then the new centroid for the ith class is given by
̅ I = ̅?+ ко ∑ / (̅ ̅ I ) . (2)
And the new target for the jth sample in the Ith class ti,J= , 'j + к, ( ̅ 1 - Vi,j) (3)
The new targets for each point , together form new target matrix, T1, which is then ‘pursued’. That is, a new projection, p1 , and view, V1 = , is found that minimises |XP1 - T1 | , using a perceptron learning algorithm[13].This process is then iterated until a convergence condition is met; in this case that the net movement as a result of projection pursuit is below a threshold.
| – pn I
-
| | ^ – | | < 6 (4)
Since the complexity of the repulsion-attraction algorithm is linear and that of the perceptron algorithm is polynomial [18], then this suggests that feature selection based on targeted projection pursuit that will be more efficient than wrapper approaches. The reason why TPP is potentially so efficient is that it exploits the linearity of the projections being searched:
Conventional projection pursuit searches the space of all possible projections from an n dimensional data space to a (typically) 2 dimensional view space; that is, a 2n search space. Targeted Projection Pursuit, on the other hand, postulates an ideal targeted view and then uses the linearity of the mapping to find a projection that best matches that target. Given a problem involving both hard and soft constraints, most search algorithms explore the space of solutions that meet the hard constraints attempting to optimise the soft constraints. TPP on the other hand, finds a solution that optimises the soft constraint (the ideal) view and then finds the closest matching solution to it that also meets the hard constraint.
In addition, it is found in practice that the TPP class separation algorithm converges very quickly: there was no significant increase in feature selection accuracy in allowing the algorithm to run for more than 10 cycles. An example of a projection produced by TPP is show in figure 1.
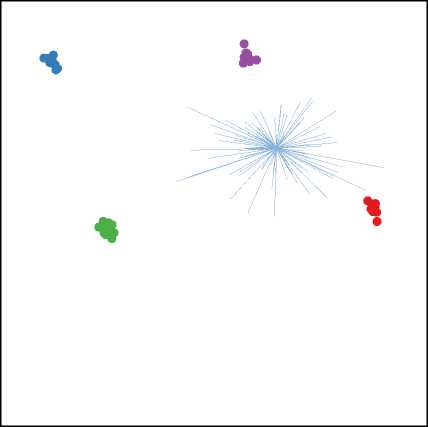
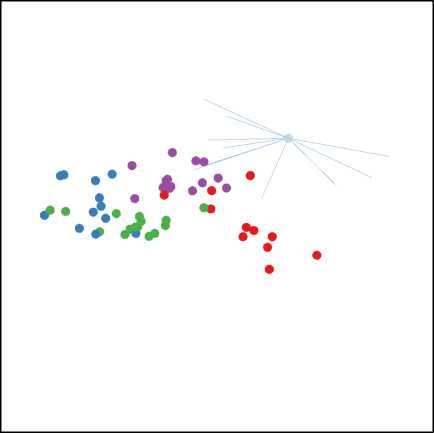
Fig. 1. A Projection of Data16 found by TPP showing the separation between classes (T) and after selection of the top 10 features (B)
-
III. Experiment
The aims of the experiments were to compare the performance of TPP with other feature selection techniques, to determine the optimal dimensionality of the output space, and to compare the time efficiency of the algorithm with other techniques.
Methods
TPP was tested against a range of other feature selection representing the major approaches to the problem. Five features were selected in each case:
IG : Information Gain is a standard, robust, and efficient attribute ranking approach that selects features based on the information they carry about the classification; as originally used by Quinlan in the ID3 classifier [19].
FCBF: a filter method that improves on IG by removing redundant features based on their correlations with others [20].
Greedy: a wrapper algorithm that uses a steepest ascent hill search to incrementally amend the subset of features selected [21].
TPP: As defined above, using a two-dimensional output space.
The quality of the resulting dimensionally reduced data sets were tested using a support vector machine classifier, chosen because of its known suitability to this task [2224]. The data mining package Weka [21] contains all algorithms used, apart from TPP which is made available in an extended version of the package on the associated website, along with all data used.
In each case a number of features are selected and the resulting dimensionally-reduced data used to construct sets to test and train classifiers using a 10-fold testing regime. Two feature selection and training regimes were used. In the first, the training data is used to select features and then a classifier is trained on just those features of that same training data, and tested on the dimensionally reduced testing set. This models the process in which a labelled data set is used to produce both a list of features and a classifier trained on those features, which can then be applied to other unlabelled samples. However in this case only the generalisation performance of the feature-selected classifier is tested, not the generalisation performance of the feature selection processes itself.
As Wessels argues [25], the relatively small sample size and high dimensionality of most microarray data sets makes it imperative to ensure that the feature selection process is unbiased to ensure an accurate comparison between techniques. And so in the second training regime, features are selected using a distinct subset of the data from that used to train, and that used to test the generalisation performance of, the classifier. Thus, in the 10-fold classification testing regime used here, for each fold the original data set is divided into three subsets with 45% used to select features, 45% is then dimensionally reduced based on those selected features and used to train the classifier, and the remaining 10% is dimensionally reduced and used to test the generalisation performance of the classifier. This is more representative of the
‘biomarker’ use case, in which the purpose of feature selection is to produce a list of genes, for example, that most reliably indicate a diagnostic class: a population would then be assayed using just these biomarkers and that data subsequently used to train a classifier to be used in automated diagnosis.
A. Data
Each feature selection and classification technique was applied to each of the 27 data sets collated by Song et al , containing gene expression levels of cancers of a range of diagnostic classes. The data sets contain between 33 and 295 samples, with between 80 and 54614 gene expression levels measured per sample, of 2 to 5 diagnostic classes. The dimensionality of each data set was reduced to 100 attributes using IG ranking to eliminate noise and to give a ‘level playing field’ for each feature selection technique (since there was insufficient computing power available to apply wrapper techniques such as Greedy to the original data). This data was selected since it seemed preferable to use a larger number of data sets reflecting one specific, and extremely important, application of feature selection, rather than a disparate collection of less relevant data sets. In addition, relatively few of the standard data sets in the UCI repository, for example, are high dimensional enough to make feature selection on this scale a realistic task, with typically less than 50 attributes per data set rather than the hundreds or thousands in the data sets studied here.
-
IV. Results
The classification generalisation error using features selected by each method under each testing scheme are shown in Table 1 along with the Friedman mean rank and the Wilcoxon signed-rank test of significance of the difference of the performance with the next-worse method. Under the first scheme, the performance of TPP was intermediate between the wrapper (Greedy) and filter (FCBF) methods, all of which outperformed the ranking method (IG) – though the difference between the filter and ranking methods was not significant. However under the second testing scheme, which emphasised the generalisation performance of the feature selection process, TPP outperformed the other methods suggesting that wrapper selection can suffer from a version of overfitting in this context.
Table 1. Performance of each feature selection technique under testing scheme
|
Testing Regime |
Scheme 1 |
Scheme 2 |
||||||
|
Feature Selector |
Greedy |
TPP |
FCBF |
IG |
TPP |
Greedy |
IG |
FCBF |
|
Mean Generalisation Error |
15.86 |
21.72 |
23.95 |
25.33 |
25.05 |
28.23 |
28.01 |
30.01 |
|
Mean Rank |
1.21 |
2.50 |
3.09 |
3.20 |
2.26 |
2.50 |
2.54 |
2.70 |
|
Significance of difference |
- |
.000 |
.046 |
.594 |
- |
.001 |
.656 |
.024 |
Table 2. Effect of Dimensionality of Output Space on Performance of TPP Feature Selection, by number of classes.
|
Number of classes (data sets) |
Number of output dimensions |
||||
|
1 |
2 |
3 |
4 |
5 |
|
|
2 classes (14) |
19.65 |
18.97 |
20.23 |
18.13 |
22.40 |
|
3 classes (4) |
21.10 |
18.54 |
18.87 |
22.57 |
18.13 |
|
4 classes (7) |
33.98 |
31.07 |
32.67 |
30.53 |
24.81 |
|
5 classes (2) |
26.11 |
28.71 |
27.03 |
24.81 |
26.52 |
|
All (27) |
24.06 |
22.77 |
23.76 |
22.41 |
22.70 |
^^^^^™ 2 classes
^^^^^™ 3 classes
^^^^^е 4 classes с 5 classes
^^^^^™All
Dimensionality of output space
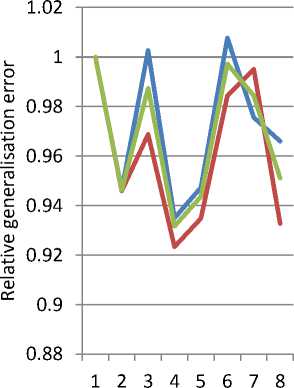
Fig. 2. Effect of Dimensionality of Output Space on Relative Performance of TPP Feature Selection, by number of classes
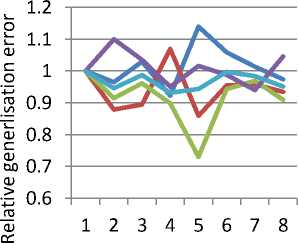
Table 2 and Figure 2 show the effect of output dimensionality on feature selection using TPP, broken down by the number of labelled classes in each data set. (In Figure 2 the error rates are scaled relative to the performance for D=1 in order to show the effect of output dimensionality more clearly.) It was thought that higher numbers of output dimensions would better suit data sets with more classes, however the evidence is not clear. If we ignore the case of five classes (for which there were only two data sets available), then in each case the technique performed better with a two-dimensional output space than a single dimension; then deteriorated with three dimensions. Moreover the improvement from one to two dimensions was less for the case of 2 class data sets than those with more classes. There was no clear pattern for output spaces of more than three dimensions. This would suggest that a two-dimensional output space is the best compromise between class separation and generalisation performance for feature selection problems with low numbers of classes, though more experimental work would be required to prove this.
Table 3 and Figure 3 show the effect of output dimensionality on feature selection using TPP, broken down by the number features selected. The consistent improvement from one to two dimensions is clear, but adding more dimensions has a mixed effect. However, in all of the higher-dimensional cases the improvement in performance when selecting more features is greater than selecting fewer. This may indicate that higherdimensional output spaces force less selectivity in the combinations of features selected.
Table 3. Effect of Dimensionality of Output Space on Performance of TPP Feature Selection, by number of features selected.
|
Number of features selected |
Number of output dimensions |
||||
|
1 |
2 |
3 |
4 |
5 |
|
|
5 |
26.51 |
25.09 |
26.58 |
24.78 |
25.11 |
|
10 |
21.61 |
20.44 |
20.94 |
19.96 |
20.20 |
|
All |
24.06 |
22.77 |
23.76 |
22.41 |
22.70 |
^^^^^^ 5 features
^^^^^ ■ ^ 10 features
^^^^^^All
Dimensionality of output space
Fig. 3. Effect of Dimensionality of Output Space on Relative Performance of TPP Feature Selection, by number of features selected
с Greedy
- TPP
Dimensionality of Search Space
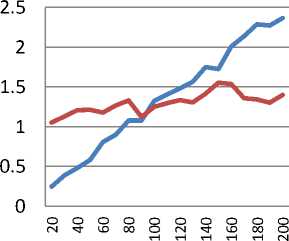
Fig. 4. Relative efficiency of Greedy and TPP algorithms
Figure 4 shows the relative time efficiency of the Greedy and TPP search algorithms against the number of attributes in the data, calculated using the elapsed computation. Versions of a single data set (data1) were produced, ranging from 20 to 200 attributes, and the elapsed training time for each algorithm was found (2.7GHz AMD 64bit processor, Windows 7, Weka implementation). Greedy is more efficient for lower dimensions (N<100), but TPP appears to scale more efficiently, suggesting that it may be more suitable for searching very high dimensional spaces.
-
V. Conclusions
The selection of combinations of features to classify a data set involves two problems: the size of the power set of features to search, and ensuring that the choice of features generalises: it is always possible to find features that correlate with labelled classes, but this is no guarantee that the same correlations will persist in unlabelled cases. Targeted Projection Pursuit exploits the linearity of projections to reduce the search problem and the evidence suggests that the selection of features may generalise more robustly that standard wrapper or filter techniques and will scale more efficiently to very high dimensional data. However more work is required to investigate the effect of output dimensionality and the number of classes and selected features on feature selection generalisation performance.
-
VI. Bibliography
-
[1] I. Guyon and A. Elisseeff, “An introduction to variable and feature selection,” The Journal of Machine Learning Research , vol. 3, 2003, pp. 1157–1182.
-
[2] I. Guyon and A. Elisseeff, “Special issue on variable and feature selection,” Journal of Machine Learning Research. 2003.
-
[3] Y. Saeys, I. Inza, and P. Larranaga, “A review of feature selection techniques in bioinformatics,” Bioinformatics , vol. 23, 2007, p. 2507.
-
[4] R. Kohavi and G.H. John, “Wrappers for feature subset selection,” Artificial intelligence , vol. 97, 1997, pp. 273– 324.
-
[5] L.F. Wessels, M.J. Reinders, T. van Welsem, and P.M. Nederlof, “Representation and classification for high-throughput data,” Proceedings of SPIE , 2002, p. 226.
-
[6] R.L. Somorjai, B. Dolenko, and R. Baumgartner, “Class prediction and discovery using gene microarray and proteomics mass spectroscopy data: curses, caveats, cautions,” Bioinformatics , vol. 19, 2003, p. 1484.
-
[7] S. Das, “Filters, wrappers and a boosting-based hybrid for feature selection,” Proceedings of the Eighteenth International Conference on Machine Learning , 2001, pp. 74–81.
-
[8] H. Liu and L. Yu, “Toward integrating feature selection algorithms for classification and clustering,” IEEE Transactions on knowledge and data engineering , 2005, pp. 491–502.
-
[9] J.H. Friedman and J.W. Tukey, “A projection pursuit algorithm for exploratory data analysis,” IEEE Transactions on computers , vol. 100, 1974, pp. 881–890.
-
[10] E.K. Lee, D. Cook, S. Klinke, and T. Lumley, “Projection pursuit for exploratory supervised classification,” Journal of Computational and Graphical Statistics , vol. 14, 2005, pp. 831–846.
-
[11] Q. Guo, W. Wu, F. Questier, D.L. Massart, C. Boucon, and S. De Jong, “Sequential projection pursuit using genetic algorithms for data mining of analytical data,” Anal. Chem , vol. 72, 2000, pp. 2846–2855.
-
[12] Q. Guo, W. Wu, D.L. Massart, C. Boucon, and S. De Jong, “Feature selection in sequential projection pursuit,” Analytica Chimica Acta , vol. 446, 2001, pp. 85–96.
-
[13] J. Faith, R. Mintram, and M. Angelova, “Targeted projection pursuit for visualizing gene expression data classifications,” Bioinformatics , vol. 22, 2006, p. 2667.
-
[14] J. Faith, “Targeted Projection Pursuit for Interactive Exploration of High-Dimensional Data Sets,” Proceedings of the 11th International Conference Information Visualization , 2007, pp. 286–292.
-
[15] L. Jimenez and D. Landgrebe, “High dimensional feature reduction via projection pursuit,” Geoscience and Remote Sensing Symposium, 1994. IGARSS'94. Surface and Atmospheric Remote Sensing: Technologies, Data
Analysis and Interpretation., International, 1994.
-
-
[16] L.O. Jimenez and D.A. Landgrebe, “Hyperspectral data analysis and supervised feature reduction viaprojection pursuit,” IEEE Transactions on Geoscience and Remote Sensing , vol. 37, 1999, pp. 2653–2667.
-
[17] J. Nelder and and R.A. Wedderburn, “Generalized Linear Models,” Journal of the Royal Statistical Society. Series A (General) , vol. 135, 1972, pp. 370–384.
-
[18] R. Rojas, Neural Networks. A systematic approach , Springer-Verlag, 1996.
-
[19] J.R. Quinlan, “Induction of decision trees,” Machine learning , vol. 1, 1986, pp. 81–106.
-
[20] L. Yu and H. Liu, “Feature selection for high-dimensional data: a fast correlation-based filter solution,” Proceedings of the Twentieth International Conference on Machine Learning , 2003, p. 856.
-
[21] I.H. Witten and E. Frank, “Data mining: practical machine learning tools and techniques with Java implementations,” ACM SIGMOD Record , vol. 31, 2002, pp. 76–77.
-
[22] Y. Lee and C.K. Lee, “Classification of multiple cancer types by multicategory support vector machines using gene expression data,” Bioinformatics , vol. 19, 2003, p. 1132.
-
[23] I. Guyon, J. Weston, S. Barnhill, and V. Vapnik, “Gene selection for cancer classification using support vector machines,” Machine learning , vol. 46, 2002, pp. 389–422.
-
[24] T.S. Furey, N. Cristianini, N. Duffy, D.W. Bednarski, M. Schummer, and D. Haussler, “Support vector machine classification and validation of cancer tissue samples using microarray expression data,” Bioinformatics , vol. 16, 2000, p. 906.
-
[25] L.F.A. Wessels, M.J.T. Reinders, A.A.M. Hart, C.J. Veenman, H. Dai, Y.D. He, and L.J.V. Veer, “A protocol for building and evaluating predictors of disease state based on microarray data,” Bioinformatics , vol. 21, Oct. 2005, pp. 3755-3762.
References Feature Selection with Targeted Projection Pursuit
- I. Guyon and A. Elisseeff, “An introduction to variable and feature selection,” The Journal of Machine Learning Research, vol. 3, 2003, pp. 1157–1182.
- I. Guyon and A. Elisseeff, “Special issue on variable and feature selection,” Journal of Machine Learning Research. 2003.
- Y. Saeys, I. Inza, and P. Larranaga, “A review of feature selection techniques in bioinformatics,” Bioinformatics, vol. 23, 2007, p. 2507.
- R. Kohavi and G.H. John, “Wrappers for feature subset selection,” Artificial intelligence, vol. 97, 1997, pp. 273–324.
- L.F. Wessels, M.J. Reinders, T. van Welsem, and P.M. Nederlof, “Representation and classification for high-throughput data,” Proceedings of SPIE, 2002, p. 226.
- R.L. Somorjai, B. Dolenko, and R. Baumgartner, “Class prediction and discovery using gene microarray and proteomics mass spectroscopy data: curses, caveats, cautions,” Bioinformatics, vol. 19, 2003, p. 1484.
- S. Das, “Filters, wrappers and a boosting-based hybrid for feature selection,” Proceedings of the Eighteenth International Conference on Machine Learning, 2001, pp. 74–81.
- H. Liu and L. Yu, “Toward integrating feature selection algorithms for classification and clustering,” IEEE Transactions on knowledge and data engineering, 2005, pp. 491–502.
- J.H. Friedman and J.W. Tukey, “A projection pursuit algorithm for exploratory data analysis,” IEEE Transactions on computers, vol. 100, 1974, pp. 881–890.
- E.K. Lee, D. Cook, S. Klinke, and T. Lumley, “Projection pursuit for exploratory supervised classification,” Journal of Computational and Graphical Statistics, vol. 14, 2005, pp. 831–846.
- Q. Guo, W. Wu, F. Questier, D.L. Massart, C. Boucon, and S. De Jong, “Sequential projection pursuit using genetic algorithms for data mining of analytical data,” Anal. Chem, vol. 72, 2000, pp. 2846–2855.
- Q. Guo, W. Wu, D.L. Massart, C. Boucon, and S. De Jong, “Feature selection in sequential projection pursuit,” Analytica Chimica Acta, vol. 446, 2001, pp. 85–96.
- J. Faith, R. Mintram, and M. Angelova, “Targeted projection pursuit for visualizing gene expression data classifications,” Bioinformatics, vol. 22, 2006, p. 2667.
- J. Faith, “Targeted Projection Pursuit for Interactive Exploration of High-Dimensional Data Sets,” Proceedings of the 11th International Conference Information Visualization, 2007, pp. 286–292.
- L. Jimenez and D. Landgrebe, “High dimensional feature reduction via projection pursuit,” Geoscience and Remote Sensing Symposium, 1994. IGARSS'94. Surface and Atmospheric Remote Sensing: Technologies, Data Analysis and Interpretation., International, 1994.
- L.O. Jimenez and D.A. Landgrebe, “Hyperspectral data analysis and supervised feature reduction viaprojection pursuit,” IEEE Transactions on Geoscience and Remote Sensing, vol. 37, 1999, pp. 2653–2667.
- J. Nelder and and R.A. Wedderburn, “Generalized Linear Models,” Journal of the Royal Statistical Society. Series A (General), vol. 135, 1972, pp. 370–384.
- R. Rojas, Neural Networks. A systematic approach, Springer-Verlag, 1996.
- J.R. Quinlan, “Induction of decision trees,” Machine learning, vol. 1, 1986, pp. 81–106.
- L. Yu and H. Liu, “Feature selection for high-dimensional data: a fast correlation-based filter solution,” Proceedings of the Twentieth International Conference on Machine Learning, 2003, p. 856.
- I.H. Witten and E. Frank, “Data mining: practical machine learning tools and techniques with Java implementations,” ACM SIGMOD Record, vol. 31, 2002, pp. 76–77.
- Y. Lee and C.K. Lee, “Classification of multiple cancer types by multicategory support vector machines using gene expression data,” Bioinformatics, vol. 19, 2003, p. 1132.
- I. Guyon, J. Weston, S. Barnhill, and V. Vapnik, “Gene selection for cancer classification using support vector machines,” Machine learning, vol. 46, 2002, pp. 389–422.
- T.S. Furey, N. Cristianini, N. Duffy, D.W. Bednarski, M. Schummer, and D. Haussler, “Support vector machine classification and validation of cancer tissue samples using microarray expression data,” Bioinformatics, vol. 16, 2000, p. 906.
- L.F.A. Wessels, M.J.T. Reinders, A.A.M. Hart, C.J. Veenman, H. Dai, Y.D. He, and L.J.V. Veer, “A protocol for building and evaluating predictors of disease state based on microarray data,” Bioinformatics, vol. 21, Oct. 2005, pp. 3755-3762.
