Features of Digitalization of the Arctic Regions of Russia

Author: Kuratova L.A.
Journal: Arctic and North @arctic-and-north
Section: Northern and arctic societies
Article in issue: 50, 2023.
Free access
Digital space allows connecting people without regard to physical space and makes many social services available, which is especially relevant for the Arctic territories. The aim of the study is to analyze the features of the digital space of the Russian Arctic regions. Research objectives: building a database of series of variables in the context of the Russian Arctic regions for the period 2014-2020, making a retrospective analysis of the dynamics of their digitalization, ranking the Russian Arctic regions by the level of digitalization based on the construction of an integral index. The objects of the study are nine Arctic regions of Russia. The results of the study provide recommendations for further digitalization of the Arctic regions. The scientific novelty of the study is determined by the application of the index method for ranking the Russian Arctic regions by the level of digitalization for the period 2014-2020 according to four sub-indices: activities of households, population, authorities, organizations, which made it possible to trace the dynamics of indicators, evaluate the effectiveness of measures to develop the digital space of the regions. The methodology makes it possible to carry out calculations based on publicly available statistical data and can be used for territories of various levels when conducting retrospective analysis and strategic forecasting procedures. The practical significance of the study lies in the fact that the results obtained may be in demand when assessing the effectiveness of digitalization in the course of developing strategies and programs for digitalization of the regional space. The prospects for further research are determined by a deeper analysis of the degree of influence of variables on the level of digitalization of regions and the formation of proposals and recommendations for adapting digitalization processes, taking into account the current international situation.
Digitalization index, information and communication technologies, digital divide, Arctic region
Short address: https://sciup.org/148329284
IDR: 148329284 | UDC: [330.341.1:004.77](985)(045) | DOI: 10.37482/issn2221-2698.2023.50.154
Text of the scientific article Features of Digitalization of the Arctic Regions of Russia
Digital space connects people without regard to physical geography and represents the accumulation of all information in digital form [1, Killan A.; 2, Kukul T., Coşkun E.A., pp. 951-959]. However, the limitations of access to modern means of communication in different social groups lead to digital inequality or digital barrier. Cyberspace enables the dissemination of messages and
∗ © Kuratova L.A., 2023
content [3, Castells M.], while a culture based on digital information processing can create a gap between those generations who were born before the introduction of the Internet and those who grew up in a digital environment [4, Castells M., p. 8].
It is worth noting that digitalization is understood both as the application of digital technologies in business to generate income 1 and as a way of restructuring many areas of social life related to digital communications and media infrastructures 2. A secure, sustainable digital infrastructure with telecommunications connectivity is one of the main components of digitalization 3. The diffusion of information and communication technologies (hereinafter referred to as ICT) is the main driver of digitalization [5, Heeks R., pp. 16–33]. The intensive application of ICT improves existing economic activities, while the extensive application expands economic activities [6, Bukht R., Heeks R., pp. 143–172]. Information and communication infrastructure is necessary for the creation, distribution, search, preservation of information and knowledge in society [7, Hardy A., pp. 278–286; 8, Stanley T.D., Doucouliagos C., Steel P., pp. 705–726; 9, Hanseth O., pp. 122–156; 10, Pironti J.P., pp. 1–5]. The introduction of ICT is inextricably linked to the effective socio-economic development of the territory [11, Thapa D., Sæbø Ø., pp. 1–15; 12, Palviaa P., Baqir N., Nemati H., pp. 160–176], productivity growth [13, Liao H., Wang B., Li B., Weyman-Jones T., pp. 10–25], GDP increase [14, Moulton B.R., pp. 34-48], creation of institutional infrastructure, social justice, support for economic activity [15, Walsham G., pp. 18–41].
The digital economy is impossible without investment in information infrastructure, including IT equipment, fiber optic lines, wireless and local networks, software [16, Haltiwanger J., Jarmin R.S., pp. 13–33]. In 2022, a Decree of the President of the Russian Federation was signed 4 on measures to accelerate the development of the IT industry in Russia.
At the same time, according to a number of Presidential Decrees 5, the low level of development of the information infrastructure of the Russian Arctic territories is recognized as one of the main threats to national security, and its improvement is one of the priority tasks.
Therefore, studies on the digitalization of the AZRF regions are relevant.
Research methodology
Researchers make attempts to rank regions and countries by the level of digitalization by means of integral indices, using such indicators as: the human potential of the region and the degree of use of external conditions in organizations [17, Kozlov A.V., Teslya A.B., Ivashchenko A.A., pp. 21–31], material indicators and indicators characterizing the information and communication subsystem [18, Kozlov A.V.; 19, Kozlov A.V., pp. 106–117], the use by organizations of broadband access (hereinafter referred to as BBA) to the Internet, cloud services, special software and electronic data exchange [20, Sadyrtdinov R.R., pp. 230–235], indicators of the external environment, the availability of digital technologies and their use by the state, business and society [21, Kamneva V.V., Baeva D.A., pp. 37–44], accessibility, infrastructure investment, network access, capacity, usage, human capital [22, Katz R., Koutrompis P., Callorda F.M., pp. 32–44], digital infrastructure, ability to digital innovation, the scale of digital industry and the use of digital technologies [23, Tang L., Lu B., Tian T.]. However, a number of variables used for calculations according to these methods are not available in open statistical sources for the regions of the Russian Arctic. At the state level, digitalization by region can be assessed through a number of ratings, such as “Rating of regions for the development of the information society”, “Rating of digital maturity of Russian regions”, which are not calculated annually (some of them even once), so it is impossible to conduct a full retrospective analysis.
Thus, the purpose of the study was to analyze the features of the digital space of the Arctic regions of Russia. To achieve the goal, it was necessary to solve the following tasks: to build a database of series of variables in the context of the Arctic regions of Russia for the period 2014– 2020, to conduct a retrospective analysis of the dynamics of their digitalization, to calculate the integral index of digitalization of the Russian Arctic regions, to rank the AZRF regions by the level of digitalization, to give recommendations. The object of the study is the AZRF regions. The Russian Arctic as an object of statistical observation has some features that are primarily related to its administrative structure. The Russian Arctic includes the entire territory of four regions of the Russian Federation and a number of administrative units (cities, urban districts, municipal districts, uluses) of five more regions, which leads to the complexity of collecting statistical data. Most often, statistics related to digitalization are published for the whole subject of the Russian Federation, without a breakdown by administrative units.
General scientific methods were used as the methodological basis of the study: cause-and-effect and logical-structural analysis and synthesis; applied economic and statistical methods: systematization of statistical information, compilation of information and analytical database. Data processing was carried out using MS Excel.
This study was conducted in stages. The first stage involved the collection of statistical data and the construction of a database of series of variables by regions of the AZRF for the period
2014–2020 according to the data of the Federal State Statistics Service 6 (Figures 1–3; 5–8, Tables 2–5 were based on this data). The information base was also the data of the Ratings of ICT costs of the Russian regions for the period 2014–2021 (Figures 9 and 10), digitalization ratings (Table 1).
The variables for analysis were selected due to the fact that they are used as target indicators in a number of legislative acts of the Russian Federation, and are also contained in the Federal Statistical Work Plan 7, which has been supplemented with official information characterizing the socio-economic development of the Russian Arctic since 2016.
At the next stage, a retrospective analysis of the dynamics of digitalization of the Russian Arctic subjects for the period 2014–2021 was carried out.
Then the AZRF regions were ranked by the level of digitalization based on the construction of the index. The ranking of regions by the level of digitalization was carried out according to four sub-indices, consisting of a number of variables:
-
1. Sub-index “Digitalization of households” (SI DH ):
-
• share of households with a computer, Х 1 ;
-
• share of households with access to the Internet, Х 2 ;
-
• share of households with broadband access to the Internet, Х 3 ;
-
• share of households not using the Internet due to high connection costs, Х 4 ;
-
• share of households using Internet access to search for information on goods, services, order goods, X 5 ;
-
• number of mobile phones per 100 households, Х 6 .
-
2. Sub-index “Digitalization of population” (SI DP ):
-
• share of population using personal computers, Х 7 ;
-
• share of population using the Internet, Х 8 ;
-
• share of population using the Internet to order goods and/or services, Х 9 ;
-
• share of population not using the Internet for security reasons, Х 10 ;
-
• share of population using the Internet to receive state and municipal services, Х 11 ;
-
• share of population using a mobile phone or smartphone in the last 3 months, Х 12 .
-
3. Sub-index “Digitalization of government activities” (SI DG ):
-
• share of public authorities and local governments using the Internet, X 13 ;
-
• share of public authorities and local governments using the Internet at a speed of 256 Kbps or higher, X 14 ;
-
• share of public authorities and local governments using the Internet at a speed of at least 2 Mbit/sec, X 15 ;
-
• share of electronic document flow between public authorities in the total volume of interdepartmental document flow, X 16 ;
-
• share of population who encountered problems in obtaining state and municipal services through official websites and portals, X 17 ;
-
• share of population satisfied with the quality of electronic public services, X 18 .
-
4. Sub-index “Digitalization of organizations” (SI DO ):
-
• number of personal computers in organizations, Х 19 ;
-
• number of personal computers with Internet access, Х 20 ;
-
• share of organizations using broadband access to the Internet, Х 21 ;
-
• share of organizations that had a website, Х 22 ;
-
• share of organizations that used the Internet to place orders for goods (works, services), Х 23 ;
-
• share of employees of organizations using personal computers at least once a week, Х 24 .
The variables were normalized by converting them into dimensionless values in the range from 0 to 1. For this purpose, the current value of the variable for each of the AZRF regions was divided by the maximum possible value for this variable according to the formula:
-
14 ma x (X i ) (1)
where x ij — the value of the i-th variable in the j-th region, and ma x (X1) - the normalizing (“reference”) value of the variable.
The normalized values of the variables are in the range from 0 to 1, respectively, if the region of the Russian Arctic has a “reference” value of the variable, then its score for this indicator is 1, therefore, the region’s lag behind the “reference” value is determined by the value of the normalized value.
The final value of each variable was found as the arithmetic mean of the normalized indicators of this variable for the period 2014–2020. The sub-indices values were calculated as the sum of the final values of the variables.
The final digitalization index for each region of the Russian Arctic (I DR ) is calculated as the arithmetic average of four sub-indices. The AZRF regions were ranked on the basis of the obtained value of the final digitalization index.
Results
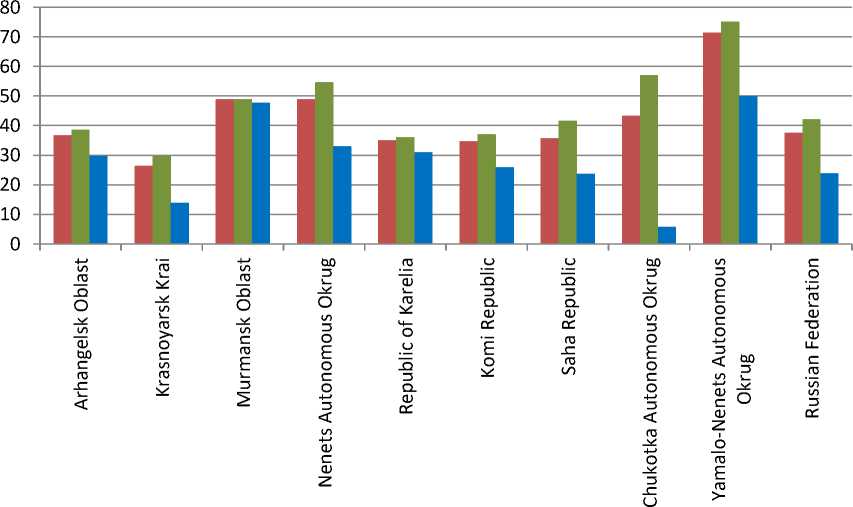
The level of ICT inflow in the regions of the Russian Arctic can be judged by various ratings of digitalization of regions. The Yamalo-Nenets Autonomous Okrug is the leader in almost every of the five ratings reviewed, while the Chukotka Autonomous Okrug is among the outsiders. The remaining regions of the Russian Arctic occupy average places.
Table 1
Positions of the Russian Arctic regions in the Russian digitalization ratings
|
1 |
2 |
3 |
4 |
5 |
|
|
Leading regions (top 10 places) |
Yamalo- Nenets AO |
Yamalo- Nenets AO |
None of the AZRF regions |
Yamalo- Nenets AO |
None of the AZRF regions |
|
Mid-level regions |
All other regions of AZRF |
All other regions of AZRF |
All other regions of AZRF |
All other regions of AZRF |
All regions of AZRF |
|
Lagging regions (last 10 places) |
Chukotka AO |
Chukotka AO |
Chukotka AO |
Chukotka AO |
None of the AZRF regions |
|
where, 1 — Index “Digital Russia” 8 (2017–2018), 2 — Rating for the development of the information society 9 (2016–2017), 3 — Rating for the quality of public services in electronic form 10 (2020), 4 — Digital maturity rating of Russian regions 11 (2021), 5 — Digital maturity rating of Russian regions in the healthcare sector 12 (2021) |
|||||
Table 2 shows the average values of the normalized variables and the average value of the “Digitalization of population” (SI DP ) sub-index for the period 2014–2022 in the regions that are part of the Russian Arctic. In five regions, the Russian Arctic does not include the entire territory, but only a few municipalities, but due to the lack of statistical data, the analysis was carried out for the whole region, so they are highlighted in tables 2–5 as a separate block. The Yamalo-Nenets Autonomous Okrug leads in terms of the “Digitalization of Population” sub-index, lagging behind only one indicator — share of population not using the Internet for security reasons — from the Nenets Autonomous Okrug, the Krasnoyarsk Krai and the Chukotka Autonomous Okrug.
Table 2 Average values of normalized variables and values of the sub-index “Digitalization of population" (SIDP) in the regions of the Russian Arctic for the period 2014–2020
|
Region |
X 1 |
X 2 |
X 3 |
X 4 |
X 5 |
X 6 |
SI DP |
|
Included in AZRF throughout the region |
|||||||
|
Murmansk Oblast |
0.89 |
0.88 |
0.70 |
0.66 |
0.37 |
0.97 |
4.47 |
|
Nenets Autonomous Okrug |
0.86 |
0.49 |
0.74 |
0.46 |
0.20 |
0.95 |
3.70 |
|
Chukotka |
0.98 |
0.88 |
0.57 |
0.28 |
0.05 |
1.00 |
3.75 |
|
Yamalo-Nenets Autonomous Okrug |
1.00 |
1.00 |
0.92 |
0.99 |
0.23 |
1.00 |
5.14 |
|
Included in AZRF by some municipalities of the region |
|||||||
|
Arkhangelsk Oblast |
0.79 |
0.81 |
0.64 |
0.56 |
0.53 |
0.90 |
4.23 |
|
Krasnoyarsk Krai |
0.81 |
0.82 |
0.40 |
0.67 |
0.14 |
0.91 |
3.75 |
|
Republic of Karelia |
0.82 |
0.85 |
0.58 |
0.53 |
0.56 |
0.98 |
4.32 |
|
Komi Republic |
0.81 |
0.84 |
0.60 |
0.50 |
0.50 |
0.94 |
4.20 |
|
Saha Republic |
0.82 |
0.84 |
0.46 |
0.48 |
0.34 |
0.96 |
3.89 |
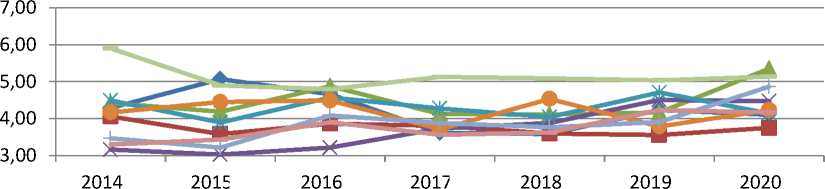
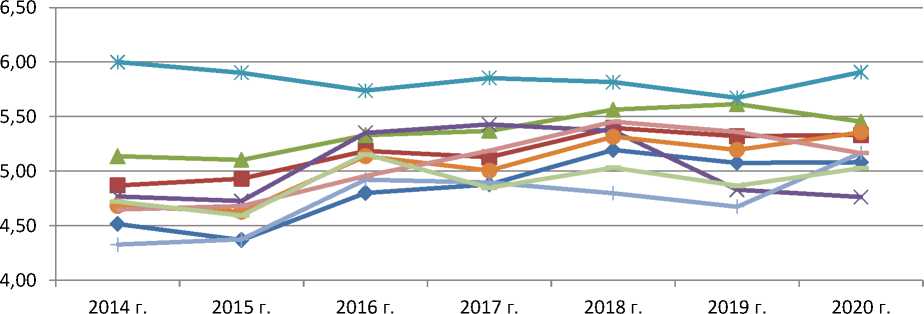
During the analyzed period, the digitalization of population increased in all regions, except for the Yamalo-Nenets Autonomous Okrug, but the largest growth took place in the Murmansk
Oblast and Chukotka Autonomous Okrug (Fig. 1).
Arhangelsk Oblast
— ■ — Krasnoyarsk Krai
-*- Murmansk Oblast
Nenets Autonomous Okrug
Republic of Karelia
—•-Komi Republic
Saha Republic
« ■■■■■■ вChukotka Autonomous Okrug
« ■■■■■■■ вYamalo-Nenets Autonomous Okrug
Fig. 1. Values of the sub-index “Digitalization of population” (SIDP) in the regions of the Russian Arctic in 2014–2020 13.
The population of the Russian Arctic using the Internet has doubled: from 3.3 million people in 2014 to 6.6 million people in 2020. The share of the population that is active Internet users is 88.6%, which is higher the all-Russian indicator by 4.5% (Fig. 2).
Share of households with a computer, % 100,0
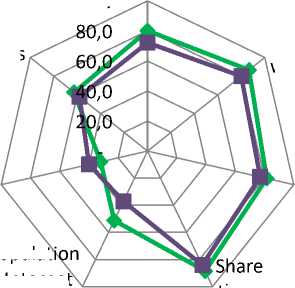
Share of households with Internet access, %
Share of households with broadband Internet access, %
Share of organizations using broadband access to the Internet, %
Number of PCs that had access to the Internet, per 100 employees of organizations
Share of the populati that used the Internet to order goods and (or) services, % of the population that are active Internet users, %
—•—Artic regions of Russia - ■ - Russia
Fig. 2. Indicators of ICT development in the Russian Arctic for 2021 14
In 2020, the population of the AZRF actively used various mobile devices to access the Internet, in particular tablets, mobile phones and smartphones. The share of households using personal computers to access the Internet in a number of regions decreased from 8% (Republic of Sakha) to 36.5% (Komi Republic). The largest decrease in the use of laptops and netbooks to access the Internet, by 26.8%, was observed in the Republic of Sakha. The number of mobile broadband Internet subscribers has grown significantly, the largest increase in 2020 compared to 2010 occurred in the Chukotka Autonomous Okrug (by 247%), the Komi Republic (by 189%) and the Arkhangelsk Oblast (by 165%).
For the period 2014–2020, the Yamalo-Nenets Autonomous Okrug was the leader in terms of the share of the population that prefers to receive public services via the Internet almost every year, although the largest increase in this indicator was observed in the Nenets Autonomous Okrug and the Republic of Sakha. The Republic of Komi, which in 2021 ranked first in the NorthWestern Federal District and 11th in Russia in terms of the number of registered users on the Gosuslugi portal, can also be singled out.
Among all the regions in the sub-index “Digitalization of households” (SIDH), the Yamalo-Nenets Autonomous Okrug stands out, whose leadership has been confirmed earlier in the analysis by its high positions in various federal rankings. This region is the leader due to the large proportion of households that had a personal computer, access to the Internet, including BBA, in comparison with other regions.
Table 3 Average values of normalized variables and values of the sub-index “Digitalization of households” (SIDH) in the regions of the Russian Arctic over the period 2014–2020
|
Region |
X 1 |
X 2 |
X 3 |
X 4 |
X 5 |
X 6 |
SIDH |
|
Included in AZRF throughout the region |
|||||||
|
Murmansk Oblast |
0.93 |
0.89 |
0.91 |
0.46 |
0.81 |
0.86 |
4.85 |
|
Nenets Autonomous Okrug |
0.82 |
0.75 |
0.67 |
0.10 |
0.80 |
0.80 |
3.93 |
|
Chukotka |
0.94 |
0.89 |
0.48 |
0.51 |
0.88 |
0.75 |
4.45 |
|
Yamalo-Nenets Autonomous Okrug |
1.04 |
1.00 |
1.00 |
0.49 |
0.88 |
0.88 |
5.29 |
|
Included in AZRF by some municipalities of the region |
|||||||
|
Arkhangelsk Oblast |
0.85 |
0.80 |
0.80 |
0.38 |
0.52 |
0.82 |
4.17 |
|
Krasnoyarsk Krai |
0.79 |
0.76 |
0.72 |
0.16 |
0.51 |
0.83 |
3.77 |
|
Republic of Karelia |
0.83 |
0.81 |
0.82 |
0.47 |
0.50 |
0.80 |
4.24 |
|
Komi Republic |
0.86 |
0.83 |
0.86 |
0.23 |
0.48 |
0.80 |
4.07 |
|
Saha Republic |
0.75 |
0.86 |
0.76 |
0.13 |
0.33 |
1.00 |
3.83 |
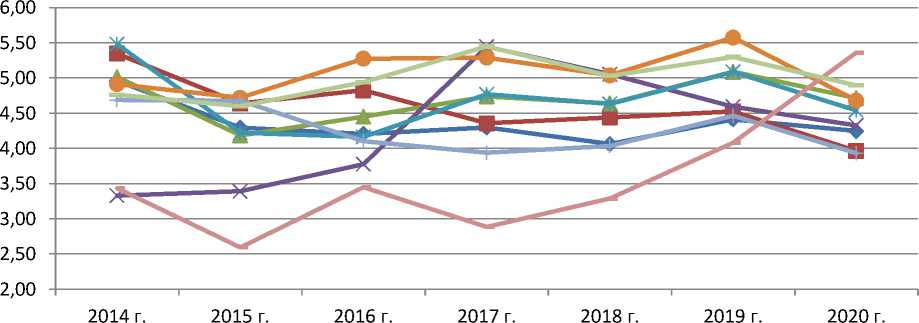
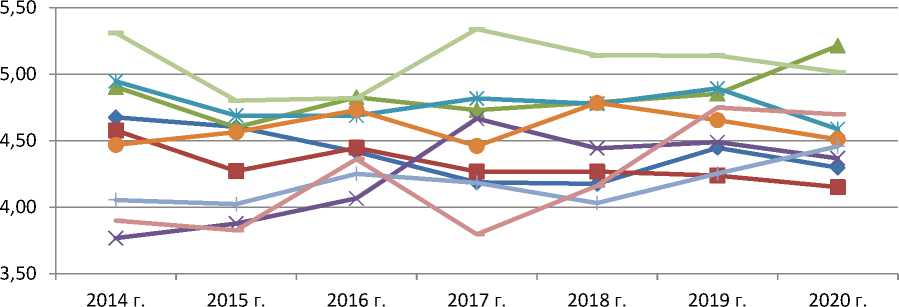
Over the entire period analyzed, in almost all the regions included in the AZRF, the most active digitalization of households was observed during 2016–2018 (Fig. 3).
—•—Arhangelsk Oblast
—л—Murmansk Oblast
- ■ -Krasnoyarsk Krai
Nenets Autonomous Okrug
Republic of Karelia
—•-Komi Republic
Saha Republic
^^^^^мChukotka Autonomous Okrug
-
■■■■■ »Yamalo-Nenets Autonomous Okrug
Fig. 3. Values of the sub-index “Digitalization of households” (SIDH) in the regions of the Russian Arctic in 2014–202015
While in 2010 the average number of personal computers in the AZRF regions was 88 PC per 100 households, in 2020 it reached an average ratio of 140 computers per 100 households, for Russia as a whole — 129 computers per 100 households.
Since 2010, the density of fixed communication in the Russian Arctic has been decreasing, while the density of cellular communication was actively growing until 2015. While in 2004, there were from 4 (Chukotka Autonomous Okrug) to 123 (Nenets Autonomous Okrug) mobile phones per 100 households, in 2020 there were 213 (Chukotka AO) to 302 (Sakha Republic) mobile phones per 100 households.
Despite such technological changes, the share of households with broadband access to the Internet in most regions of the AZRF does not reach the Russian average, although the overall share of households with BBA to the Internet in the AZRF is above 4.6% compared to the Russian Federation. Broadband access to the Internet provides higher connection speeds and, accordingly, more opportunities. This indicator in 2020 was lower than the all-Russian one in Chukotka Autonomous Okrug by 30.7 p.p., in Krasnoyarsk Krai — by 6.9 p.p., in Nenets Autonomous Okrug — by 4.5 p.p., in Arkhangelsk Oblast — by 1.6 p.p., in Republic of Karelia — by 0.5 p.p.
The main reasons for the limitations of the digitalization of the regions’ infrastructure in the Arctic are the geographical factor and the concentration of potential consumers in cities. In the AZRF regions, the share of urban residents in the total population ranges from 68% (Sakha Republic) to 92% (Murmansk Oblast). The number of federal or regional organizations is also many times greater in cities. Difficult geographical terrain and harsh climatic conditions mean that mobile operators and Internet providers need large capital expenses to build communication facilities in rural and hard-to-reach areas, and the economic efficiency of operations in such settlements is low. Therefore, the lower the population density, the lower the level of competition among operators and the less clear the signal. There are also rural localities with no mobile phone or Internet coverage at all. In the total number of settlements in the AZRF regions, such settlements account for 36.9%. maps of mobile network coverage in Sakha Republic with 2G network coverage by major Russian mobile operators Beeline, Megafon, MTS, Tele2, Yota (Fig. 4a) and 4G coverage (Fig. 4b) marked in color.
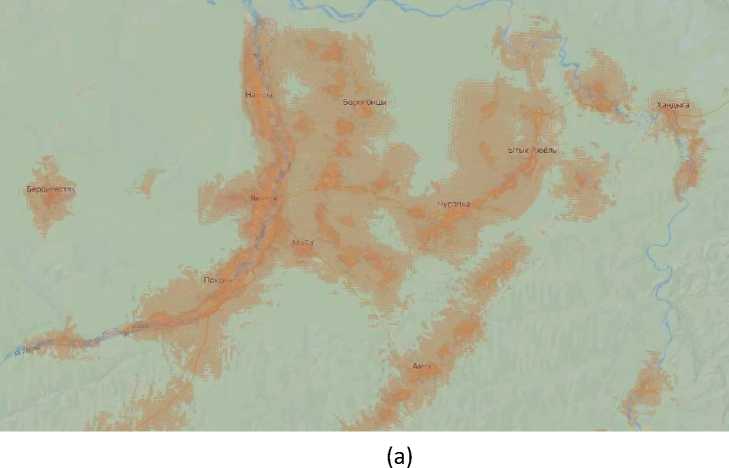
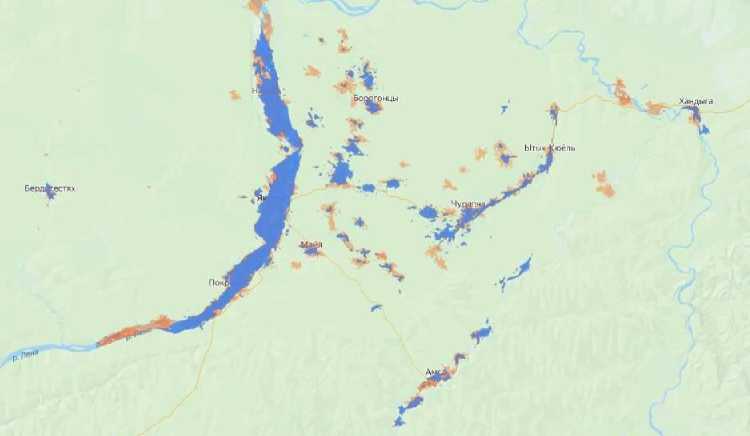
(b)
Fig. 4. Mobile coverage area in Sakha Republic in July 2022 — 2G network (a) and 4G network (b)16
The maps show that 4G networks are available in a smaller area than 2G networks. 4G networks allow for faster data transfer speeds (up to 100 Mbps), which means that consumers will be able to use various public and social services online. For example, in a number of regions, the rural population is less likely to use the Internet to order goods, works, and services. In the Chukotka Autonomous Okrug, the rural population using the Internet to order goods accounts for only 6% of the total population (Fig. 5).
■ all population, %
■ urban population, %
■ rural population, %
Fig. 5. The share of population using the Internet to order goods, works, services in the regions of the Russian Arctic in 2020 17.
At the same time, even in urban settlements of the Russian Arctic, there are a number of restrictions on information and communication services. The urban settlements of the Russian Arctic were divided into groups. The number of urban settlements covered by 4G, 3G and 2G networks, as well as the number of mobile operators providing services in each city were determined using a cellular coverage map. Data from the largest mobile operators in the Russian Federation — Beeline, Megafon, MTS, Tele2, Yota — were analyzed. The analysis shows that there are limitations to the availability of mobile phones in small urban areas: while four operators provide 2G network in 79 out of 82 urban areas of the AZRF, 3G networks are not available in 17 towns and 23 small urban areas, with an average of three operators providing mobile phone services in small towns. In the urban settlements of the Russian Arctic with a population of more than 50 thousand people, there is no differentiation in access to information and communication services by the number of service providers and coverage by networks of different generations.
It can be argued that the current configuration of information and communication networks contributes to the development of digital inequality in the regions of the Russian Arctic, and the high level of digitalization is largely due to urbanization.
It should be noted that this problem is solved at the federal level. Since March 2014, Rostelecom has been obliged 18 to provide universal communication services and public Wi-Fi access point with a data transfer rate of at least 10 Mbps in settlements with a population of 250 to 500 people. From 2021, according to the second stage, Rostelecom is to connect settlements with a population of 100 to 250 people to high-speed Internet and provide residents of settlements with a population of 100 to 500 people with mobile communications. At the same time, all base stations assume the availability of communication and 4G mobile Internet. Femtocells are installed in remote small settlements with up to 100 people. However, residents note that the signal reception from femtocells is low — 100-150 meters, there is a partial coverage of the signal, signal indoors weakens significantly or is lost completely 19. Monitoring by activists of the All-Russian People’s Front in 2021 in a number of areas of the Komi Republic revealed that in most villages people were not connected to the Internet because they did not know about this possibility or due to faulty equipment 20. In a significant part of the territory of the Komi Republic, there is no Internet coverage or its speed does not allow using Internet resources 21.
The Komi Republic and the Yamalo-Nenets Autonomous Okrug are leaders in the sub-index “Digitalization of government activities” (Table 4).
Table 4 Average values of normalized variables and values of the sub-index “Digitalization of government activities” (SI DG ) in the regions of the Russian Arctic for the period 2014–2020
|
Region |
X 1 |
X 2 |
X 3 |
X 4 |
X 5 |
X 6 |
SI DG |
|
Included in AZRF throughout the region |
|||||||
|
Murmansk Oblast |
0,94 |
0,93 |
0,77 |
0,86 |
0,40 |
0,79 |
4,69 |
|
Nenets Autonomous Okrug |
0,98 |
0,92 |
0,54 |
0,50 |
0,63 |
0,70 |
4,27 |
|
Chukotka |
0,97 |
0,85 |
0,27 |
0,41 |
0,55 |
0,54 |
3,59 |
|
Yamalo-Nenets Autonomous Okrug |
0,98 |
0,95 |
0,69 |
0,97 |
0,50 |
0,91 |
5,00 |
|
Included in AZRF by some municipalities of the region |
|||||||
|
Arkhangelsk Oblast |
0,98 |
0,92 |
0,66 |
0,57 |
0,44 |
0,79 |
4,35 |
|
Krasnoyarsk Krai |
0,97 |
0,88 |
0,61 |
0,41 |
0,75 |
0,95 |
4,59 |
|
Republic of Karelia |
0,99 |
0,96 |
0,84 |
0,57 |
0,52 |
0,81 |
4,70 |
|
Komi Republic |
1,00 |
0,99 |
0,90 |
0,72 |
0,62 |
0,85 |
5,07 |
|
Saha Republic |
0,97 |
0,77 |
0,51 |
0,56 |
0,62 |
0,84 |
4,26 |
Almost all regions demonstrated an increase in the values of this sub-index during 2015– 2017. In all regions, except for the Krasnoyarsk Krai and the Republic of Sakha, the share of the population experiencing problems in obtaining state and municipal services via the Internet has decreased in 2021 compared to 2014.
—•—Arhangelsk Oblast
- ■ -Krasnoyarsk Krai
—л—Murmansk Oblast
Nenets Autonomous Okrug
Republic of Karelia
—•-Komi Republic
Saha Republic
^^^^^мChukotka Autonomous Okrug
-
■■■■■ »Yamalo-Nenets Autonomous Okrug
Fig. 6. Values of the sub-index “Digitalization of government activities” (SIDG) in the regions of the Russian Arctic in 2014–
2020 22.
Organizations in the Republic of Karelia, Murmansk Oblast and Krasnoyarsk Krai were the most digitalized, as evidenced by the average values of the sub-indices “Digitalization of organizations” (SI DO ).
Table 5 Average values of normalized variables and values of the sub-index “Digitalization of organizations” (SI DO ) and the Digitalization Index (I DR ) in the regions of the Russian Arctic for the period 2014–2020
|
Region |
X 1 |
X 2 |
X 3 1 |
X 4 |
X 5 |
X 6 1 |
SIDO |
I DR |
|
Included in AZRF throughout the region |
||||||||
|
Murmansk Oblast |
0,86 |
0,87 |
0,98 |
0,93 |
0,86 |
0,87 |
5,37 |
4,85 |
|
Nenets AO |
0,77 |
0,86 |
0,94 |
0,85 |
0,93 |
0,68 |
5,04 |
4,24 |
|
Chukotka |
0,86 |
0,79 |
0,87 |
0,80 |
0,92 |
0,83 |
5,07 |
4,22 |
|
Yamalo-Nenets AO |
0,71 |
0,74 |
0,95 |
0,86 |
0,96 |
0,68 |
4,89 |
5,08 |
|
Included in AZRF by some municipalities of the region |
||||||||
|
Arkhangelsk Oblast |
0,83 |
0,74 |
0,91 |
0,79 |
0,80 |
0,81 |
4,88 |
4,40 |
|
Krasnoyarsk Krai |
0,85 |
0,90 |
0,91 |
0,84 |
0,80 |
0,86 |
5,17 |
4,32 |
|
Republic of Karelia |
1,00 |
1,00 |
0,98 |
0,97 |
0,89 |
1,00 |
5,84 |
4,77 |
|
Komi Republic |
0,84 |
0,82 |
0,96 |
0,80 |
0,80 |
0,83 |
5,05 |
4,60 |
|
Saha Republic |
0,81 |
0,89 |
0,76 |
0,68 |
0,83 |
0,76 |
4,74 |
4,18 |
In 2020, compared to 2014, the digitalization of organizations increased in all regions, except for the Nenets Autonomous Okrug and the Republic of Karelia (Fig. 7), where the share of organizations using the Internet to place orders for goods, works, and services decreased. In addition, the number of personal computers in organizations decreased in the Nenets Autonomous Okrug, while the share of organizations with a website declined in the Republic of Karelia. The number of personal computers with Internet access in the organizations of Russian Arctic is 8% lower compared to the all-Russian indicator (Fig. 2).
Arhangelsk Oblast
- ■ - Krasnoyarsk Krai
—л—Murmansk Oblast
Nenets Autonomous Okrug
Republic of Karelia
—•- Komi Republic
Saha Republic
■ вввввв»Chukotka Autonomous Okrug
« ■■■ мм»Yamalo-Nenets Autonomous Okrug
Fig. 7. Values of the sub-index “Digitalization of organizations” (SIDO) in the regions of the Russian Arctic in 2014–2020 23.
The most digitalized regions of the Russian Arctic for the period 2014–2020 were the
Yamalo-Nenets Autonomous Okrug, the Murmansk Oblast, the Republic of Karelia and the
Republic of Komi (Table 5, Fig. 8).
— ♦ —Arhangelsk Oblast
■ * ■ Krasnoyarsk Krai
Murmansk Oblast
Nenets Autonomous Okrug
Republic of Karelia
—•- Komi Republic
Saha Republic
■■■■■■ в»Chukotka Autonomous Okrug
« ■■■ вYamalo-Nenets Autonomous Okrug
Fig. 8. Values of the Digitalization Index (IDR) in the regions of the Russian Arctic in 2014–2020 24.
At the same time, if we analyze the annual “Rating of ICT costs of regions” 25, in 2021, the Yamalo-Nenets Autonomous Okrug was in the seventh place among all regions of Russia in terms of ICT spending; the Republic of Sakha was in the ninth place. Other AZRF regions rank twentyfourth place and below (Fig. 9). If ICT spending is ranked on a per capita basis, the Nenets Autonomous Okrug and the Yamalo-Nenets Autonomous Okrug would be in first and second place, respectively. All regions of the Russian Arctic in the ranking of ICT spending per capita improved their positions from 1 to 66 points, except for the Krasnoyarsk Krai (Fig. 9).
Nenets Autonomous Okrug: | 422 million rubles(67 place)
Krasnoyarsk Krai, 514 rubles (61 place)
Chukotka Autonomous Okrug: 11 464 million rubles(61 place)
Republic of Karelia: ям
549 million rubles (56 place) ®
Murmansk Oblast:
1019 million rubles (37 place) ui
Republic of Karelia, 914 rubles (34 place)
Arhangelsk Oblast, 1221 rubles(25 place)
Arhangelsk Oblast: 1343 million rubles (31 place)
Murmansk Oblast, 1274 rubles (21 place)
Komi Rebublic, 2008 rubles(ll place)
Krasnoyarsk Krai; 1492 million rubles(27 place)
Komi Republic: 1607 million rubles(24 place)
Saha Republis, 3348 rubles (8 place)
Saint-Petersburg 4068 rubles (6 place)
Saha Republic: 3348 million rubles (9 place)
Chukotka Autonomous Okrug, 4635 rubles (4 place)
Yamalo-Nenets Autonomous Okrug: 3626 million rubles (7 place)
Moscow; 76300 million rubles (1 place)
Saint-Petersburg: 21558 million rubles (2 plact)
Moscow, 6153 rubles (3 place)
Yamalo H enets Autonomous Okrug, 7252 rubles (2 place)
Nenets Autonomous Okrug, 10550 rubles (1 place)
Region's ICT Spending, million rubles, 2021
ICT spending per capita, rubles, 2021
Fig. 9. Expenditure on ICT in absolute terms and per capita in the regions of the Russian Arctic, Moscow and St. Petersburg in 2021 26
In 2021, only 24 regions of the Russian Federation had a positive increase in ICT spending, including 5 regions of the Russian Arctic. The leader among all regions of the Russian Federation and the regions of the Russian Arctic in terms of growth in spending on ICT is the Republic of Komi (+99.6%). The seventh place among all Russian regions and the second place among regions of AZRF is occupied by the Yamalo-Nenets Autonomous Okrug (Fig. 10).
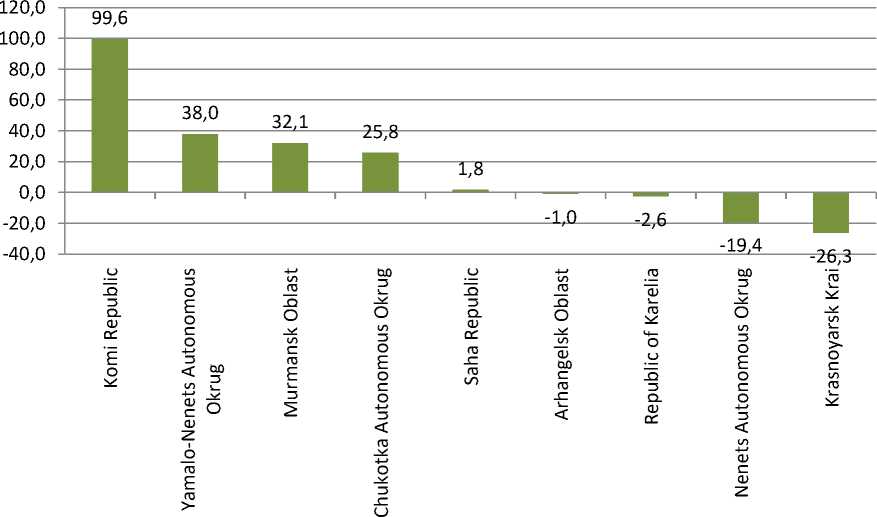
■ ICT spending growth rate, %
Fig. 10. Growth rate of ICT spending in the regions of the Russian Arctic in 2021
Discussion
The lack of publicly available statistics for individual municipalities makes it difficult to analyze the digitalization of the Arctic regions. It is possible that the level of digitalization in five of the nine regions of the Russian Arctic may even be lower than that obtained in the analysis, since the calculations were influenced by the indicators of more southern regions, which are presumably higher than in the regions included in the Russian Arctic. More objective studies require statistical data by municipalities included in the Russian Arctic. Based on the analysis, high ICT costs per capita in the regions of the Russian Arctic do not always lead to high digitalization of the region, as is the case with the Chukotka Autonomous Okrug. This may be due to some problems in the economy of a particular region, which do not allow efficient use of investments in the development of ICT. Subsequent studies should be directed to more detailed research of the causes of this phenomenon.
Conclusion
It can be stated that during the analyzed period, the regions of the Russian Arctic have undergone technological changes: on average, one household has 2–3 mobile phones and one personal computer. In addition to computers, the population of the Russian Arctic actively uses other devices to access the Internet, in particular tablets, laptops and netbooks. However, the share of households with broadband access to the Internet does not reach the average Russian level in five of the nine regions of the Russian Arctic. This forces the population to use mobile
NORTHERN AND ARCTIC SOCIETIES
Lyubov A. Kuratova. Features of Digitalization of the Arctic Regions of Russia broadband access to the Internet. Even with an increase in the number of people using public services online, only the Yamalo-Nenets Autonomous Okrug has a higher rate than the national average, and the population of the Russian Arctic ordering goods, works, and services via the Internet is lower than the average for Russia in five regions of the Russian Arctic. The main limitations of infrastructure digitalization in the Arctic regions arise under the influence of the geographical factor (difficult terrain, harsh climate) and the concentration of potential consumers in cities. Even in small urban settlements there are restrictions on the availability of mobile communications. Remote rural settlements are characterized by a low communication signal, low speed of Internet access, faulty equipment, and lack of knowledge among the population about the available technical capabilities. The widening gap in the development of digitalization in urban and rural areas in the regions of the Russian Arctic will lead to the fact that more and more factors of production will move from less digitalized areas to more digitalized ones.
Rather low levels of digitalization of the population and households are observed in the Nenets Autonomous Okrug, Chukotka Autonomous Okrug, as well as in the Republic of Sakha. Due to the social importance of digital infrastructure in the AZRF space, the main role in increasing the level of digitalization of these regions remains with the state: in the form of preferential loans and subsidies for telecommunications operators, ensuring equal access to digital infrastructure not only in urban, but also the countryside. The main attention should be paid to the development of newer generations of information and communication types of communication. In the Chukotka Autonomous Okrug, due to the low data transfer rate and the low share of electronic document management, the digitalization of the activities of the authorities is weak, which means that measures are required to further digitalize the activities of the regional authorities. The Yamalo-Nenets Autonomous Okrug, the Arkhangelsk Oblast and the Republic of Sakha have the lowest rates of digitalization of organizations, which makes it relevant to support entrepreneurial initiatives aimed at developing digital technologies and encouraging organizations to introduce digital technologies. The methodology presented in the article is based on publicly available statistical data and can be used for territories of various levels when conducting retrospective analysis and strategic forecasting procedures. The practical significance of the study lies in the fact that the methodology can be in demand when assessing the digitalization of the space of the region by regional and municipal authorities when developing a strategy for socio-economic development and programs for the digitalization of regions, and its results can be used as the basis for teaching materials in the framework of higher education institutions. The prospects for further research are determined by a deeper analysis of the degree of influence of variables on the level of digitalization of the Russian Arctic regions and the formation of relevant proposals and recommendations for adapting digitalization processes, taking into account current exacerbations of the international situation.
References Features of Digitalization of the Arctic Regions of Russia
- Killan A. Defining Digital Space through a Visual Language: Master of Sciences Thesis. Massachuttes Institute of Technology, Department of Architecture, 2000, 118 p.
- Kukul T., Coşkun E.A. Stratified Space by the Integration of Physical and Digital Spaces. Proc. 29th Conf. on Education in Computer Aided Architectural Design in Europe, Ljubljana, Slovenia, 2011, pp. 951–959.
- Castells M. The Rise of the Network Society. Wiley-Blackwell, 2000, 594 p.
- Castells M. Vlast' kommunikatsii [The Power of Communication]. Moscow, Publishing House of the Higher School of Economics, 2020, 591 p.
- Heeks R. ICT4D2.0: The Next Phase of Applying ICT for International Development. Computer, 2008, no. 41 (6), pp. 26–33. DOI: 10.1109/MC.2008.192
- Bukht R., Heeks R. Defining, Conceptualising and Measuring the Digital Economy. International Or-ganisations Research Journal, 2017, vol. 13, no. 2, pp. 143–172. DOI: 10.17323/1996-7845-2018-02-07
- Hardy A. The Role of the Telephone in Economic Development. Telecommunications Policy, 1980, vol. 4, no. 4, pp. 278–286.
- Stanley T.D., Doucouliagos C., Steel P. Does ICT Generate Economic Growth? A Meta-Regression Analysis. Journal of Economic Surveys, 2018, vol. 32, no. 3, pp. 705–726.
- Hanseth O. From Systems and Tools to Networks and Infrastructures — from Design to Cultivation: Towards a Design Theory of Information Infrastructures. Industrial Informatics Design, Use and In-novation: Perspectives and Services, 2010, pp. 122–156. DOI: 10.4018/978-1-61520-692-6.ch011
- Pironti J.P. Key Elements of a Threat and Vulnerability Management Program. Information Systems Control Journal: The Magazine for IT Governance Professionals, 2006, no. 3, pp. 1–5.
- Thapa D., Sæbø Ø. Exploring the Link between ICT and Development in the Context of Developing Countries: A Literature Review. The Electronic Journal of Information Systems in Developing Coun-tries, 2014, vol. 1, no. 64, pp. 1–15. DOI: 10.1002/j.1681-4835.2014.tb00454.x
- Palviaa P., Baqir N., Nemati H. ICT for Socio-Economic Development: A Citizens’ Perspective. Infor-mation and Management, 2017, vol. 55, no. 2, pp. 160–176. DOI: 10.1016/j.im.2017.05.003
- Liao H., Wang B., Li B., Weyman-Jones T. ICT as a General-Purpose Technology: The Productivity of ICT in the United States Revisited. Information Economics and Policy, 2016, vol. 36, pp. 10–25. DOI: 10.1016/j.infoecopol.2016.05.001
- Moulton B.R. GDP and the Digital Economy: Keeping Up with the Changes. Understanding the Digi-tal Economy: Data, Tools, and Research. In: Understanding the Digital Economy. Cambridge, MIT Press, 2000, pp. 34–48.
- Walsham G. Development Informatics in a Changing World: Reflections from ICTD2010/2012. In-formation Technology for Development, 2017, vol. 23, no. 1, pp. 18–41. DOI: 10.1080/02681102.2016.1246406.
- Haltiwanger J., Jarmin R.S. Measuring the Digital Economy. In: Understanding the Digital Economy. Cambridge, MIT Press, 2000, pp. 13–33.
- Kozlov A.V., Teslya A.B., Ivashchenko A.A. Otsenka urovnya tsifrovizatsii regionov s primeneniem nechetkoy logiki [Evaluation of Digitalization Level of Regions with Fuzzy Logic Appliance]. Uprav-lenie ustoychivym razvitiem [Managing Sustainable Development], 2021, no. 4 (35), pp. 21–31.
- Kozlov A.V. Opredelenie urovnya razvitiya tsifrovoy infrastruktury v regione: metodika i sravnitel'nyy analiz na primere territoriy rossiyskoy Arktiki [Determining the Level of Digital Infra-structure Development in the Region: Method and Comparative Analysis on the Example of the Territories of the Russian Arctic]. Regional'naya ekonomika i upravlenie: elektronnyy nauchnyy zhurnal [Regional Economy and Management: Electronic Scientific Journal], 2019, no. 2 (58): 5813.
- Kozlov A.V. Metod opredeleniya urovnya razvitiya tsifrovoy infrastruktury regiona s primeneniem apparata nechetkikh mnozhestv na primere Murmanskoy oblasti [Method for Determining the Lev-el of Development of the Digital Infrastructure of a Region Using the Fuzzy Sets Theory: Case of the Murmansk Region]. Sever i rynok: formirovanie ekonomicheskogo poryadka [The North and the Market: Forming the Economic Order], 2020, no. 1 (67), pp. 106–117. DOI: 10.37614/2220-802X.1.2020.67.009
- Sadyrtdinov R.R. Uroven' tsifrovizatsii regionov Rossii [The Level of Digitalization of the Regions of Russia]. Vestnik Chelyabinskogo gosudarstvennogo universiteta [Bulletin of Chelyabinsk State Uni-versity], 2020, no. 10 (444), pp. 230–235. DOI: 10.47475/1994-2796-2020-11029
- Kamneva V.V., Baeva D.A. Otsenka urovnya tsifrovizatsii na osnove regional'nogo indeksa setevoy gotovnosti [Assessing the Level of Digitalization Based on Regional Network Readiness Index]. Vest-nik Yuzhno-Ural'skogo gosudarstvennogo universiteta. Ser.: Ekonomika i menedzhment [Bulletin of the South Ural State University. Ser.: Economics and Management], 2021, no. 1, pp. 37–44. DOI: 10.14529/em210104
- Katz R., Koutroumpis P., Callorda F.M. Using a Digitization Index to Measure the Economic and So-cial Impact of Digital Agendas. Emerald Group Publishing Limited, 2014, vol. 16, no. 1, pp. 32–44. DOI: 10.1108/info-10-2013-0051
- Tang L., Lu B., Tian T. Spatial Correlation Network and Regional Differences for the Development of Digital Economy in China. Entropy, 2021, vol. 23 (12), 1575. DOI: 10.3390/e23121575
