Features of the dynamics of prices for agricultural products of the northern countries

Author: Olga P. Sushko
Journal: Arctic and North @arctic-and-north
Section: Economics, political science, society and culture
Article in issue: 26, 2017.
Free access
Price dynamics for agricultural products of the northern countries is determined by many factors. The methods of economic and mathematical analysis of the dynamics of prices for agricultural products of the northern countries have allowed to identify trends, seasonal and cyclical processes. The dynamics of prices from 1991 to the present time there are two long opposite trends. Cyclic processes have a duration of 2–4 years. Seasonality in change of prices is sustainable due to natural biological processes under the influence of climatic factors. Correlation analysis of price series for agricultural products of the northern countries has showed connection of high strength, confirming the presence of trends and periodic components under the influence of the common factors. Short-term price dynamics approximation shows the retention of the increasing price trend.
Food security, economic and mathematical analysis of the dynamics of prices of agricultural products, the opposite trends, seasonal and cyclical processes, the correlation of time series of prices, approximation
Short address: https://sciup.org/148318601
IDR: 148318601 | UDC: 338.12.017 | DOI: 10.17238/issn2221-2698.2017.26.38
Text of the scientific article Features of the dynamics of prices for agricultural products of the northern countries
The basis of food security of any country is developed agriculture and agro-industrial production, providing the population's needs for food. But for most countries, the agricultural sector is an industry with low profitability of production and with large and long-term investment costs. The innovative vector of industrial development with high-tech and science-intensive industries in European countries also exerts pressure on the agrarian sector of these countries [1, Metelkina N.K.]. Moreover, developed European countries are the indicator of international structural economic changes with the growth of the share of services in the gross national product and the decline in the share of agriculture. Today, in the structure of the gross output of the northern countries (Sweden, Norway, Finland, Denmark, etc.), the share of agriculture together with the extractive industry is in the range of 2–4%1. The exception is Iceland, where, due to intensive development of sheep breeding and fishing, the agricultural and extractive industries reach 15% of the total volume of gross production [2, Phillipova O.B.]. But the extremely severe conditions of Iceland do not allow to farm.
In addition, in modern terms of economic globalization, there is the increase in interstate competition in the agricultural market. Fluctuations and mounting tension in agro-industrial markets primarily affect negatively the countries dependent on imported agricultural supplies. Thus, due to low positive temperatures and a short agricultural season, the northern countries cannot fully meet their own needs in cereals, fruit and vegetable crops. The border zone for the cultivation of many important cereal crops is Norway2, where the reproduction of juicy forages has become the basis of plant growing. Severe natural conditions determined the development of the livestock sector with the simultaneous increase in the cultivation of forage grains in the northern countries.
These trends in the world economy, together with the natural climatic and environmental constraints of the northern countries, become serious challenges for the development of the agricultural sector, which is the basis of the country's food security and the well-being of the population [3, Sizova T.M.]. Therefore, for the northern countries with a small population, the intensification of agriculture becomes a state policy aimed at improving the country's food security in the long term.
Bearing in mind the price growth for most agricultural products on the world market, we conducted a study of the dynamics of prices for agricultural products of the northern countries.
Methods, objects of research
The subjects of the study are northern European countries: Sweden, Norway, Finland, Denmark, Iceland and Canada. For the current analysis, a database of European prices for agricultural products was formed for the period from 1991 to 2015. Information on prices of agricultural products in the northern countries was based on data from international statistical organizations: FAOSTAT3, Indexmundi 4.
The objects of research are prices for the main types of agricultural products. For the agriculture sector, three groups of time series of prices have been developed: cereals, vegetables and fruits. The share of the study of trends in the livestock sector is built sampling the prices of milk, eggs and two kinds of meat.
At the initial stage of the study, the methods of empirical research (observation, comparison, measurement) were used with observance of the basic requirements: activity, conformity to plan, regularity, which allowed to systematize the primary information for the subsequent stage of the study. Further, various methods of economic-mathematical and statistical analysis were used [4, Kremer N.Sh., Putko B.A; 5, Liventsev N.N.]. Statistical analysis included calculation of basic and chain indicators of price dynamics. Economical and mathematical methods were used to determine the structure of price dynamics: dispersion, correlation, regression analysis. At the last stage of the study, additive models of time series of prices for agricultural products of the northern countries were developed.
The results of the study
The autocorrelation analysis of the dynamic series of prices of agricultural products in the northern countries made it possible to reveal the structure [5, Liventsev N.N.]. For time series of prices of agricultural products, the correlation coefficients from the first order to the 4th order between successive levels of the same price series were calculated. Having calculated several autocorrelation coefficients and the autocorrelation function, we determined that the time series contain a tendency and oscillations with certain periods (Table 1).
Table 1
Private coefficients of autocorrelation of time series of meat prices
|
Type of agricultural products |
Coefficient |
|||
|
1st order |
2nd order |
3rd order |
4th order |
|
|
Chicken Meat Sweden |
0.91 |
0.81 |
-0.51 |
0.31 |
|
Chicken Meat Norway |
0.89 |
0.81 |
0.47 |
0.28 |
|
Chicken Meat Finland |
0.82 |
0.71 |
0.41 |
-0.21 |
|
Chicken Meat Iceland |
0.84 |
0.73 |
0.51 |
0.19 |
|
Chicken Meat Denmark |
0.87 |
0.75 |
-0.38 |
0.35 |
|
Beef meat Norway |
0.91 |
0.84 |
0.41 |
-0.27 |
|
Beef meat Finland |
0.95 |
0.86 |
0.39 |
0.26 |
|
Beef meat Iceland |
0.87 |
0.77 |
0.42 |
-0.19 |
|
Beef meat Denmark |
0.88 |
0.82 |
-0.29 |
0.30 |
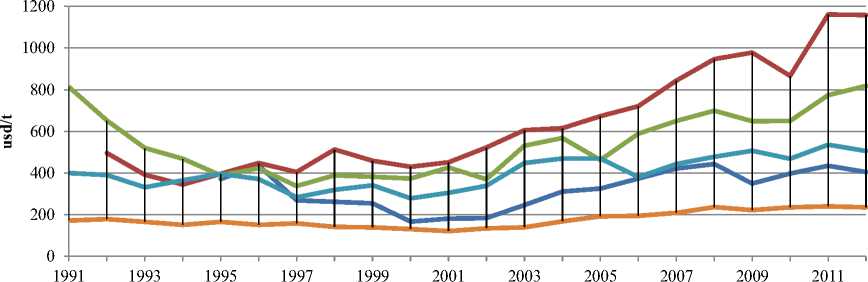
The empirical analysis of the initial series of prices showed that there are multidirectional trends in price dynamics (Figure 1).
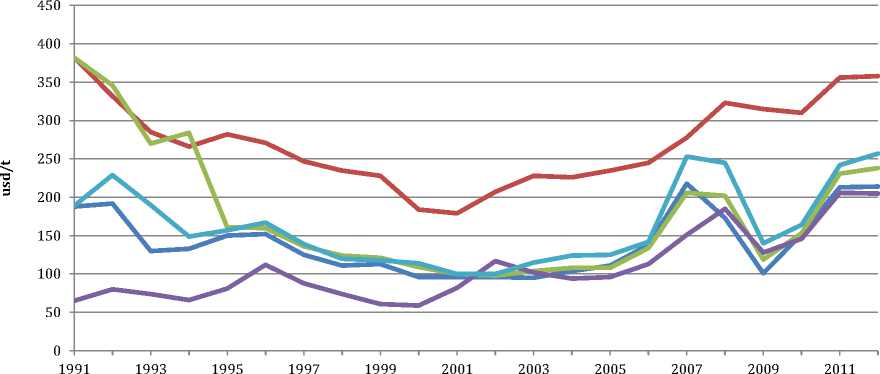
< Овёс Швеция ^^^^^™ Овёс Норвегия < Овёс Финляндия ^^^^^м Овёс Канада < Овёс Дания
Figure 1. Dynamics of prices for oats from 1991 to 2012
URL: (accessed: 20 February 2016)
The calculated correlation coefficients have positive and negative values (Table 1), which indicates the presence of increasing and decreasing trends in the series levels, therefore it is not possible to make an unambiguous conclusion about the nature of the trends, additional calculations are needed. The study of the trend component of time series of prices required the ungrouping and separate analysis of the trend components of time series of prices (Figure 2).
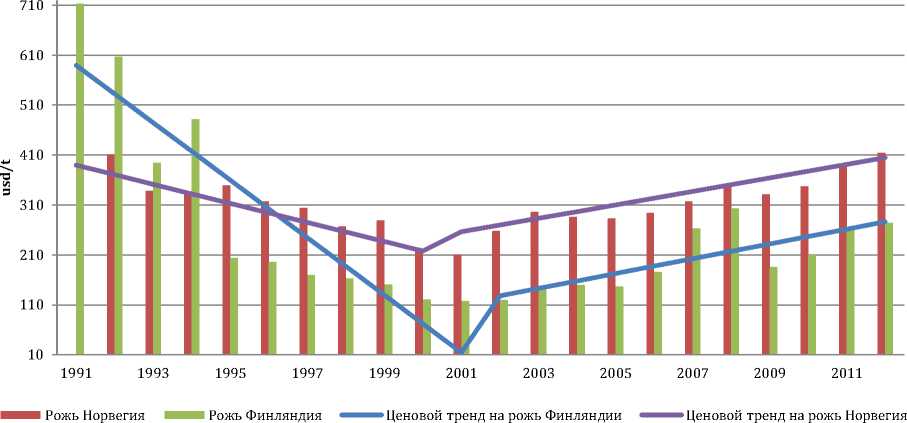
Figure 2. Trends in the dynamics of rye prices from 1991 to 2012 URL: (accessed: 21 January 2016)
Virtually all the studied cereal species contain two differently directed long-term trends in the price movement. A decreasing trend is observed in the period from 1991 to 2002, after which there is an increasing trend (Figure 1 and 2). The analysis of the dynamics of price series showed that a characteristic feature of the movement of price trends of cereals is that by the present time the cost of most types of cereals in Sweden and Norway is close to or slightly higher than the price level of 1991 (Table 2).
Table 2
Change in prices for cereals in the northern countries 5
|
Country |
Type of cereals |
Price, usd/t |
Absolute price change, usd/t |
Relative price change, % |
|
|
1991 |
2014 |
||||
|
Sweden |
Rye |
198 |
270 |
+72 |
136.4 |
|
Wheat |
196 |
290 |
+84 |
148.0 |
|
|
Barley |
197 |
260 |
+63 |
132.0 |
|
|
Oats |
188 |
224 |
+36 |
119.1 |
|
|
Norway |
Rye |
420 |
424 |
+4 |
101.0 |
|
Wheat |
493 |
474 |
-19 |
96.1 |
|
|
Barley |
426 |
412 |
-14 |
96.7 |
|
|
Oats |
382 |
375 |
-7 |
98.2 |
|
|
Finland |
Rye |
713 |
285 |
-428 |
40.0 |
|
Wheat |
550 |
275 |
-275 |
50.0 |
|
|
Barley |
392 |
245 |
-147 |
62.5 |
|
|
Oats |
382 |
256 |
-126 |
67.0 |
|
|
Denmark |
Barley |
191 |
286 |
+95 |
149.7 |
|
Oats |
189 |
273 |
+84 |
144.4 |
|
|
Canada |
Rye |
53 |
259 |
+206 |
488.7 |
|
Wheat |
86 |
274 |
-188 |
318.6 |
|
|
Barley |
65 |
257 |
-192 |
395.4 |
|
|
Oats |
66 |
221 |
-155 |
334.8 |
|
Exceptions are Finland and Canada. In Finland, cereal prices today are more than two times lower than in 1991. This feature can be explained by a decrease in crop production in severe climatic conditions and the reorientation of agriculture to livestock development. Currently, cereal crops do not make more than half of the cultivated area, and about 25% of the land is forage grass, which is sown on permanent pastures or in the order of crop rotation6. There are also changes in the structure of production of grain crops. In Denmark and Sweden, the sowing of wheat and rye is gradually increasing, which grow well on acidic sandy soils. Prices for cereals in Canada by 2014, by contrast, increased significantly compared with 1991. Among the main factors of rising grain prices are improvement in the quality of North American grain, the weakening of the Canadian dollar, globalization of the world grain market [6, Noskova I.Ya., Maximova L.M.].
It should be noted that the level of prices of cereals varied greatly between countries fifteen – twenty years ago (Figure 1, Table 2). The lowest prices for grain were observed in Canada. At the present stage, grain prices in Finland, Sweden, Denmark and Canada are quite close. For example, the prices for rye are in the range of 260–290 USD/ t, for barley — no higher than 260 USD/ t, for oats — from 220 to 275 USD /t. The highest prices for cereals are kept by Norway, as cereals, as already mentioned above, are mainly imported, so their cost increases by the amount of duties and logistics costs.
Annual price fluctuations are associated with changes in crop yields due to weather conditions and the volume of arable land, as agricultural production is a biological process. Significant seasonal processes are revealed in the dynamics of prices for cereals. The average indicators of the seasonal component of time series of prices are presented in Tab. 3.
Table 3
Change in the seasonal component of time series of prices (as an example of the price of oats)
|
Janu ary |
February |
March |
April |
May |
June |
July |
August |
Septemb er |
October |
November |
December |
|
|
Sweden |
+8.6 |
+30.2 |
+44.4 |
+47.8 |
+57.2 |
+15.7 |
-0.7 |
-4.08 |
-16.5 |
-15.9 |
-14.9 |
+0.6 |
|
Denmark |
+10.6 |
+20.2 |
+34.4 |
+37.8 |
+37.2 |
+5.7 |
-0.2 |
-5.08 |
-14.5 |
-18.9 |
-19.9 |
+0.2 |
|
Finland |
+11.6 |
+21.2 |
+24.4 |
+27.8 |
+31.2 |
+15.7 |
-0.1 |
-7.08 |
-19.5 |
-20.9 |
-21.9 |
-0.6 |
Eliminating the trend component and seasonal fluctuations in the dynamics of grain prices, we have identified cyclical processes (Figure 3). Cyclic fluctuations in the dynamics of prices for agricultural products have different duration and amplitude of changes. The cycle duration in most of the time series under study is 2–4 years. At the junction of the trend change (2000–2002), the amplitude of the cycles decreased, so the cycles are not expressed (Figure 3).
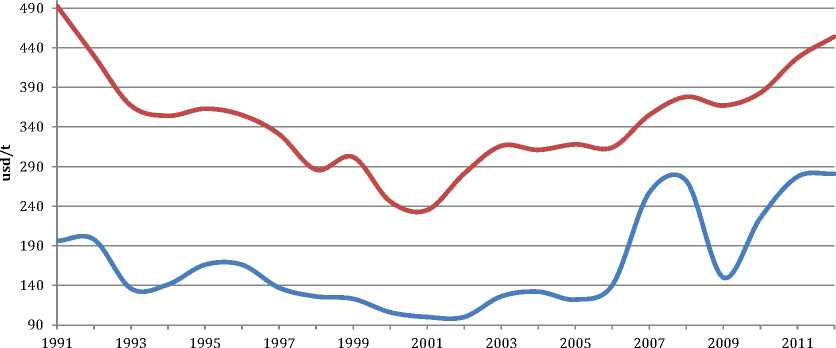
Пшеница Швеция Пшеница Норвегия
Figure 3. Wheat price dynamics cycles from 1991 to 2012 URL: (accessed: 20 February 2016)
The dynamics of prices for fruits and vegetables of the northern countries also decreasing and increasing trend are revealed (Figures 4, 5), except for the prices of North American fruits and vegetables, which were kept at the same level until 1997–1998. For example, the price for apples in Canada was about 220–250 dollars/t, and for strawberry up to 1550 dollars/ t. Then the period of equilibrium was replaced by a rise in prices, which by the current period increased almost 2–2.5
times to the level of 1991 (Figure 4).
^^м клубника Финляндия
^^м клубника Канада
Линейная (клубника Канада )
^^н клубника Дания
Ценовой тренд клубники Финляндия
Figure 4. Dynamics of prices for strawberries from 1991 to 2012. URL: (accessed: 21 January 2016).
Морковь Швеция ^^^^^^ Морковь Норвегия ^^^^^^ Морковь Финляндия ^^^^^^ Морковь Дания ^^^^^w Морковь Канада
Figure 5. Dynamics of prices for carrots from 1991 to 2012 URL: (accessed: 21 January 2016)
Prices for fruits and vegetables today are much higher than in 1991 in all northern countries (Figure 6, Table 4).
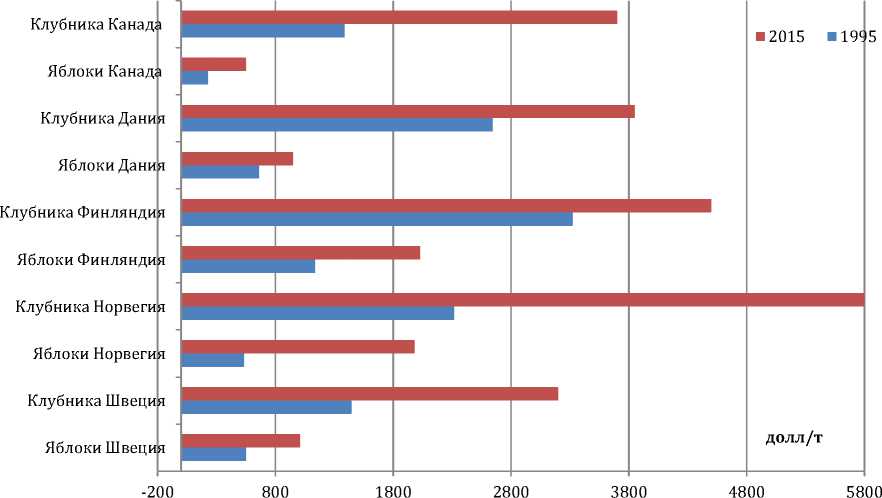
Figure 6. Change in the price of fruit in 1991 / 2015 г. URL: (accessed:21 January 2016).
Table 4
Change in prices for vegetables in the northern countries 7
|
Country |
Type of vegetables |
Price USD/t |
Absolute price change, usd/t |
Relative price change, % |
|
|
1991 |
2014 г. |
||||
|
Sweden |
Carrot |
371* |
430 |
+59 |
115.9 |
|
Courgettes |
209* |
350 |
+141 |
167.5 |
|
|
Cucumbers |
1143* |
1900 |
+757 |
166.2 |
|
|
Tomatoes |
1143* |
1660 |
+517 |
145.2 |
|
|
Potatoes |
277 |
340 |
+63 |
122.7 |
|
|
Norway |
Carrot |
396* |
1250 |
+854 |
315.7 |
|
Courgettes |
543* |
1300 |
+757 |
239.4 |
|
|
Cucumbers |
1645* |
3010 |
+1365 |
183.0 |
|
|
Tomatoes |
2049* |
3600 |
+1551 |
175.7 |
|
|
Potatoes |
356 |
480 |
+124 |
134.8 |
|
|
Finland |
Carrot |
814 |
850 |
+36 |
104.4 |
|
Courgettes |
398 |
- |
- |
||
|
Cucumbers |
1954 |
1850 |
-104 |
94.7 |
|
|
Tomatoes |
2275 |
2300 |
+25 |
101.1 |
|
|
Potatoes |
242 |
220 |
-22 |
90.9 |
|
|
Denmark |
Carrot |
400 |
520 |
+120 |
130.0 |
|
Cucumbers |
335 |
1530 |
+1195 |
456.7 |
|
|
Tomatoes |
1252 |
1600 |
+348 |
127.8 |
|
|
Potatoes |
257 |
180 |
-77 |
70.0 |
|
|
Canada |
Carrot |
172 |
280 |
+108 |
162.8 |
|
Cucumbers |
292 |
650 |
+358 |
222.6 |
|
|
Tomatoes |
159 |
230 |
+71 |
144.7 |
|
|
Potatoes |
134 |
300 |
+166 |
223.9 |
|
Note * — price of 1995.
The rise in prices for vegetables and fruits is also connected with an increase in demand for healthier food and changes in consumer tastes due to the impact of mass media, the results of scientific research, the advertisement of useful and medicinal qualities of vegetables and fruits8. Another factor in the growth of the consumption of fruit and vegetable products is the improvement of the technology of storage, transportation and packaging of grown products, which can maintain quality and presentation for a long time after harvest, and consumers have the opportunity to have fruits and vegetables all year round. New storage technologies are based on the use of modified gas environment and artificial cold, regulation of air pressure and ventilation, chemical treatment, application of protective packaging, etc. Advanced technologies of agricultural technology and selection also allow to grow many types of vegetables and fruits even in harsh conditions of northern countries. But such technologies significantly increase the cost of vegetables and fruits, which can be clearly traced in the dynamics of prices for many types of crop production. Significant increase of prices for vegetables occurred in all northern countries, but the highest rates were recorded in Norway, where prices for many types of vegetables are 1.5–3 times higher than in 2001 (Table 4). For a long time, with the support of the state, scientific research has been carried out in the field of breeding of new breeds of livestock on the basis of genetic achievements. The increase in organic crop production and animal husbandry has become the important area in the development of agriculture in the northern countries, which is based on environmentally friendly methods and production technologies.
So, today in Norway there are about 4 thousand farms out of 46 thousand (according to the Norwegian statistics), which use organic methods and technologies [3, Sizova T.M.]. The development of organic farming is fully supported by the government of Norway, Sweden, Finland. Two areas among the support measures are interesting: subsidizing of farms and financial support for organizations of organic movement9.
In European countries, the growth of the income level of the population has a big impact on the price dynamics, which means that this market becomes attractive for foreign producers, and due to the active development of international trade, imported vegetables and fruits occupy firm position in the agro-industrial markets of the northern countries, while consumers have access to a wide assortment and variety of products.10
A positive aspect of the expansion of international trade in agricultural products is the fact that seasonal production or changes in product yields due to weather conditions are offset by import deliveries, and consumers do not lack vegetables and fruits. But the disadvantage of international trade is that with significant reductions in the harvest of local vegetables and fruits, prices for imported products start to increase, as a result of a fall in domestic supply. Trying not to allow price growth and to keep fair market prices for agricultural products, the state of many northern countries legislatively restricts the import of products11. These measures, along with the target prices set by the state as permissible average prices for agricultural producers, are necessary conditions for stimulating and maintaining domestic reproduction of many types of products that do not experience serious competition with imported goods.
Other methods of stimulation of own agricultural producers are also applied. In Finland and Norway, farmers are exempted from paying taxes, they can enjoy a deferred payment of taxes for the period of implementation of investment projects.
In addition to direct support measures, the government of the northern countries facilitate research in the field of agriculture, provision of educational and consulting services at the expense of state budget funds12. For example, in Norway, subsidies to agricultural producers in 2014 amounted to 14.7 billion NOK, about 60% from which were direct subsidies, and 2.6 billion NOK was spent for the compensation of prices for farms, and the rest was social spending (1.6 billion NOK) 13. Bearing in mind the natural limitations in the development of crop production, the northern countries emphasized efforts to increase livestock and poultry farming, which allowed countries to meet their own needs for meat and dairy products and eggs (Iceland is the exception).
As in the rest of the Scandinavian countries, animal husbandry is the dominant position in agriculture. For example, livestock and poultry accounts for about 80% in the total value of manufactured agricultural products in Finland14. The number of cattle in Finland reaches more than 2 million individuals, despite the fact that there are a little more than 5.5 million people live in the country.
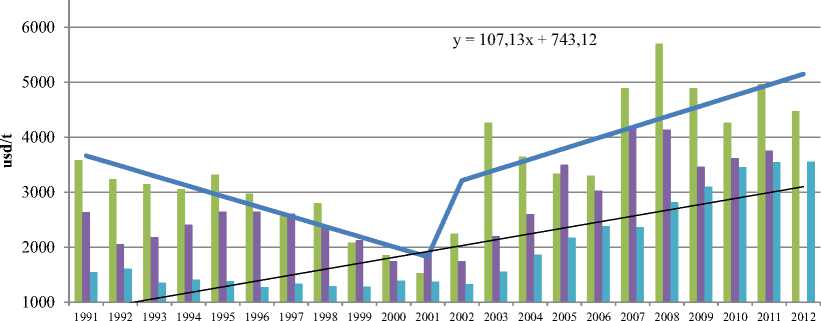
In the dynamics of prices for milk, meat and eggs, there are also two differently directed trends (Figures 7, 8).
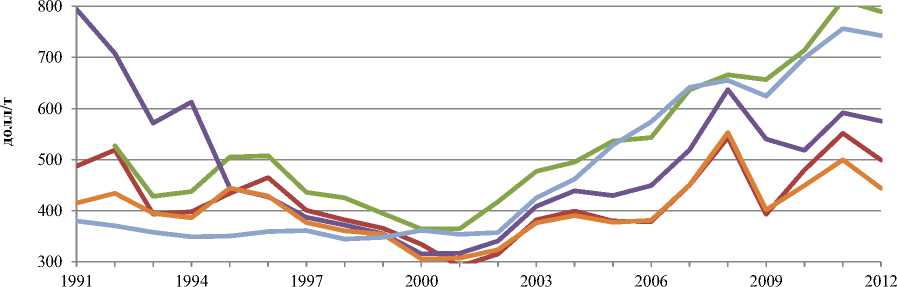
^^^^^™ Молоко Швеция ^^^^^еМолоко Норвегия ^^^^^е Молоко Финляндия ^^^^^^ Молоко Дания ^^^^^е Молоко Канада
Figure 7. Dynamics of prices for milk from 1991 to 2012. URL:
(Accessed: 11 January 2016)
ч ч о

иК|11|
iiiiiiiiiimiiiiiiiiii
ч ч о
1991 1993 1995 1997 1999 2001 2003 2005 2007 2009 2011 2013
Мясо говядина Дания
Тренды динамики цен на мясо Дании
Мясо говядина Норвегия 5525
Figure 8. Dynamics of prices for milk from 1991 to 2012. URL: (Accessed: 11 January 2016)
Analysis of prices of the modern period shows that the price level, despite a long downward trend until 2000–2001, is significantly higher than 1991 (with the exception of Iceland)
(Table 5).
Change in prices for meat, milk, eggs in northern countries 15
Table 5
|
Country |
Products |
Price, USD/t |
||
|
1991 |
2000 |
2014 |
||
|
Sweden |
Eggs |
1 473 |
879 |
2 010 |
|
Milk |
488 |
334 |
569 |
|
|
Chicken |
2 543 |
1 179 |
n/a |
|
|
Norway |
Eggs |
1 999 |
1 152 |
2 909 |
|
Milk |
n/a |
364 |
850 |
|
|
Chicken |
n/a |
1 851 |
3 462 |
|
|
Finland |
Eggs |
2 898 |
752 |
1 691 |
|
Milk |
794 |
316 |
676 |
|
|
Chicken |
3 274 |
1 024 |
1 982 |
|
|
Iceland |
Eggs |
4 160 |
2 341 |
3 330 |
|
Milk |
822 |
846 |
651 |
|
|
Chicken |
n/a |
3 613 |
3 280 |
|
|
Denmark |
Eggs |
1 015 |
1 050 |
1 850 |
|
Milk |
415 |
305 |
544 |
|
|
Chicken |
872 |
741 |
1 650 |
|
|
Canada |
Eggs |
1 666 |
1 062 |
2 361 |
|
Milk |
380 |
362 |
843 |
Price dynamics for agricultural products, as a mirror, reflects the economic crises. For example, in 1990–1992 prices for many products, including agricultural products, were at a high level. Crisis growth in prices is largely due to the collapse of the European currency exchange rate mechanism, the impact of the recession that began in America and spread to many countries. The end of the crisis of this period was marked by the stabilization of the volume of agricultural production, followed by a downward price trend, which continued until 2000–2001 (Figure 8, Table 5) Presumably, the increase in the prices of goods from 2000–2001 is connected with the European project of liquidation of national currencies that allowed the European countries to raise expenses and that as a result has led to deficiency of the budget of many countries. Against the background of long-term trends in the dynamics of prices for agricultural products, short-term cyclical fluctuations with a period of 2–4 years are observed (Figure 7).
For the initial price series, the correlation coefficients are determined, which are brought to the correlation matrix (Table 6). Correlation analysis allows us to identify similar processes of initial dynamics of different types of agricultural products, these processes arise under the influence of common factors.
Table 6
The correlation matrix of the initial series of prices for agricultural products from 1991 to 2014 (example of Sweden)
|
Kind of products |
Wheat |
Carrot |
Apples |
Milk |
Eggs |
Chicken |
|
Wheat |
1 |
|||||
|
Carrot |
0,79 |
1 |
||||
|
Apples |
0,70 |
0,66 |
1 |
|||
|
Milk |
0,25 |
0,43 |
0,34 |
1 |
||
|
Eggs |
0,38 |
0,35 |
0,42 |
0,28 |
1 |
|
|
Chicken |
0,55 |
0,37 |
0,57 |
0,45 |
0,25 |
1 |
The values of the correlation coefficients show that there is a connection of high and medium strength between the prices of the analyzed objects. A close correlation between the series of prices for plant products (cereals, vegetables, fruits).
Conclusion
Analyzing the price dynamics of agricultural products of the northern countries, we make following brief generalizations:
-
1. The trend in the dynamics of prices for agricultural products from 1991 to the present has undergone changes. Until 2000–2001 there was a decline in prices, which then gave way to growth in all types of agricultural products. A significant drop in prices from 1991 to 2001 was replaced by upswing, but even today in most northern countries prices barely reached the level of 1991. In the vegetable products segment, there was no sharp decline by 2001, but the increase in prices after this period led to the fact that today prices for most types of vegetable products are higher than in 1991. Low prices for vegetables are held in Canada.
-
2. The highest prices for agricultural products are observed in Iceland. Also, high prices are in Norway. The average price level is held by Finland. Vegetables, fruit, meat and cereals in Finland are 15–20% higher16, than on the average in the countries of the European Union, but the prices for dairy products fluctuate at the average European level. And the lowest prices for eggs today are observed in Finland, although from 1991 to 1995 the prices here were much higher than the price level of other countries (with the exception of Iceland). Slightly lower prices for agricultural products are in Sweden and Denmark. For meat products, the lowest prices are maintained throughout the period under study in Denmark. Low prices for most types of agricultural products are noted in Canada. The dynamics of milk prices in Canada is different. There was no decline in prices in the first decade, and the price level today is twice as high as in 1991.
-
3. The dynamics of prices is subject to the influence of numerous factors. Short-term determinants and, above all, climatic conditions, cause seasonal and cyclical fluctuations. Increasing the efficiency of technologies and the emergence of new scientific and technological solutions, the nature of the world's agro-industrial production and export-import trade have a significant influence on the trend component of the dynamics of prices for agricultural products in the long run.
-
4. Realizing that the basis of the country's food security and the health of the nation is state own high-tech agriculture, the governments of the northern countries pursue a policy of strengthening the national agriculture, supporting own agricultural producers through various financial mechanisms, thanks to which one can see the high production potential of the agricultural sector.
Long-term trends in agro-industrial markets are also related to the state of the national and world economies, which determine the level of income and quality of life of the population, and accordingly, the volume of food consumption and the change in the structure of demand. Under the influence of many factors in the dynamics of prices for agricultural products, there are trend, cyclical and seasonal fluctuations.
References Features of the dynamics of prices for agricultural products of the northern countries
- Metelkina N.K. Mirovoe hozjajstvo i ego regulirovanie [World economy and its regulation], Moscow, Stankin, 2004, 470 p.
- Filippova O.B. Mirovoj rynok sel'skohozjajstvennogo syr'ja i prodovol'stvija [World market of agricultural raw materials and foodstuffs], Saint Petersburg, VNIK, 2008, 180 p.
- Sizova T.M. Statistika: Uchebnoe posobie [Statistics: Study Guide], Saint Petersburg, SPb GUITMO, 2005, 80 p.
- Kremer N.Sh., Putko B.A. Ekonometrika [Econometrics], Moscow, 2002, 311 p.
- Livencev N.N. Mezhdunarodnaja ekonomicheskaja integracija: Ucheb. pos. [Econometrics: International Economic Integration: Tutorial], Moscow, Ekonomist, 2008, 375 p.
- Noskova I.Ya., Maksimova L.M. Mezhdunarodnye ekonomicheskie otnoshenija [International economic relations], Moscow, Ekonomik-press, 2009, 550 p.
