Fertility in the European Part of the Russian North in 1990–2015

Author: Arseniy L. Sinitsa
Journal: Arctic and North @arctic-and-north
Section: Economics, political science, society and culture
Article in issue: 27, 2017.
Free access
Based on the Federal State Statistics Service data, the article examines the dynamics of changes in the system of indicators characterizing the birth rate in the regions of the European North of Russia (including urban and rural areas). General and special demographic methods were used for the analysis. In the course of the work it was revealed that by 1999 the number of births in the regions of the European North of Russia had greatly decreased, but by 2015 fertility rates had improved, although the birth rate had worsened. At the same time, the birth rate in the regions of the European North of Russia in general is higher than the average for Russia, but the reproduction of the population has been narrowed for quite a long time already. Finally, the differences between the urban and rural areas are large. In relation to the latter, it is possible to assume the existence of certain problems related to the collection of information.
Fertility, fertility indicators, European North of Russia, regional differentiation
Short address: https://sciup.org/148318584
IDR: 148318584 | UDC: 314.38, 314.8 | DOI: 10.17238/issn2221-2698.2017.27.5
Text of the scientific article Fertility in the European Part of the Russian North in 1990–2015
Socio-economic transformations of the 1980–1990 negatively affected the socio-economic development of the country: they led to a significant reduction in GDP, decrease in the standard of living of the population and the reduction of the state support. The most important negative result is the reduction of the population base. This problem is one of the key issues for the development of the whole country, but in the conditions of the North, it is especially relevant.
The population depends on a large number of factors (including the standard of living), therefore it is a complex integrated indicator and reflects the level of development of the territory where the population lives. At the same time, the population affects the security of the country, which means "the state of the object in the system of its connections in terms of the ability to survive and develop under conditions of internal and external threats" [1, Senchagov V.K., p. 35].
The demographic security is a specific kind of security. It means "the state of demographic processes, which is sufficient for the reproduction of the population without a significant impact of the external factor and the provision of the geopolitical interests of the state with the human resources" [2, Rybakovsky L.L., p. 22].
1 The article was prepared within the framework of RFBR grant 15-06-09027 "Causes and consequences of differentiation of the demographic development of the Russian regions and possibilities of its reduction".
There are many threats to demographic security associated with various aspects of the population reproduction. The purpose of our study is the research of the change in fertility indicators, since it is precisely the problem of the optimal level of fertility that is the basis for solving the problem of optimal rates of population reproduction on a countrywide scale [3, Kvasha A.Ya., p. 85], although the migration also plays a significant role in the northern regions, which is due to the specifics of the development of these territories.
Methods of research
In the Decree of the President of the Russian Federation No. 296 dated 02.05.2014 "On land territories of the Arctic zone of the Russian Federation," it includes fewer territories than traditional allocation [4, Zhukov M.A., pp. 4–20; 5, Konovalov A.M., pp. 51–64; 6, Toskunina V.E., pp. 69–78]. Consequently, to consider the Arctic as the larger territory in comparison with the modern Russian Arctic is more correct, since in this case the researcher can take a comprehensive look at the problems of the development of these territories (including demographic ones) [7, Polovinkin V.N.]. However, the Arctic zone of the Russian Federation should be singled out separately, since these territories are priorities for development from the point of view of the state management, since the "Fundamentals of the state policy of the Russian Federation in the Arctic for the period until 2020" operate within these territories.
Nevertheless, in our opinion, considering the European North of Russia, we should also consider those territories that do not belong to the Arctic. Firstly, only part of the municipal formations belongs to the Arctic zone of the Russian Federation, while from the demographic point of view, other municipalities, for example, in the Arkhangelsk region, do not have significant differences in the level of demographic development from the Arctic ones. At the same time, it is impossible to collect data for constructing of long time series for analyzing changes in the birth rate in municipalities. We can make similar remark when conducting a comparative analysis between regions (for example, Murmansk and Arkhangelsk regions and the Republic of Karelia). Secondly, economic ties between the regions of the European North of Russia are close, which makes it possible to unite them geographically and economically into a single macro region, although from the demographic point of view it is not so homogeneous. Thirdly, priority is given to the development of the Arctic zone of the Russian Federation, but the logic of its development requires the development of neighboring territories that are not included in it, but the climatic and economic differences in them are minimal.
In connection with this, the subject of study is the birth rate of the population of the regions of the European North of Russia (Murmansk, Arkhangelsk regions, Republics of Karelia,
Komi, and Nenets Autonomous District) in 1990–2015. The data for Russia is given to compare the demographic development of the country in general and the concerned regions.
We use the data of the Federal State Statistics Service in our work. Unfortunately, the Nenets AD is not allocated often from the Arkhangelsk region, therefore, in order to unify the submission of material, the data is given together with the Nenets AD, but it is also allocated as a separate region of the Russian Federation.
The analysis of fertility at any level cannot be conducted based on only one or two indicators, since each indicator has its advantages and disadvantages. In this connection, we will use the absolute number of births per year, the total birth rate, the age-specific fertility rates for five-year age groups, the total number of children born by women of different generations, and the total fertility rate.
This topic is relevant, but not so many works are devoted to it. It is possible to note the works of V.V. Fauzer [8–10], but they are mostly covering the North in general, not just its European part. In addition, in his works [8–9], the author emphasizes the demographic potential, not fertility, and [10, Fauzer V.V., pp. 129–144] the age-specific fertility rates and the total fertility rate are not considered. The second author is L.A. Popova. However, the sphere of her interests is predominantly the Komi Republic, while the rest of the European North of Russia is less considered in her works [11–14, Popova L.A.]. It is possible to mention some wore works [15, Toichkina V.P.; 16, Shelygin K.V.; 17, Revich B.A., Harkova T.L., Kvasha E.A. et al.]. We can also note a number of works in which the regions of the European North of Russia are compared with other northern regions in terms of demographic development and in which the measures of the implemented state social and demographic policy are considered [18, Sinica A.L.; 19, Popova L.A.; 20, Shishkina M.A., Popova L.A.]. Nevertheless, the issues of fertility are considered not sufficiently enough. The difference between our work and the other works lies in the fact that we consider the birth rate in all regions of the European North of Russia over a long period of time, attracting a large number of indicators and affecting the differences between urban and rural areas.
Unfortunately, when studying the fertility differences in urban and rural areas, we are faced with the problem of taking into account the ongoing demographic events: the extremely high fertility rates in rural areas in 2011–2014, as well as the sharp decline in the birth rate in 2015, can be related specifically to problems in data collection.2 Among the possible reasons, we can outline the birth rate among military personnel, prisoners, migrants, and also small sample data in rural areas (especially for age-specific fertility rates), although we do not deny the impact of timings and demographic policy measures. In this connection, the conclusions on urban and rural areas are to some extent conditional, and additional research is required to determine the level of fertility in these areas.
The dynamics of changes in number of births in 1990–2015.
This indicator is important, since authorities need to know how many children are born. This is necessary when planning the amounts for various "child" benefits (for the birth of a child, childcare allowance, for families with different number of children and different income levels, etc.), various assistance to families with children and the development of infrastructure for children (hospitals, polyclinics, kindergartens, nurseries, dairy cuisines, shops, cultural facilities and others). In addition, the number of births is the primary information on the basis of which all other indicators are calculated.
Мурманская область
^^^^^^Архангельская область ^^^^^^Ненецкий авт.округ (по правой оси)
^^^^^WРеспублика Карелия t Республика Коми
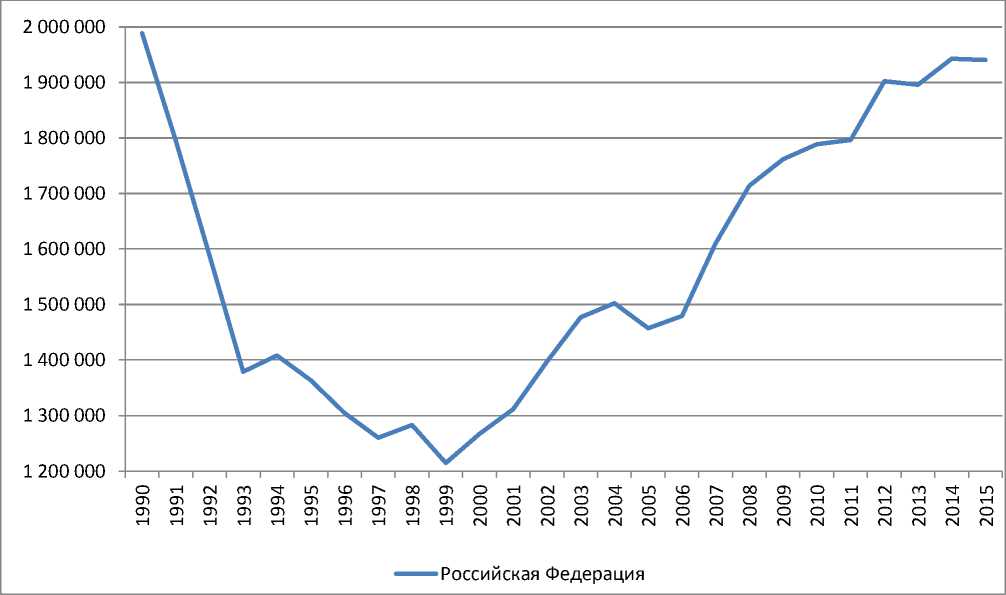
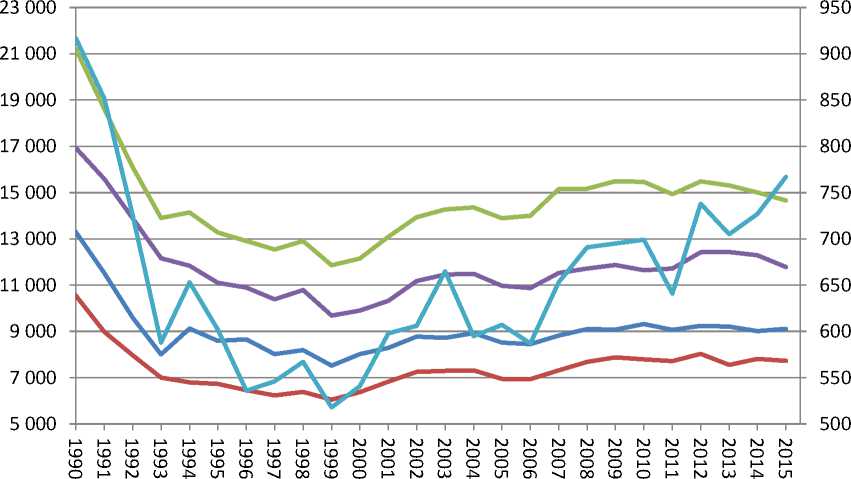
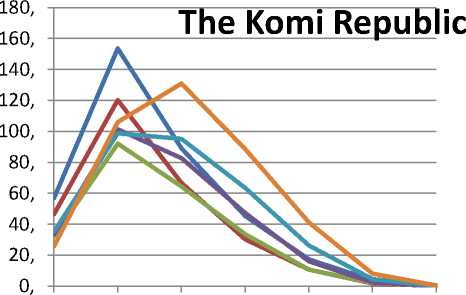
Figure 1. The change in the number of births in the Russian Federation (the lower image) and on the European North of Russia in 1990–2015.3
In the first diagram, the dark blue line is for the Murmansk region, the green line is for Arkhangelsk region, the blue line is for Nenets AD (axis in the right), the red line is for the Republic of Karelia, the violet line is for the Komi Republic.
Fig. 1 shows the dynamics of changes in the number of births in the Russian Federation and in the European North of Russia in 1990–20154.
The decline in the birth rate in Russia was the highest in 1991–1993. During this period the annual number of births decreased from 1,989 thousand to 1,397 thousand (by 30.7%). It was connected with a sharp change in the socio-economic environment and with the fact that the population did not immediately adapt to the changed conditions. As the economic situation in the country worsened, the birth rate continued to decline. In 1999 the absolute minimum number of births (1,215 thousand births) was recorded, and the decrease was 38.9% (see Table 1).
After the beginning of the process of economic stabilization and entry into the reproductive age of numerous generations born in the 1980s, the absolute number of births began to increase. The active state demographic policy contributed to it, which began to be carried out starting from 2007. 1941 thousand children were born in 2015, which is 97.6% of the 1990 level. It means that the pre-reform level was almost reached.
Table 1
The number of births and its percentage change in the Russian Federation and on the European North of Russia In 1990, 1999 and 2015.5
|
Region |
Number of births in 1990 |
Number of births in 1999 |
Number of births in 20156. |
Percentage change (1999 to 1990) |
Percentage change (2015 to 1999) |
Percentage change (2015 to 1990) |
|
The Murmansk region |
||||||
|
Polulation in total |
13,301 |
7,525 |
9,111 (9,017) |
56.6 |
121.1 |
68.5 |
|
Urban population |
12,182 |
6,895 |
8,564 (8,322) |
56.6 |
124.2 |
68.5 |
|
Rural population |
1,119 |
630 |
547 (695) |
56.3 |
86.8 |
70.3 |
|
The Republic of Karelia |
||||||
|
Polulation in total |
10,553 |
6,054 |
7726 (7816) |
57.4 |
127.6 |
73.2 |
|
Urban population |
8,643 |
4,448 |
6355 (5971) |
51.5 |
142.9 |
73.5 |
|
Rural population |
1,910 |
1,606 |
1371 (1845) |
84.1 |
85.4 |
71.8 |
|
The Arkhangelsk region |
||||||
|
Polulation in total |
21,216 |
11,855 |
14,662 (15,005) |
55.9 |
123.7 |
69.1 |
|
Urban population |
14,768 |
8,701 |
11,480 (11,011) |
58.9 |
131.9 |
77.7 |
|
Rural population |
6,448 |
3,154 |
3,182 (3,994) |
48.9 |
100.9 |
49.4 |
|
The Nenets AD |
||||||
|
Polulation in total |
917 |
518 |
767 (727) |
56.5 |
148.1 |
83.6 |
|
Urban population |
499 |
518 |
529 (472) |
52,9 |
200,4 |
106.0 |
|
Rural population |
418 |
264 |
238 (255) |
60.8 |
93,7 |
56,9 |
|
The Komi Republic |
||||||
|
Polulation in total |
16,930 |
9,680 |
11,789 (12,291) |
57.2 |
121.8 |
69.6 |
|
Urban population |
12,608 |
7,216 |
8,853 (8,850) |
57.2 |
122.7 |
70.2 |
|
Rural population |
4,322 |
2,464 |
2,936 (3,441) |
57.0 |
119.2 |
67.9 |
|
The Russian Federation |
||||||
|
Polulation in total |
1,988,858 |
1,214,689 |
1,940,579 (1,942,683) |
61.1 |
159.8 |
97.6 |
|
Urban population |
1,386,247 |
842,640 |
1,455,283 (1,394,860) |
60.8 |
172.7 |
105.0 |
|
Rural population |
602,611 |
372,049 |
485,296 (547,823) |
61.7 |
130.4 |
80.5 |
On the European North of Russia, the situation was slightly different. Similarly, the minimum number of births was reached in 1999, but before 1993, the decrease in the number of births was larger than the average for Russia in all regions except for the Komi Republic. In 1990–
1999 the decline was 43–44%, which is higher than the average for Russia. The increase in the number of births in 1999–2015 was much less, which is due to the migration outflow of the population in reproductive age (it was especially large in the Murmansk region). In the Nenets Autonomous District, it was 48.1%, but even this value is significantly lower than the average in Russia (59.8%). In other regions, the number of births increased only by 21–28%.
As a result, the number of births in these regions for 1990–2015 significantly decreased. In the Nenets Autonomous District, the decrease was 16.4%, and in the others — 27–32%. This means the state policy measures (migration, demographic, socio-economic and other) aimed at developing the demographic potential are not enough in the regions of the European North of Russia. The relatively small decrease in the number of births in the Nenets Autonomous District could be explained by more favorable economic situation in this region, by the younger age and sex structure of the population, as well as by the presence of significant proportion of indigenous small peoples of the North, who are at an earlier stage of the demographic transition and have a higher birth rate.
The areas of the European North of Russia are the territories with extremely high proportion of the urban population [21, Sinitsa A.L., pp. 112–123; 22, Fauzer V.V. et al., pp. 40– 50]. However, the differences in fertility between urban and rural settlements are large.
In general, the number of births in the Russian Federation in urban areas7 increased by 5.0%, and in rural areas decreased by 19.5% for 1990–2015. The birth rate in rural areas in most regions is higher, so it is not surprising that the birth rate decrease was larger there. The number of births in urban areas increased only in the Nenets Autonomous District (by 6.0%). In the Arkhangelsk region the decline was 22.3%, in the Murmansk region — 29.7%, in the Republics of Karelia and Komi — 26.5% and 29.9%, respectively.
The decrease in the number of births in rural areas was more significant. E.g., the minimum rates were recorded in the Republics of Karelia (28.2%) and Komi (32.1%). In the Nenets Autonomous District, the decline was 43.1%. The greatest decrease was observed in the Arkhangelsk (50.7%) and the Murmansk (51.1%) regions — the areas with the highest proportion of urban population.
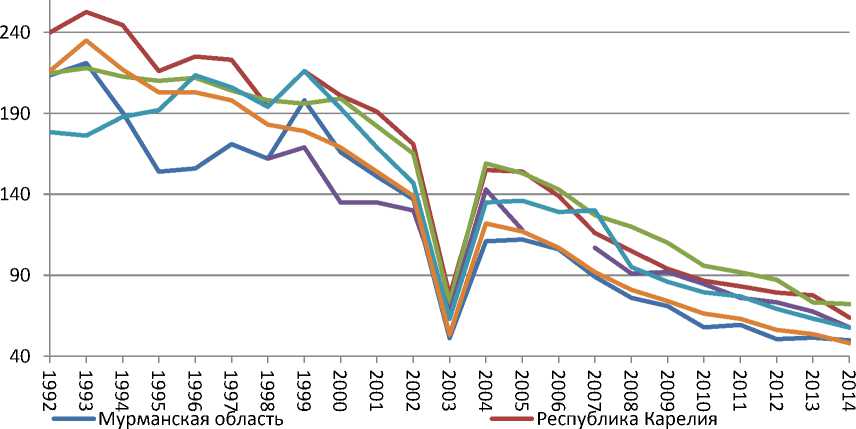
The important factor affecting the number of births is the number of abortions. Fig. 2 shows the dynamics of changes in the number of abortions per 100 births in 1992–20148.
^^^^^ ■ iАрхангельская область ^^^^^^ Ненецкий автономный округ
Figure 2. The number of abortions per 100 births on the European North of Russia in 1992–2014.9
The blue line is for the Murmansk region, the green line is for the Arkhangelsk region, the red line is for the Republic of Karelia, the violet line is for the Nenets AD.
In the times of the USSR, the number of abortions in Russia was great: 4,103.4 thousand pregnancy interruptions were made in 199010, and only 1,988.9 thousand children were born. It means that one birth accounted for slightly more than two abortions. During the period of reforms, the number of abortions in the Russian Federation decreased from 216.1 per 100 births in 1992 to 48.1 in 2014 (the maximum value was 235 abortions per 100 births, recorded in 1993). The decrease in number of abortions favorably influenced the birth rate in the country, but the existing norm of children, which assumes that there should be not more than two children in the family but min. one is necessary for a woman, is too low [23, Sinyavskaya O.V. et al., p. 35].
During the whole period under review, the number of abortions in relation to the number of births decreased both on a national scale and in the regions of the European North of Russia. However, if in the early 1990's the number of cases of abortion in relation to the number of births was below the national average in these regions, then since the mid-1990s this indicator has become higher than the national average in the most of the regions. The exception here is the Murmansk region, where almost all the time, it was below the national average. The highest values were in the Arkhangelsk region and the Republic of Karelia.
The dynamics of the total fertility rate changes
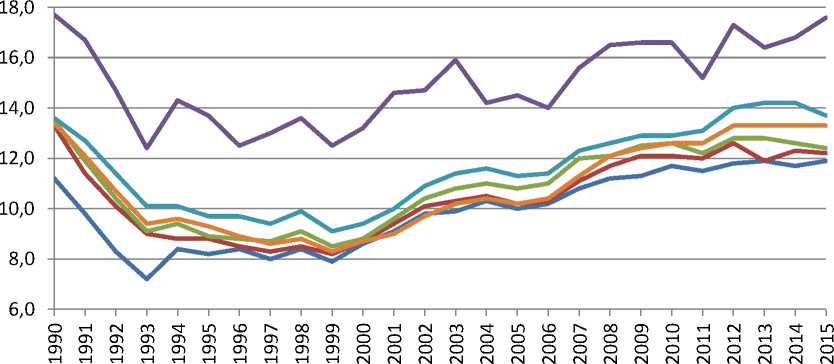
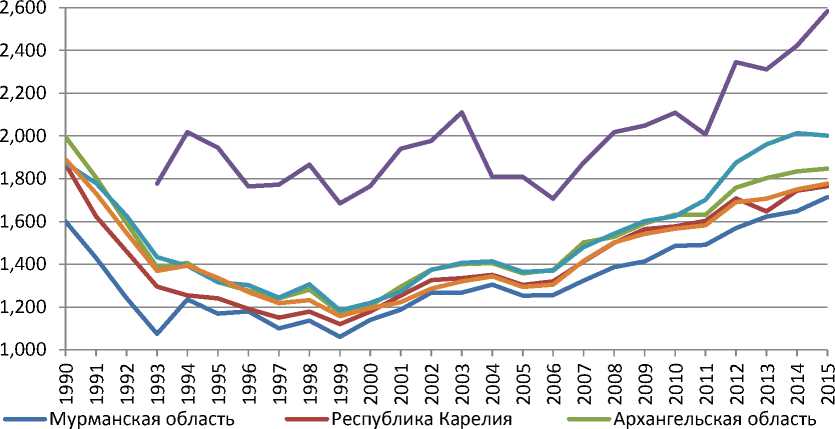
The approximate scale of the evaluation proposed by B. Ts. Urlanis and V.A. Borisov shows that the values of the total fertility rate (hereinafter — TFR) less than 16%, are considered low. Therefore, we can say that during the period under review, the birth rate in Russia was low (see Fig. 3).
The dynamics of the TFR changes in the country repeats the dynamics of changes in the total number of births. Similarly, the maximum value (13.4%) was observed in 1990, and the minimum (8.3%) — in 1999. In 2015 the TFR value was slightly lower than the level of 1990 — 13.3%.
^^^^^™ Мурманская область ^^^^^м Республика Карелия ^^^^^мАрхангельская область
^^^^^™ Ненецкий авт.округ ^^^^^м Республика Коми ^^^^^м Российская Федерация
Figure 3. The TFR in the Russian Federation and on the European North of Russia in 1990–201511
The dark blue line is for the Murmansk region, the red line is for the Republic of Karelia, the green line is for the Arkhangelsk region, the violet line is for the Nenets AD, the blue line is for the Komi Republic, the orange line is for the Russian Federation.
The TFR changes in the regions of the European North of Russia were approximately the same as in the whole country, but in contrast to the dynamics of the total number of births, the TFR in these regions reached the level of 1990 by 2015. In the Murmansk region, its values for the most of the period were the lowest in comparison with other regions and the country, and in the Komi Republic — they were higher. The Nenets Autonomous District should be highlighted separately, as there the TFR was much higher than in other regions. Moreover, the birth rate there in 1990–1992, 2008–2010 and 2012–2015 was more than 16.0%. Significant fluctuations in the Nenets Autonomous District were connected with the small amout of residents and therefore small amount of children. So even small changes in the number of births have a strong influence on the TFR.
Table 2
The TFR in the regions of the European North of Russia in 1990, 1999 and in 201512
|
Region |
1990 |
1999 |
201513 |
Region |
1990 |
1999 |
2015 |
|
The Murmansk region |
The Nenets AD |
||||||
|
Polulation in total |
11.2 |
7.9 |
11.9 (11.7) |
Polulation in total |
17.7 |
12.5 |
17.6 (16.8) |
|
Urban population |
11.2 |
7.9 |
12,1 (11.7) |
Urban population |
15.1 |
10.3 |
16.8 (15.3) |
|
Rural population |
11.1 |
8.5 |
9.9 (12.3) |
Rural population |
22.3 |
16.3 |
19.5 (20.6) |
|
The Republic of Karelia |
The Komi Republic |
||||||
|
Polulation in total |
13.3 |
8.2 |
12.2 (12.3) |
Polulation in total |
13.6 |
9.1 |
13.7 (14.2) |
|
Urban population |
13.4 |
8.1 |
12.6 (11.9) |
Urban population |
13.4 |
9.0 |
13.2 (13.1) |
|
Rural population |
13.2 |
8.4 |
10.7 (14.1) |
Rural population |
14.4 |
9.2 |
15.3 (17.7) |
|
The Arkhangelsk region |
The Russian Federation |
||||||
|
Polulation in total |
13.5 |
8.5 |
12.4 (12.6) |
Polulation in total |
13.4 |
8.3 |
13.3 (13.3) |
|
Urban population |
12.7 |
8.3 |
12.6 (12.1) |
Urban population |
12.7 |
7.8 |
13.4 (12.9) |
|
Rural population |
15.6 |
8.9 |
11.8 (14.5) |
Rural population |
15.5 |
9.6 |
12.8 (14.2) |
As in the other parts of Russia, the fertility was higher in rural areas in the regions of the
European North of Russia (see Table 2), although the fertility was higher in some urban areas in the late 1999 and early 2000s.
The important conclusion is that the measures of the demographic policy, which began to be implemented in 2007 in the mensioned regions, are probably less effective. If before 2008, the TFR for them was above the average for Russia, then startingfrom this year it has remained the same only in the Komi Republic and in the Nenets Autonomous District. However, such situation can be associated with a change in the sex and age structure of the population. In turn, such changes are related to the failures of the demographic policy of the past years (especially in the sphere of migration). All this raises the question of its effectiveness for these territories.
The TFR depends on the structure of the population, therefore, if other terms are equal, it will be higher in regions with a younger population, but this indicator can be used to get a more complete picture, because it shows the dynamics of the change in the birth rate, taking into account the population change. Unfortunately, the TFR depends not only on the intensity of the fertility process, but also on the age, gender and marital structures of the population and gives only a general idea about the level of fertility. Therefore, we need to consider the additional indicators.
Dynamics of the age fertility rates
The Federal State Statistics Service publishes data on age fertility rates for five-year age groups, but not for one-year. It gives less accurate result, but we will use exactly this information. The age fertility rates are calculated for the age group of 50–54, but in whole Russia and in the studied regions it has the meaning of zero for this group, so it was excluded from the examination, and the last group considered is women of 45–49 years old.
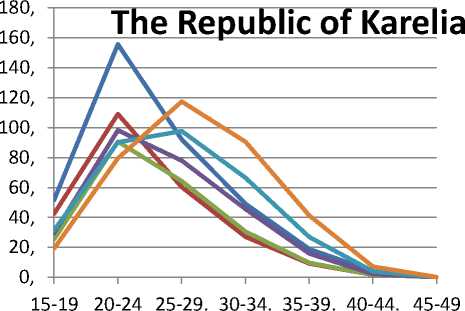
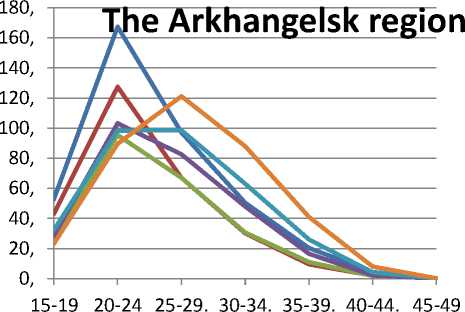
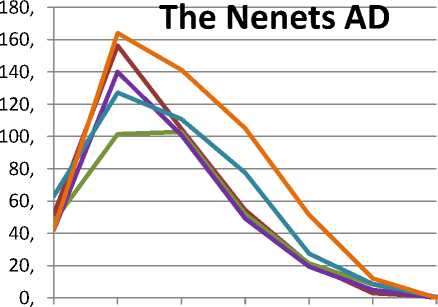
In 1990, the sum of the age fertility rates for the Russian Federation and the regions of the European North of Russia was the largest. That year the birth rate was at the highest level. Before 1999, the birth rate was decreasing. In Fig. 4, it was noted as a decrease in the peak value in the ages of 20–24. In addition, the birth rate at other ages was below the 1990 level.
After the increase of the birth rate in the 2000s, we see the increase in the birth rate for the ages of 25–29 and 30–34, whereas at the ages of 15–19 and 20–24, it continued to decline, that is, the birth rate began to grow old. It has increased especially in the age groups over 35, but the number of births in these groups is small. This is due to the implementation of the deferred births, demographic policy measures aimed at stimulating the birth of children of the second and higher birth order, which usually occurs in later ages. Also we see the increasing importance of careers and other values in comparison with the value of having several children in the family [24, Arkhangelski V.N., p. 45] and the desire of a single women to have a child [25, Toloknova S.S., p. 111].
The lowest age fertility rates for the entire period were observed in the Murmansk region, where they were lower than even the average for Russia. In other regions, they were slightly above average. The highest values for the entire period were observed in the Nenets Autonomous District. Probably, in 2015, they were even higher than in 1990 there, but we cannot be sure because of the lack of data for this period.
If we look at the age fertility rates for urban and rural areas, we will see that for 25 years the birth rate has grown stronger in cities. In 1990 (for the Nenets Autonomous District — in 1993), the maximum values in Russia and in the regions of the European North of Russia, in both urban and rural areas were for the group of 20–24.
In 2015 in Russia and in these regions in urban areas, the maximum value was recorded for the age group of 25–29 years. In rural areas of Russia, the maximum birth rate was for the age group of 20–29 years, while in the European North of Russia, in the Republic of Karelia, the birth rate was the maximum for this age group. In other regions and its rural areas, the age coefficient was the maximum for the ages of 20–24 (see Table 3).
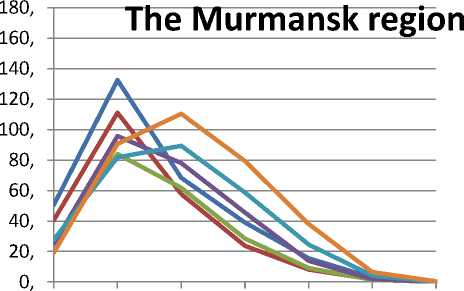
15-19 20-24 25-29. 30-34. 35-39. 40-44. 45-49
^^^^^м 1990 ^^^^^м 1994 г 1999
^^^^^м 1990 ^^^^^м 1994 ^^^^^м 1999
? 2004 г 2009 2015
^^^^^е 1990 ^^^^^м 1994 ^^^^^м 1999
? 2004 г 2009 ^^^^^м 2015
^^^^^w 2004 ^^^^^е 2009 ^^^^^м 2015
15-19 20-24 25-29. 30-34. 35-39. 40-44. 45-49
^^^^^™ 1990
< 2004
^^^^^м 1994
The Russian Federation
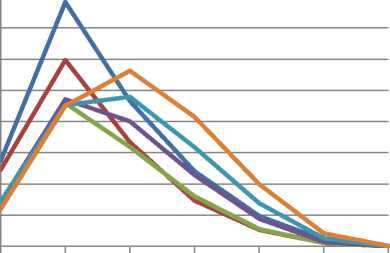
15-19 20-24 25-29. 30-34. 35-39. 40-44. 45-49
' 1994 г' 1999 ^^^^^м 2004 ^^^^^™ 2009 ^^^^^™ 2015
^^^^^ ■ i 1999
^^^^^м 2015
15-19 20-24 25-29. 30-34. 35-39. 40-44. 45-49
^^^^^™ 1990 г - 1994 г - 1999
' : 2004 ^^^^^е 2009 ^^^^^м 2015
Figure 4. The dynamics of the age fertility rates in the Russian Federation and on the European North of Russia
-
14 Vozrastnye koeffitsienty rozhdaemosti. [Age-specific fertility rates]. URL: https://www.fedstat.ru/indicator/30973 (accessed: 15 February 2017) [In Russian].
Table 3
The maximum value of the age fertility rates in the Russian Federation and on the European North of Russia in urban and rural areas in 1990, 2014 and 2015. 15
|
Region |
Year |
Age Group |
Value |
Region |
Year |
Age Group |
Value |
|
Urban areas |
|||||||
|
The Murmansk region |
1990 |
20–24 |
133.4 |
The Nenets AD |
1993 |
20–24 |
141.9 |
|
2014 |
25–29 |
104.3 |
2014 |
25–29 |
116.9 |
||
|
2015 |
25–29 |
112.1 |
2015 |
25–29 |
127.4 |
||
|
The Republic of Karelia |
1990 |
20–24 |
149.5 |
The Komi Republic |
1990 |
20–24 |
144.7 |
|
2014 |
25–29 |
98.1 |
2014 |
25–29 |
105.1 |
||
|
2015 |
25–29 |
110.0 |
2015 |
25–29 |
116.4 |
||
|
The Arkhangelsk region |
1990 |
20–24 |
151.7 |
The Russian Federation |
1990 |
20–24 |
141.2 |
|
2014 |
25–29 |
100.2 |
2014 |
25–29 |
103.9 |
||
|
2015 |
25–29 |
108.3 |
2015 |
25–29 |
109.9 |
||
|
Rural areas |
|||||||
|
The Murmansk region |
1990 |
20–24 |
124.6 |
The Nenets AD |
1993 |
20–24 |
218.6 |
|
2014 |
20–24 |
144.7 |
2014 |
20–24 |
551.4 |
||
|
2015 |
20–24 |
116.5 |
2015 |
20–24 |
578.9 |
||
|
The Republic of Karelia |
1990 |
20–24 |
189.0 |
The Komi Republic |
1990 |
20–24 |
185.9 |
|
2014 |
20–24 |
301.0 |
2014 |
20–24 |
413.8 |
||
|
25–29 |
195.7 |
2015 |
20–24 |
347.4 |
|||
|
2015 |
20–24 |
194.5 |
The Russian Federation |
1990 |
20–24 |
207.1 |
|
|
25–29 |
172.5 |
2014 |
20–24 |
156.9 |
|||
|
The Arkhangelsk region |
1990 |
20–24 |
217.7 |
25–29 |
132.5 |
||
|
2014 |
20–24 |
378.6 |
2015 |
20–24 |
138.7 |
||
|
2015 |
20–24 |
319.4 |
25–29 |
122.8 |
|||
On the national level, the birth rate in urban areas in all age groups was lower than in the rural. In the regions of the European North of Russia, the birth rate in urban areas was also lower in average, but in the early 2000s, and since 2009–2011 the birth rate at the age of over 35 years was at or above the rural level. In the first case, we can relate this to the implementation of deferred births. In the second case, we can connect it with the measures of the demographic support, which began to be implemented in 2007 and 2011 — the maternal (family) capital (including regional) and the provision of land, which led to the birth of children of the second and higher order of births. Another reason is the migration outflow from rural areas in the most active reproductive age — 15–39 years. The only exception is the Murmansk region where the dynamics of age-specific fertility rates is extremely controversial. As a result, for the significant periods of time the birth rate in urban areas was higher or the same as in rural areas. E.g., at the age of 15– 19 years, it was lower for all periods, at the age of 20–29 years it was lower, starting from 1993, and at the age of 30–34 and 45–49 years, it was higher. However, in this region the share of the rural population is extremely low.
-
15 Vozrastnye koeffitsienty rozhdaemosti. [Age-specific fertility rates] URL: https://www.fedstat.ru/indicator/30973 (accessed: 15 February 2017) [In Russian].
The change in the dynmics of the average number of children born by one woman and the total fertility rate
The authorities need to assess the consequences of the current policy. The total fertility rate (hereinafter — TFR) makes it possible. However, it does not give an answer to the question whether the observed increase or decrease in the birth rate is related to the effectiveness of the pursued policy or we are dealing with a change in the calendar of births (timing shift). In order to get an answer, we need to consider the average number of born children in real generations. However, it is necessary to wait for the end of the reproductive period or to consider generations that have not yet completed the process of fertility, which leads to an underestimation of the number of births per woman in younger reproductive ages.
The data on the average number of born children for five-year age groups is from the AllRussian Population Census 16 (see Table 4).
Table 4
The average number of children born by one woman before 1990 in the Russian Federation and on the European North of Russia 17
|
Region |
Year of birth |
Average number of children born |
Region |
Year of birth |
Average number of children born |
|
Total population |
|||||
|
The Murmansk region |
1940 and over |
1.892 |
The Nenets Autonomous District |
1940 and over |
3.239 |
|
1941–1945 |
1.726 |
1941–1945 |
2.662 |
||
|
1946–1950 |
1.744 |
1946–1950 |
2.393 |
||
|
1951–1955 |
1.799 |
1951–1955 |
2.272 |
||
|
1956–1960 |
1.749 |
1956–1960 |
2.253 |
||
|
1961–1965 |
1.627 |
1961–1965 |
2.048 |
||
|
1966–1970 |
1.492 |
1966–1970 |
2.010 |
||
|
1971–1975 |
1.411 |
1971–1975 |
1.809 |
||
|
1976–1980 |
1.227 |
1976–1980 |
1.535 |
||
|
1981–1985 |
0.839 |
1981–1985 |
1.141 |
||
|
1986–1990 |
0.346 |
1986–1990 |
0.578 |
||
|
The Republic of Karelia |
1940 and over |
2.193 |
The Komi Republic |
1940 and over |
2.528 |
|
1941–1945 |
1.917 |
1941–1945 |
2.083 |
||
|
1946–1950 |
1.837 |
1946–1950 |
2.007 |
||
|
1951–1955 |
1.911 |
1951–1955 |
2.046 |
||
|
1956–1960 |
1.885 |
1956–1960 |
1.967 |
||
|
1961–1965 |
1.754 |
1961–1965 |
1.815 |
||
|
1966–1970 |
1.591 |
1966–1970 |
1.661 |
||
|
1971–1975 |
1.466 |
1971–1975 |
1.526 |
||
|
1976–1980 |
1.263 |
1976–1980 |
1.300 |
||
|
1981–1985 |
0.864 |
1981–1985 |
0.921 |
||
|
1986–1990 |
0.367 |
1986–1990 |
0.433 |
||
|
The Arkhangelsk region |
1940 and over |
2.310 |
The Russian Federation |
1940 and over |
2.083 |
|
1941–1945 |
1.999 |
1941–1945 |
1.881 |
||
|
1946–1950 |
1.967 |
1946–1950 |
1.822 |
||
|
1951–1955 |
2.038 |
1951–1955 |
1.879 |
||
|
1956–1960 |
1.996 |
1956–1960 |
1.859 |
||
|
1961–1965 |
1.832 |
1961–1965 |
1.761 |
||
|
1966–1970 |
1.647 |
1966–1970 |
1.637 |
||
|
1971–1975 |
1.513 |
1971–1975 |
1.508 |
||
|
1976–1980 |
1.295 |
1976–1980 |
1.289 |
||
|
1981–1985 |
0.905 |
1981–1985 |
0.886 |
||
|
1986–1990 |
0.400 |
1986–1990 |
0.374 |
The data above testify that the low birth rate issue appeared not yesterday and even the day before yesterday. At the level of the Russian Federation, the replacement of generations was ensured only by women at the age of 70 years and over, as the birth rate at younger ages has provided only a narrow reproduction of the population.
In all the areas of the European North of Russia, except the Murmansk region, the birth rate for real generations is above the all-Russian average. There are three groups among the areas. The first one is represented by the Murmansk region, where the birth rate in any age group did not exceed even 1.9 children per woman. E ven the measures of family support of the 1980s did not have a significant effect on fertility there. The second group includes the Republic of Karelia and the Arkhangelsk region, where the birth rate was slightly higher (equal to the all-Russian average) and exceeded 2.0 children per woman for generations older than 70 years, and in the Arkhangelsk region and for women at the age of 55–59 years. In addition, we may also assume some influence of the 1980’s demographic policy on the birth rate. The third group contains of the Komi Republic and the Nenets Autonomous District, where the number of children exceeded 2.0 to the generations that were respectively 50–54 and 40–44 at the time of the census.
In urban areas of the Russian Federation, the number of children did not exceed 1.825 per a woman, which means only a narrow reproduction. In the Murmansk region, the number of children did not rise above 1.869, and in the Republic of Karelia — above 1.976. In the Arkhangelsk region and in the Republic of Komi the number of children exceeded 2.0 (2.039 and 2.149, respectively) only among women born in 1940 and older. The highest birth rate was in the Nenets Autonomous Okrug, where the number of children per woman became less than 2.0 only for women aged 50–54 and younger, whereas there were 2,653 children for one woman over 70.
In rural areas of the Russian Federation, the birth rate is significantly higher (2.703 for women aged 70 years and older), only for women aged 35–39 years the number of children is less than two. In the Murmansk region and in the countryside, the birth rate was the lowest: amoung the women aged 45–49, the number of children was less than 2.0, and women aged 70 and older gave birth to only 2.324 children in average. In the Republics of Karelia and Komi, the decrease in the birth rate to less than two children per woman occurred for women aged 40–44. Although in the Komi Republic, the level of 2.0 children mignt be overcome. In the Komi Republic, the decrease was more significant, as for women aged 70 and under, the number of births was 3.403, while in the Republic of Karelia – only 2.766. In the Arkhangelsk Region, the number of children born became less than 2.0 only for women aged 35–39 (women aged 70 and over had an average of 3,539 children). Probably this level will be exceeded in the near future. In the Nenets Autonomous District, the birth rate was the highest for women aged 70 years and over (4.199 children), and also at younger ages, as the number of children was less than 2.0 only for women aged 30–34.
^^^^^™ Ненецкий АО ^^^^^™ Республика Коми ^^^^^™ Российская Федерация
Figure 5. TFR in the Russian Federation and the European North of Russia in 1990–2015.18
The dark blue line is for the Murmansk region, the red line is for the Republic of Karelia, the green line is for the Arkhangelsk region, the violet line is for the Nenets AD, the blue line is for the Komi Republic, the orange line is for the Russian Federation.
Fig. 5 shows the change in the birth rate for conditional generations19. The birth rate in the 1990s declined quickly. In 1990, the TFR was 1.892, which is below the level of simple reproduction of the population (2.100), but still quite high. In 1999 it was only 1.157, which is extremely low, and sharply raised the question of the demographic security of the country.
The subsequent increase in the birth rate, related to the improvement of the economic situation, the implementation of deferred births and the active demographic policy, allowed to increase the TFR in 2014 until 1.750, and in 2015 until 1.777, which exceeds the level of 1991. However, nowadays the birth rate is low enough, it is necessary to increase it.
The TFR change dynamics in the regions of the European North of Russia was the same as in the whole country. At the same time, the birth rate of more than 2.0 children per woman was in
-
18 Summarnyi koeffitsient rozhdaemosti. [Total fertility rates] URL: https://www.fedstat.ru/indicator/31517 (accessed:
15 February 2017) [In Russian].
-
19 The data for the Nenets Autonomous District 1990–1992 is absent.
the Komi Republic in 2014–2015 and in the Nenets Autonomous District in 1993, 2003 and 2008– 2015. The birth rate in the Murmansk region and the Republic of Karelia was below the national average, while in the Arkhangelsk region and the Komi Republic it was above average. Nevertheless, the birth rate in the regions of the European North of Russia was low and did not provide even simple reproduction of the population (see Table 5).
Table 5.
The TFR in the Russian Federation and the European North of Russia in 1990, 1999 and 2015. 20
|
Region |
1990 |
1999 |
201521 |
Region |
1990 |
1999 |
2015 |
|
The Murmansk region |
The Nenets AD |
||||||
|
Total population |
1.601 |
1.061 |
1.714 (1.649) |
Total population |
н.д. |
1.685 |
2.584 (2.423) |
|
Urban |
1.609 |
1.051 |
1.724 |
Urban |
н.д. |
1.253 |
2.057 |
|
population |
(1.625) |
population |
(1.828) |
||||
|
Rural population |
1.538 |
1.185 |
1.609 (2.005) |
Rural population |
н.д. |
2.562 |
5.803 (6.094) |
|
The Republic of Karelia |
The Komi Republic |
||||||
|
Total population |
1.868 |
1.120 |
1.766 (1.744) |
Total population |
1.873 |
1.184 |
2.002 (2.013) |
|
Urban |
1.798 |
1.043 |
1.644 |
Urban |
1.755 |
1.096 |
1.720 |
|
population |
(1.517) |
population |
(1.672) |
||||
|
Rural population |
1.755 |
1.441 |
2.873 (3.712) |
Rural population |
2.394 |
1.583 |
4.239 (4.741) |
|
The Arkhangelsk region |
The Russian Federation |
||||||
|
Total population |
1.996 |
1.175 |
1.847 (1.835) |
Total population |
1.892 |
1.157 |
1.777 (1.750) |
|
Urban |
1.797 |
1.074 |
1.636 |
Urban |
1.698 |
1.05 |
1.678 |
|
population |
(1.542) |
population |
(1.588) |
||||
|
Rural population |
2.709 |
1.594 |
3.964 (4.265) |
Rural population |
2.600 |
1.534 |
2.111 (2.318) |
In urban settlements the birth rate was lower compared to rural ones, and so much lower that even in the Nenets Autonomous District it exceeded 2.0 children only in 2015. It should be noted that in the Murmansk region the birth rate in urban areas was at or above the level of other regions (moreover, for the years of reforms the TFR had been increasing there), since 1999. The spread between the regions did not exceed 0.1.
The TFR in rural areas was much higher. In the Russian Federation, it exceeded 2.0 in 1990– 1992 and in 2011–2015; it did not fall below the level of 1.5 children per one woman. In the Murmansk region, the TFR was the lowest. It surpassed the 2.0 mark only in 2014, while in other areas in the early 1990s and 2007–2008 it exceeded this level, and in Nenets AD, it did not fall below 2.56.
High age fertility rates mean a high TFR value. Therefore, it is not surprising that in the Arkhangelsk region and in the rural areas of the Komi Republic, the TFR was close to or exceeded 4.0, and in the Nenets Autonomous District, it was about 6.0, which is not much lower than the TFR in the Republic of Tyva. However, certain problems with accounting of births exist. We do not exclude the existence of the same problems in the European North of Russia and the need to adjust the indicator to the side of reduction.
Conclusion and recommendations
The analysis showed that during the reviewed period, the number of births in the European North of Russia had significantly decreased, and nowadays the rates of population reproduction are not optimal there. It negatively affects the demographic security of the region, which makes a significant contribution to the country's GDP. This is probably connected with the migration outflow of the population in the reproductive age, occurred against the background of negative socio-economic changes caused by a low standard of living in these regions and a weak infrastructure development. After 1999, the number of births began to increase slowly. It is still far for the restoration of the 1990 level, even in case of the significant reduction in the number of abortions, since the population has significantly decreased. At the same time, in 2015, the number of births per 1000 people was almost at the level of 1990 or even higher.
Over the past years, the birth rate has got old. While in 1990 the majority of births occurred whithin the age group of 20–24, in 2015 in all regions, except for the Nenets Autonomous District, births began to occur more often whithin the group of 25–29. At the same time, the peak of the age profiles of fertility has become less expressed, and in the age groups of 20–24 and 30–34 the number of births became comparable, and in the latter group sometimes even higher.
The level of births by real generations ensures a narrow reproduction for a long period. In conditional generations, the birth rate is also below the level of simple reproduction of the population, but in most areas, it is above the national average. This means that the migration inflow is necessary in order to maintain the population, and the government should have a wide range of incentives for it, both material and nonmaterial.
In connection with the fact that the thin generation is now entering in the reproductive age, we can expect the reduction in the absolute number of births during coming years. It is reflected in forecasts of the Federal Service of State Statistics for the period up to 2030, and Laboratory of Population Economics and Demography of the Faculty of Economics of Lomonosov
Moscow State University up to 2050 and will lead to the continued decline in the number of population in this important region of the country.
It is necessary to raise the standard of living of the population and to change the norm of childhood in order to increase the birth rate. The first goal could be achieved by increasing wages, by increasing the amount of child allowances, so that they take a more significant place in the family budget, and by improving the condition and accessibility of the infrastructure (especially "child" and housing). Important measures include: the creation of jobs (especially in singleindustry towns), the increase in the amount of payments for children (up to 1.5–2% of GDP and not less than 2% of GDP for the European North of Russia) and the introduction of more flexible work schedule of organizations connected with children care and their upbringing. The second goal could be achieved by creating the well disposed atmosphere in the society (especially among employers22 and employees of organizations related to servicing the interests of families with children) which assists to support the families with children, including preschool age, and also propagandic measures, aimed at improving the situation. In particular, there is need in a flexible work schedule that takes into account the living situation of mothers with preschool children, and in the public recognition of the caring for children as the important work and not just “staying at home”.
Of course, the connection between the standard of living and the birth rate is not direct. Smith A. wrote about it [28, Smith A., pp. 87–88]. However, this concept is complex and reflects a whole range of needs in the spheres of employment, medicine, education, leisure, pricing policy, housing quality, accessibility of transport etc. The current policy does not allow the population of the European North of Russia to meet the needs of the population living in areas with complex natural and climatic conditions. As a result, there is a discrepancy between socio-economic and demographic policies.
The demographic policy is trying to influence the reproductive attitudes and it has some success in this matter. The importance of the need for children and the nature of the relationship has been discussed (e.g., [29, Arkhangelskii V.N., pp. 36–41, 30, Zvereva N.V., p. 156]). Specialists note that “demographic policy, aimed at creating conditions for the realization of the existing need for children, will not lead to the increase in the birth rate to the level that ensures a simple reproduction of the population ..." [30, Zvereva N.V., p. 156]. It is necessary to increase the value of having several children in the family [30, Zvereva N.V., p. 162], since the change in need for children can give a lasting result and increase the birth rate in a larger volume than just raising the standard of living [30, Zvereva N.V., p. 163]. Nevertheless, the situation when the ideological component of this policy is not fixed by the necessary amount of financial resources is also unacceptable. The upbringing of children begins with their provision and care [31, Rimashevskaya N.M. et al., p. 54; 32, Harchev A.G. et al., p. 36], which means the need to create a certain standard of living for both children and parents. E.g., without the development of the preschool age children care services, the policy of stimulating the birth rate will give a short-term effect, since young mothers and women of pre-retirement age will have difficulty entering the labor market [33, Gosha Z.Zh., p. 69; 34, Sinyavskaya O.V. et al., p. 373].
All discussed above confirms the necessity of combining the increase in the standard of living on the European North of Russia with measures aimed at changing the norms of childhood, increasing the importance of the family and the prestige of childcare work [30, Zvereva N.V., p. 163; 35, Shishkina M.A. et al., pp. 147–158]. This is reflected in the list of measures proposed by us, which, we hope, will contribute to the increase of the demographic security on the European North of Russia.
References Fertility in the European Part of the Russian North in 1990–2015
- Senchagov V.K. Ekonomicheskaja bezopasnost': geopolitika, globalizacija, samosohranenie i razvitie [Economic security: geopolitics, globalization, self-preservation and development]. Moscow, Finstatinform, 2002, 128 p. [in Russian]
- Rybakovskij L.L. Demograficheskaja bezopasnost': geopoliticheskij aspect [Demographic security: the geopolitical aspect]. Narodonaselenie, 2004, N 1, pp. 22–34. [in Russian]
- Kvasha A.Ya. Problemy ekonomiko-demograficheskogo razvitija SSSR [Problems of economic and demographic development of the USSR]. Moscow, Statistika, 1974, 200 p.
- Zhukov M.A. Metodologicheskie i metodicheskie problemy vydelenija Arkticheskoj zony Rossijskoj Federacii [Methodological and methodological problems of allocation of the Arctic zone of the Russian Federation]. Arktika. XXI vek. Gumanitarnye nauki, 2014, N 1 (2), pp. 4–20. [in Russian]
- Konovalov A.M. Prostranstvennoe razvitie Arkticheskoj zony Rossijskoj Federacii na osnove modernizacii jekonomiki Rossii [Spatial development of the Arctic zone of the Russian Federation on the basis of modernization of the Russian economy]. Sovremennye proizvoditel'nye sily, 2014, N 1, pp. 51–64. [in Russian]
- Toskunina V.Je., Gubina O. V., Provorova A. A. i dr. Podhody k rajonirovaniju i opredeleniju granic Arkticheskoj zony Rossijskoj Federacii [Approaches to zoning and defining the boundaries of the Arctic zone of the Russian Federation]. Ekonomicheskie i social'nye peremeny: fakty, tendencii, prognoz, 2013, N 6 (30), pp. 69–78. [in Russian]
- Polovinkin V.N. Chelovecheskie resursy — glavnaja problema razvitija Severa [Human resources — the main problem of the development of the North], Arktika: ekologija i ekonomika, 2013, N 4 (12), pp. 26–31. [in Russian]
- Fauzer V.V. Demograficheskij potencial severnyh regionov Rossii kak faktor ekonomicheskogo osvoenija Arktiki [Demographic potential of the northern regions of Russia as a factor in the economic development of the Arctic], Arktika i Sever, 2013, N 10, pp. 19–47. [in Russian]
- Fauzer V.V. Demograficheskij potencial severnyh regionov Rossii — faktor i uslovie ekonomicheskogo osvoenija Arktiki [Demographic potential of the northern regions of Russia — a factor and condition of economic development of the Arctic]. Ekonomika regiona, 2014, N 4 (40), pp. 69–81. [in Russian]
- Fauzer V.V. Demograficheskie problemy severnyh regionov Rossii: sokrashhenie chislennosti naselenija i snizhenie rozhdaemosti [Demographic problems of the northern regions of Russia: population decline and fertility decline]. Korporativnoe upravlenie i innovacionnoe razvitie ekonomiki Severa: Vestnik Nauchno-issledovatel'skogo centra korporativnogo prava, upravlenija I venchurnogo investirovanija Syktyvkarskogo gosudarstvennogo universiteta, 2015, N 1, pp. 129–144. [in Russian]
- Popova L.A. Rozhdaemost' v Respublike Komi: tendencii i prognoz [Fertility in the Komi Republic: Trends and Forecast]. Region: ekonomika i sociologija, 2005, N 2, pp. 124–135. [in Russian]
- Popova L.A. Effektivnost' prosemejnoj demograficheskoj politiki v Respublike Komi [Efficiency of the family demographic policy in the Komi Republic]. Demograficheskie processy na postsovetskom prostranstve sbornik materialov VI Ural'skogo demograficheskogo foruma s mezhdunarodnym uchastiem. Ekaterinburg: Institut jekonomiki Ural'skogo otdelenija RAN, 2015, pp. 328–334. [in Russian]
- Popova L.A., Shishkina M.A., Butrim N.A. Transformacija reproduktivnogo povedenija naselenija Respubliki Komi: faktory i posledstvija [Transformation of the reproductive behavior of the population of the Komi Republic: factors and consequences]. Region: ekonomika i sociologija, 2015, N 3, pp. 190–212. [in Russian]
- Popova L.A. Demograficheskoe razvitie territorij Pechoro-Ural'skoj Arktiki [Demographic development of the territories of the Pechora-Urals Arctic]. Aktual'nye problemy, napravlenija I mehanizmy razvitija proizvoditel'nyh sil Severa–2014: Mater. Chetvert. Vseross. nauch. semin. (24–
- 26 sentjabrja 2014 g., Syktyvkar): v 2 ch. Ch. I. Syktyvkar, Komi respublikanskaja tipografija, 2014, pp. 97–104. [in Russian]
- Toichkina V.P. Tendencii rozhdaemosti v regionah Evropejskogo Severa [Trends in the birth rate in the regions of the European North]. Sovremennye organizacionno-ekonomicheskie tendencii I problemy razvitija Evropejskogo Severa. Materialy mezhdunarodnoj nauchno-prakticheskoj konferencii. Murmansk, Murmanskij gosudarstvennyj tehnicheskij universitet, 2015, pp. 80–85. [in Russian]
- Shelygin K.V. Rol' rozhdaemosti i smertnosti v depopuljacii Arhangel'skoj i Murmanskoj oblastej [The role of fertility and mortality in the depopulation of the Arkhangelsk and Murmansk regions]. Ekologija cheloveka, 2010, N 8, pp. 42–45. [in Russian]
- Revich B.A., Har'kova T.L., Kvasha E.A. i dr. Demograficheskie processy, dinamika trudovyh resursov i riski zdorov'ju naselenija Evropejskoj chasti Arkticheskoj zony Rossii [Demographic processes, the dynamics of labor resources and health risks of the population of the European part of the Arctic zone of Russia]. Moscow, Lenand, 2016, 304 p. [in Russian]
- Sinitsa A.L. Demograficheskoe razvitie regionov Arkticheskoj zony Rossii v 2010–2014 gg [Demographic development of the regions of the Arctic zone of Russia in 2010-2014]. Arktika: ekologija i ekonomika, 2016, N 1 (21), pp. 18–27. [in Russian]
- Popova L.A. Demograficheskaja politika v severnyh regionah Rossii: osobennosti i prioritety [Demographic policy in the northern regions of Russia: features and priorities]. Region: ekonomika I sociologija, 2010, N 3, pp. 136–153. [in Russian]
- Shishkina M.A., Popova L.A. Vlijanie sovremennoj prosemejnoj demograficheskoj politiki na intensivnost' rozhdaemosti v severnyh regionah Rossii [Influence of modern pro-family demographic policy on the intensity of fertility in the northern regions of Russia]. Ekonomicheskie I social'nye peremeny: fakty, tendencii, prognoz, 2017, N 1 (49), pp. 161–177. [in Russian]
- Sinitsa A.L. Demograficheskoe razvitie gorodov Arkticheskoj zony Rossijskoj Federacii [Demographic development of the cities of the Arctic zone of the Russian Federation]. Ekonomicheskaja nauka sovremennoj Rossii, 2016, N 3. pp. 112–123. [in Russian]
- Fauzer V.V., Lytkina T.S., Fauzer G.N. Osobennosti rasselenija naselenija v Arkticheskoj zone Rossii [Features of population settlement in the Arctic zone of Russia]. Arktika: ekologija i ekonomika, 2016, N 2 (22), pp. 40–50. [in Russian]
- Sinjavskaja O.V., Tyndik A.O., Golovljanicina E.B. V kakih sem'jah rozhdajutsja deti? Faktory reproduktivnogo povedenija v Rossii [In what families are children born? Factors of reproductive behavior in Russia]. Sem'ja v centre social'no-demograficheskoj politiki? Sbornik analiticheskih statej. M, Nezavisimyj institut social'noj politiki, 2009, pp. 19–46. [in Russian]
- Arhangel'skij V.N. Faktory rozhdaemosti [Fertility factors]. Moscow, TEIS, 2006, 399 p. [in Russian]
- Toloknova S.S. Sem'i odinokih materej: formirovanie otnoshenij mezhdu pokolenijami [Families of single mothers: the formation of relations between generations,. Vestnik Nizhegorodskogo universiteta im. N.I. Lobachevskogo. Serija: Social'nye nauki, 2010, N 4 (20), pp. 109–115. [in Russian]
- Arhangel'skij V.N. Rozhdaemost' v regionah Severo-Zapadnogo federal'nogo okruga [Fertility in the regions of the North-West Federal District]. Problemy razvitija territorii, 2016, N 5, pp. 38–56. [in Russian]
- Kvasha A.Ya. Demograficheskaja politika v SSSR [Demographic policy in the USSR]. Moscow, Finansy i statistika, 1981. 200 p. [in Russian]
- Smit A. Issledovanie o prirode i prichinah bogatstva narodov [Inquiry into the nature and causes of the wealth of nations]. T. I. Moscow, Leningrad, Gosudarstvennoe social'no-ekonomicheskoe izdatel'stvo, 1931. 436 p. [in Russian]
- Arhangel'skij V.N. Vlijanie subektivnoj ocenki urovnja zhizni na reproduktivnoe povedenie [The influence of the subjective assessment of the standard of living on reproductive behavior]. Uroven' zhizni naselenija regionov Rossii, 2011, N 8, pp. 36–41. [in Russian]
- Zvereva N.V., Arhangel'skij V.N. Sistema cennostej molodyh ljudej i rol' demograficheskoj politiki v povyshenii rozhdaemosti (po rezul'tatam obshherossijskogo issledovanija molodezhi) [The system of values of young people and the role of demographic policy in increasing the birth rate (according to the results of the all-Russian study of youth)]. Federalizm, 2007, N 2 (46), pp. 155–172. [in Russian]
- Rimashevskaja N.M., Gerasimova I.A., Kopnina V.G. Sem'ja, trud, dohody, potreblenie (Taganrogskie issledovanija) [Family, labor, income, consumption (Taganrog research)]. Moscow, Nauka, 1977. 291 p. [in Russian]
- Harchev A.G., Mackovskij M.S. Sovremennaja sem'ja i ee problemy (Social'no-demograficheskoe issledovanie) [Modern family and its problems (Socio-demographic research)]. Moscow, Statistika, 1978. 223 p. [in Russian]
- Gosha Z.Zh. Generativnaja dejatel'nost' zhenshhin i obespechennost' detskimi doshkol'nymi uchrezhdenijami [Generative activity of women and provision of children's preschool institutions]. Vosproizvodstvo naselenija i uroven' zhizni. Riga: Latvijskij gosudarstvennyj universitet im. P. Stuchki, 1980, pp. 69–75. [in Russian]
- Sinjavskaja O.V., Gladnikova E.V. Potreblenie uslug po uhodu za det'mi rossijskimi domohozjajstvami [Consumption of childcare services by Russian households]. Roditeli i deti, muzhchiny i zhenshhiny v sem'e i obshhestve. Moscow, NISP, 2007, pp. 345–376. [in Russian]
- Shishkina M.A., Popova L.A. Issledovanie reproduktivnyh ustanovok naselenija Respubliki Komi v kontekste opredelenija zadach demograficheskoj politiki [Research of reproductive attitudes of the population of the Republic of Komi in the context of defining the tasks of demographic policy]. Voprosy upravlenija, 2016, № 3 (21), pp. 147–158. [in Russian]
